


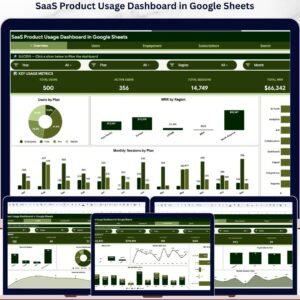
The SaaS Onboarding Dashboard in Google Sheets tracks 12 KPIs across 4 interactive dashboard pages, with 16 pre-built charts and slicers covering MRR, signups, activated users, churn rate, acquisition channels, onboarding status, and retention risk. Setup takes under 10 minutes — paste your data into the Data sheet and every chart updates automatically.
🌍 Join 8,400+ teams in 40+ countries using NextGenTemplates to replace paid SaaS tools with one-time-purchase Google Sheets Dashboards. Built for SaaS founders, customer success managers, and operations leads who need full-funnel visibility without paying $200/month for a BI tool.
✅ Instant download · One-time payment · No subscription · No per-user fees · Lifetime access
🔑 Key Features of SaaS Onboarding Dashboard in Google Sheets
🔹 4-page dashboard structure — dedicated pages for Overview, Acquisition, Onboarding, and Retention, each with independent slicers for filtered analysis
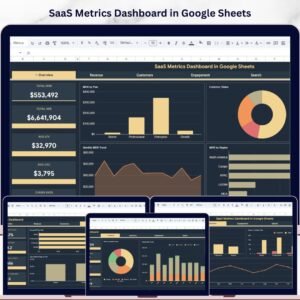
🔹 Tracks 4 top-line KPI cards: Total MRR, Total Signups, Activated Users, and Churn Rate — shown in headline cards on the Overview page for at-a-glance decision-making
🔹 16 pre-built charts across all pages — including MRR by Plan, Status Distribution, Signups by Channel, Monthly MRR by Plan, Signups by Industry, MRR by Country, Users Activated by Company Size, Monthly Activations, Users Managed per CSM, Onboarding Status by Plan, Churn Risk Distribution by Plan, Churned MRR by Plan, Industry Churn Risk Profile, and Monthly MRR by Churn Risk
🔹 Customer Search Sheet — enter any User ID to instantly retrieve that user’s full profile including Signup Date, Plan, Acquisition Channel, Country, Industry, Company Size, MRR, Onboard Status, Days to Activate, CSM, and Churn Risk
🔹 Structured Data Sheet — pre-formatted input table for easy data entry; just add rows in the same column format and all charts reflect your data immediately
🔹 Native Google Sheets slicers on every analysis page — no third-party add-ons or scripts required; slicers filter the entire page simultaneously
🔹 Works in any browser — Mac, Windows, Chromebook; no Excel or software installation required
📦 What’s Inside the SaaS Onboarding Dashboard in Google Sheets
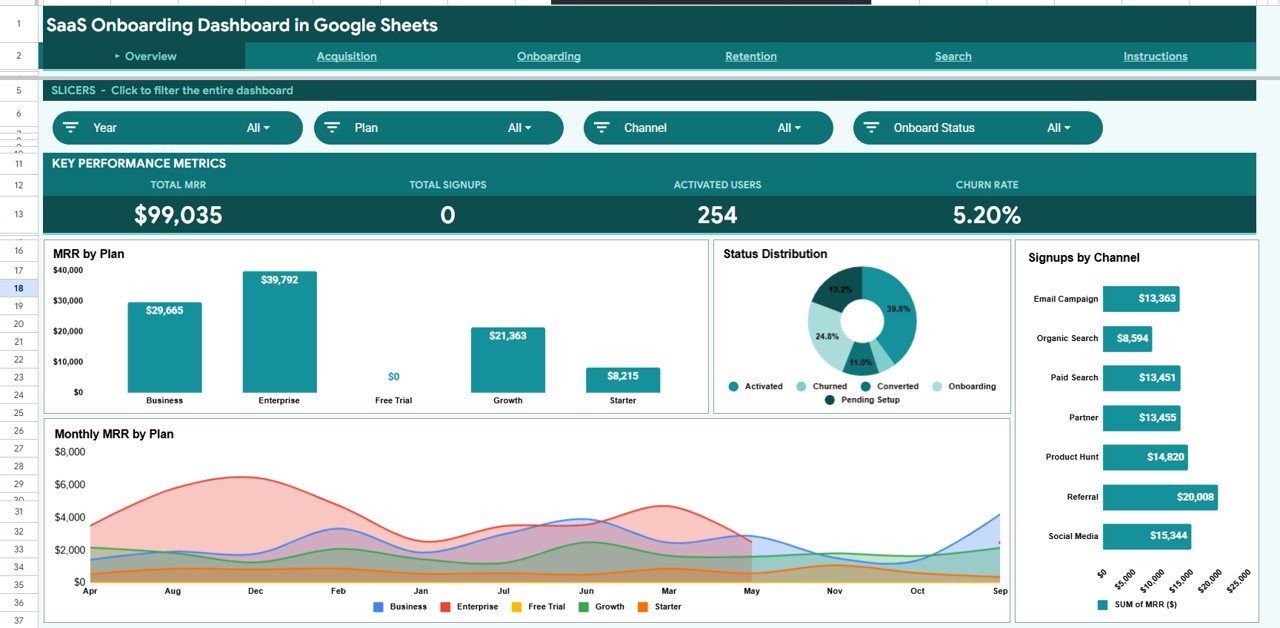
Page 1: Overview
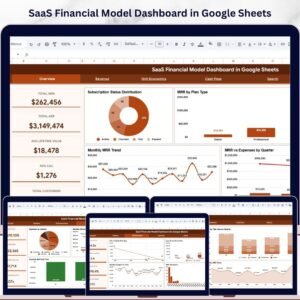
The Overview page displays 4 KPI cards (Total MRR, Total Signups, Activated Users, Churn Rate) alongside 4 charts: MRR by Plan, Status Distribution, Signups by Channel, and Monthly MRR by Plan. Slicers at the top let you filter the entire page by any dimension instantly.
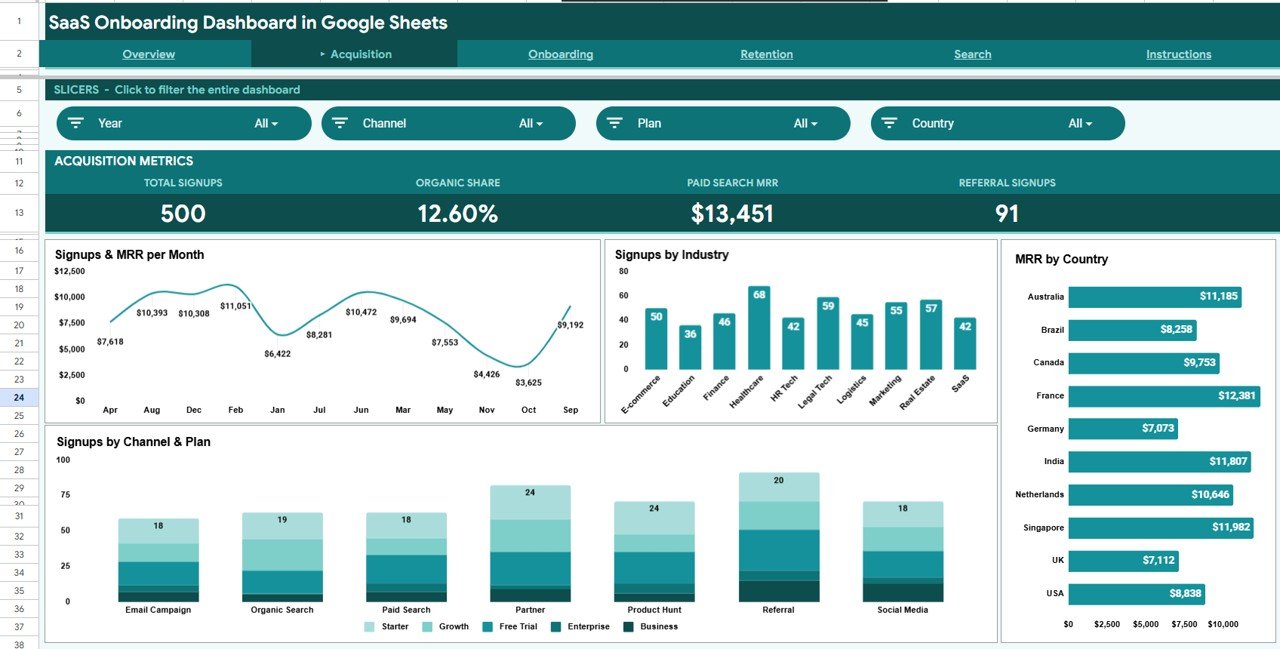
Page 2: Acquisition
The Acquisition page tracks how users are coming in and what they are worth. Charts include Signups & MRR per Month, Signups by Industry, MRR by Country, and Signups by Channel & Plan — giving your marketing and sales teams a clear view of channel ROI and geographic performance.
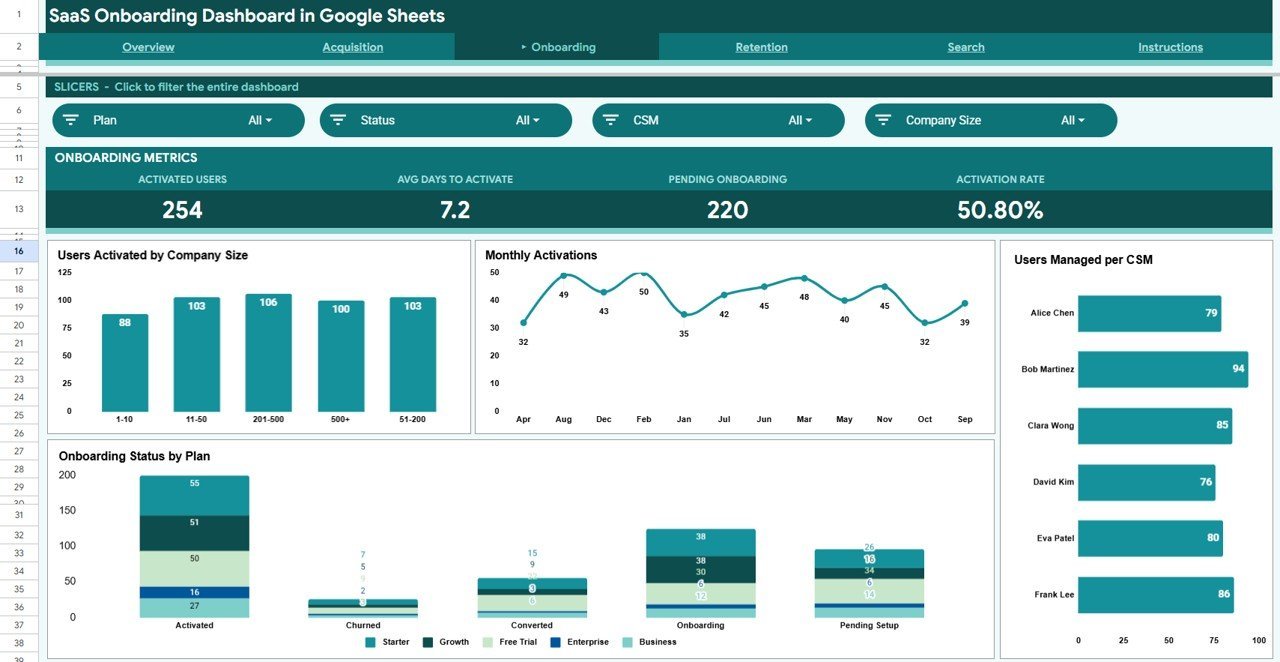
Page 3: Onboarding
The Onboarding page measures how effectively new users reach activation. Charts cover Users Activated by Company Size, Monthly Activations, Users Managed per CSM, and Onboarding Status by Plan — helping customer success teams spot bottlenecks and balance workloads.

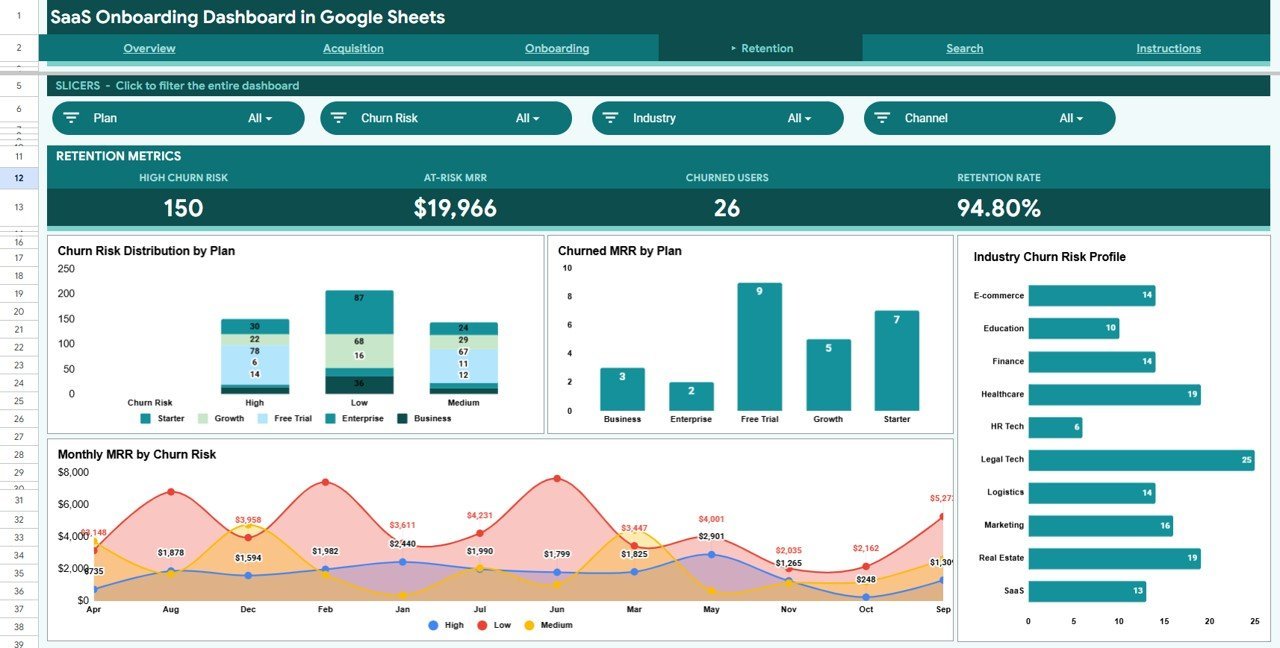
Page 4: Retention
The Retention page surfaces churn risk before revenue walks out the door. Charts show Churn Risk Distribution by Plan, Churned MRR by Plan, Industry Churn Risk Profile, and Monthly MRR by Churn Risk — enabling proactive intervention by CSMs and account managers.

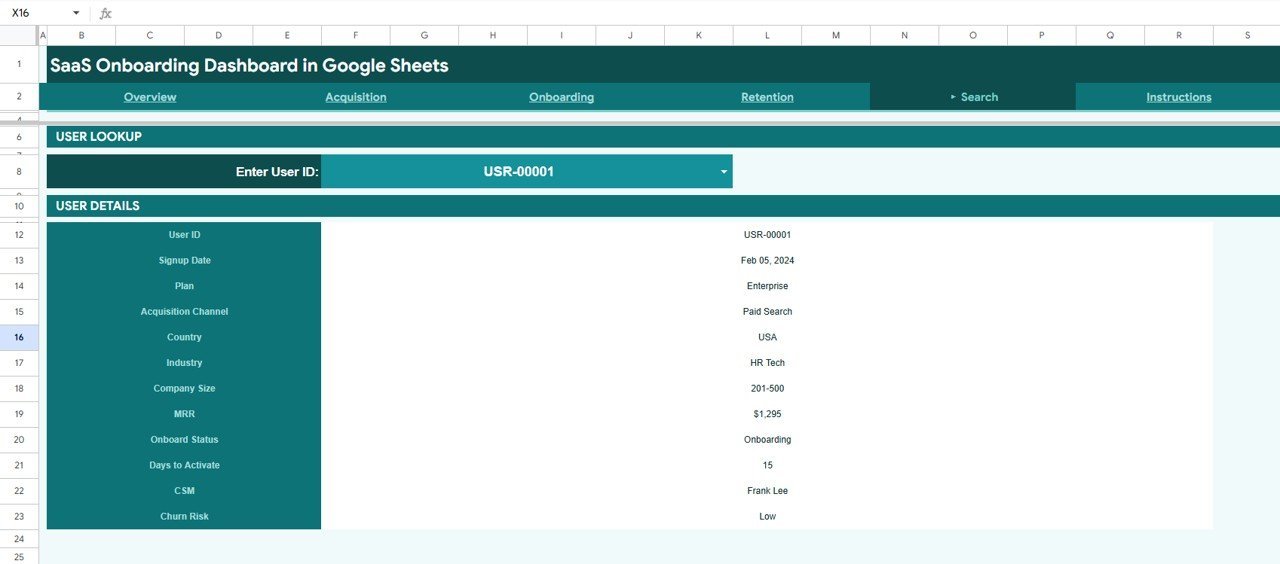
Search Sheet
Enter any User ID to instantly pull that customer’s complete profile — Signup Date, Plan, Acquisition Channel, Country, Industry, Company Size, MRR, Onboard Status, Days to Activate, CSM, and Churn Risk. One lookup replaces hours of manual VLOOKUP work.

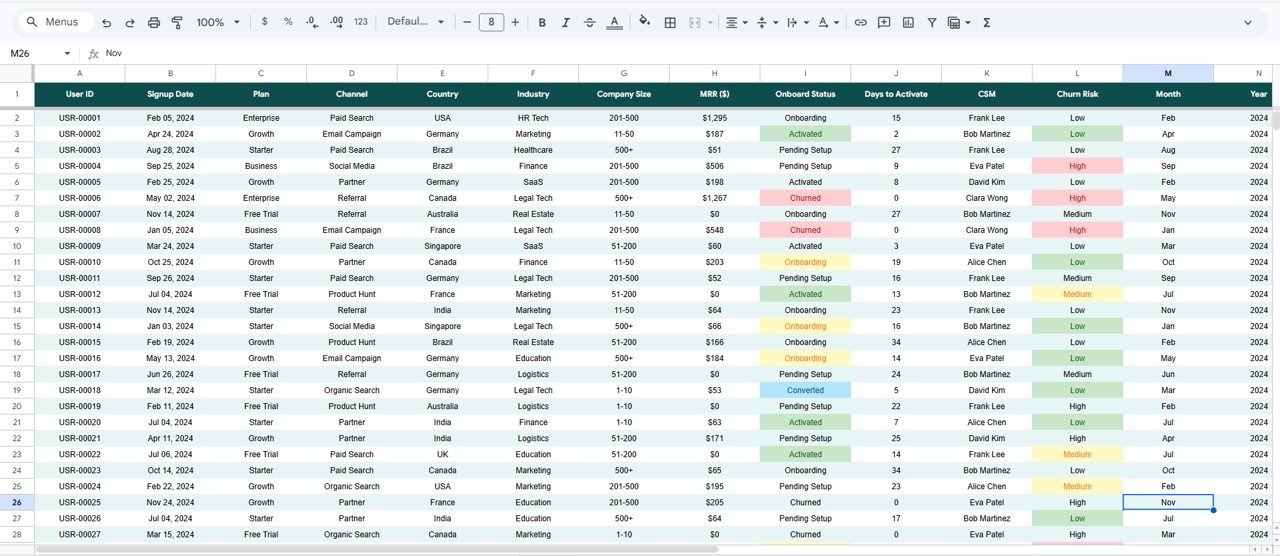
Data Sheet
The Data sheet is the single source of truth for all dashboard calculations. Add your user records in the pre-defined column format and every chart, slicer, and KPI card updates automatically — no formulas to edit, no ranges to adjust.
📊 SaaS Onboarding Dashboard in Google Sheets vs. Microsoft Excel Dashboard vs. Paid SaaS BI — Where This Fits
| Feature | SaaS Onboarding Dashboard in Google Sheets | Microsoft Excel Dashboard | Mixpanel / ChartMogul |
|---|---|---|---|
| Cost | $9.99 one-time | Requires MS 365 license | $149–$599 / month |
| Platform | Google Sheets (browser) | Windows / Mac desktop | Proprietary cloud app |
| Setup time | Under 10 minutes | 10–20 minutes | Hours + developer time |
| Real-time team collaboration | ✅ Native Google Sheets sharing | ❌ Manual file sharing | ✅ Built-in |
| Mobile access | ✅ Google Sheets mobile app | Limited | ✅ Full mobile app |
| Customizable fields | ✅ Full control | ✅ Full control | Limited to platform schema |
| Share with link | ✅ One-click Google link | Requires file upload | ✅ Dashboard share link |
| Year-1 cost (5 users) | $9.99 total | ~$375 (MS 365) | $1,788–$7,188 |
| Onboarding funnel visibility | ✅ Acquisition → Activation → Retention | Custom build required | ✅ Built-in |
For SaaS teams that need full onboarding funnel visibility without paying enterprise BI prices, the SaaS Onboarding Dashboard in Google Sheets sits in the sweet spot.
👥 Who This Template Is For — and Who It’s Not For
✅ This template is built for:
- SaaS founders and COOs tracking MRR, churn, and activation rates for 10–5,000 users
- Customer success managers monitoring CSM workloads, onboarding status, and churn risk by plan
- Growth and marketing teams analyzing acquisition channel ROI and signups by industry or country
- Early-stage SaaS companies that need structured reporting before investing in a dedicated BI platform
❌ This template is NOT for:
- Enterprise teams needing automated real-time CRM sync (this template requires manual or export-based data entry)
- Teams requiring SOC 2 data residency controls or SSO-gated BI access
- Organizations with 50,000+ user records where spreadsheet performance may become a limiting factor
⚙️ How to Use the SaaS Onboarding Dashboard in Google Sheets
- Download the PDF guide from your order — it contains the Google Sheets copy link
- Click the link to make your own editable copy in Google Drive
- Go to the Data sheet and replace the sample records with your own user data, following the same column structure
- Navigate to the Overview, Acquisition, Onboarding, or Retention pages to view your live dashboard
- Use the slicers at the top of each page to filter by plan, channel, industry, country, or any other dimension
- Use the Search sheet to look up individual users by User ID for full profile details
💼 Real-World Use Cases
Marcus leads customer success at a 40-person B2B SaaS startup. He uses the SaaS Onboarding Dashboard in Google Sheets to monitor which CSMs are overloaded, track monthly activation rates by plan, and flag users with high churn risk before renewal — without waiting for a BI engineer to build a report.
Priya runs growth at a seed-stage fintech SaaS. She uses the Acquisition page to compare MRR contribution by channel and pinpoint which industries are signing up most vs. converting to activated users, informing her paid and content budget allocation each quarter.
David is a SaaS consultant working with 5 portfolio companies. He maintains a separate copy of the SaaS Onboarding Dashboard in Google Sheets for each client, sharing the dashboard view link with founders for weekly check-ins — no Tableau license required.
❓ Frequently Asked Questions
What KPIs does the SaaS Onboarding Dashboard in Google Sheets track?
The SaaS Onboarding Dashboard in Google Sheets tracks 12 key metrics including Total MRR, Total Signups, Activated Users, Churn Rate, Signups by Channel, MRR by Plan, Users per CSM, Onboarding Status by Plan, Churn Risk Distribution, Churned MRR by Plan, Days to Activate, and MRR by Country. All metrics update automatically when you update your data.
Does this dashboard work on Mac?
Yes. Since the SaaS Onboarding Dashboard in Google Sheets runs entirely in Google Sheets in a browser, it works on Mac, Windows, Linux, and Chromebook with no software installation required. You only need a free Google account.
How long does setup take?
Setup takes under 10 minutes. Open the PDF guide in your download, click the Google Sheets copy link, and replace the sample data with your own records in the Data sheet. All charts, slicers, and KPI cards update automatically.
How does this compare to ChartMogul or Mixpanel?
ChartMogul and Mixpanel charge $149–$599 per month and require API integrations or event tracking setup. The SaaS Onboarding Dashboard in Google Sheets costs $9.99 once, requires no integrations, and can be populated from any CRM or database export. It is ideal for teams that don’t yet need real-time automated pipelines.
Can I share this dashboard with my team?
Yes. Because the SaaS Onboarding Dashboard in Google Sheets lives in Google Drive, you can share it with your entire team using Google’s standard sharing link. Multiple team members can view or edit simultaneously, just like any Google Sheet.
Can I customize the column fields or add new metrics?
Yes. The Data sheet uses a standard tabular format. You can add new columns, create additional calculated fields, or extend the pivot tables underlying the charts. Basic Google Sheets knowledge is sufficient for most customizations.
👤 About the Author
Built by PK — Microsoft Certified Professional with 15+ years of Excel, Google Sheets, and Power BI experience. Founder of NextGenTemplates, reaching 300K+ subscribers across YouTube channels
(@PK-AnExcelExpert,
@NextGenTemplates,
@NeoTechNavigators).
Every template is hand-built and tested before release.
🔗 Explore Related Templates
🔹 SaaS Financial Performance Dashboard in Google Sheets — Revenue, expenses, MRR growth, and burn rate tracking for SaaS finance teams
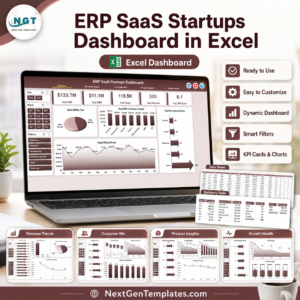
🔹 ERP SaaS Startups Dashboard in Excel — Multi-module SaaS operations dashboard for Excel users
🔹 ERP SaaS Startups Dashboard in Power BI — Advanced SaaS analytics with Power BI visuals and DAX measures
Also available as: More Google Sheets Dashboards
📖 Click here to read the Detailed Blog Post<
Watch the step-by-step video Demo:
/h3>
🎥 Visit our YouTube channel for step-by-step video tutorials
👉 YouTube.com/@NextGenTemplates


Reviews
There are no reviews yet.