Healthcare organizations generate enormous volumes of diagnostic data every day. Radiology and imaging centers manage scans, technicians, referrals, departments, and financial performance simultaneously. However, many facilities still depend on scattered spreadsheets and manual reports. As a result, leaders struggle to monitor operational efficiency, revenue performance, and productivity in one centralized system.
That’s where the Radiology and Imaging Dashboard in Power BI becomes a powerful solution.
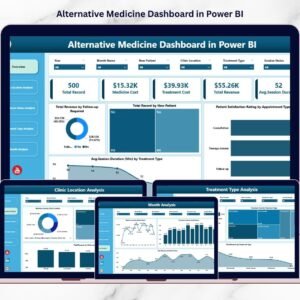
This ready-to-use Power BI dashboard transforms raw radiology data into interactive visual insights. Instead of reviewing multiple reports, healthcare managers can track performance, analyze trends, and make faster data-driven decisions from one centralized analytics platform.
Whether you operate a diagnostic center, hospital radiology department, or imaging network, this dashboard delivers complete operational and financial visibility.
🔑 Key Feature of Radiology and Imaging Dashboard in Power BI
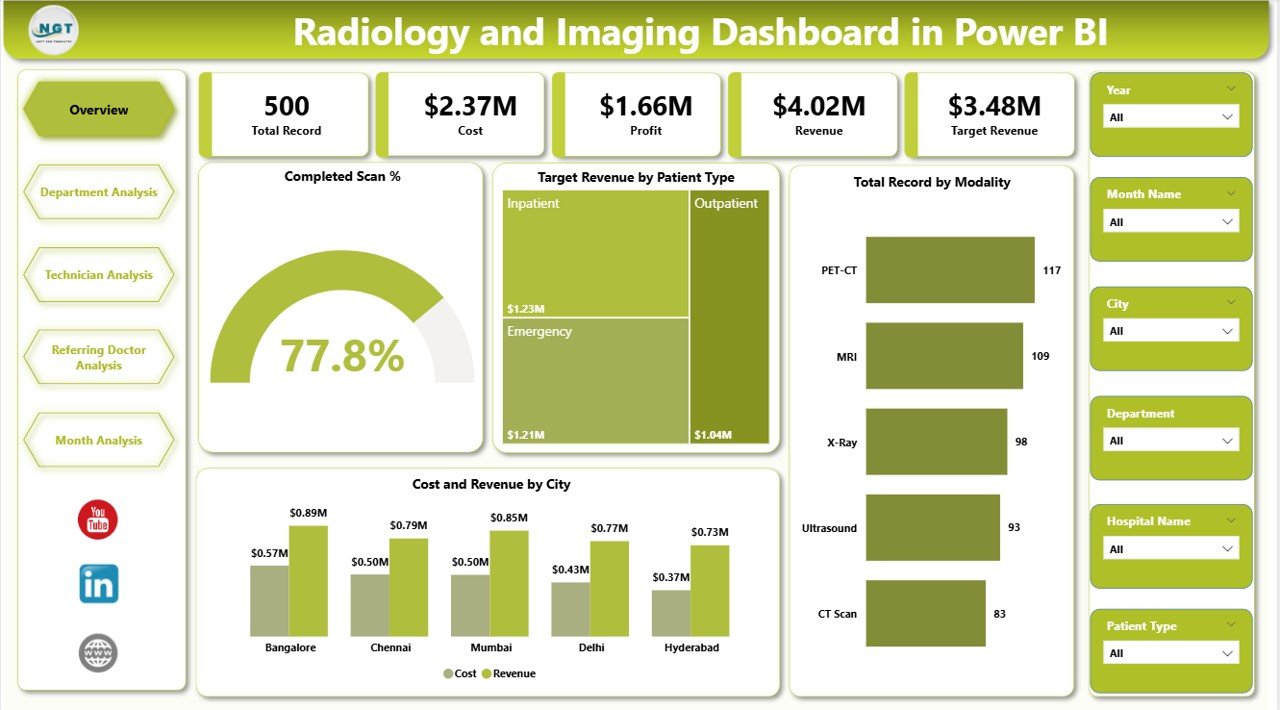
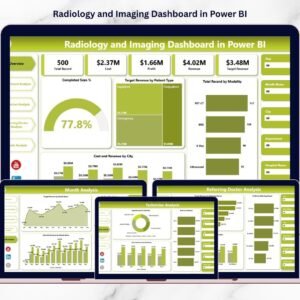
📊 Executive Overview Dashboard
Get an instant snapshot of scan performance, revenue, costs, and operational efficiency.
🎯 Interactive KPI Monitoring
Track Completed Scan %, Target Revenue, profitability, and performance trends in real time.
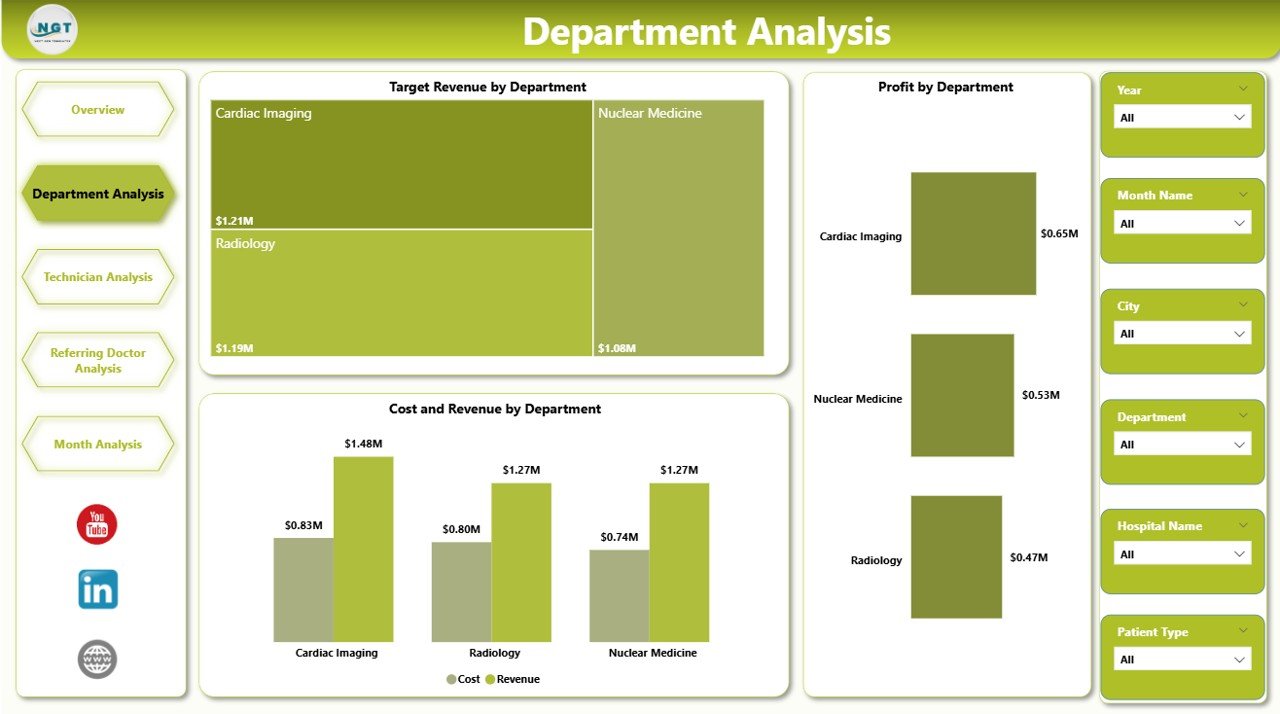
🏥 Department Performance Analysis
Compare MRI, CT, X-Ray, Ultrasound, and other modalities to identify high-performing services.
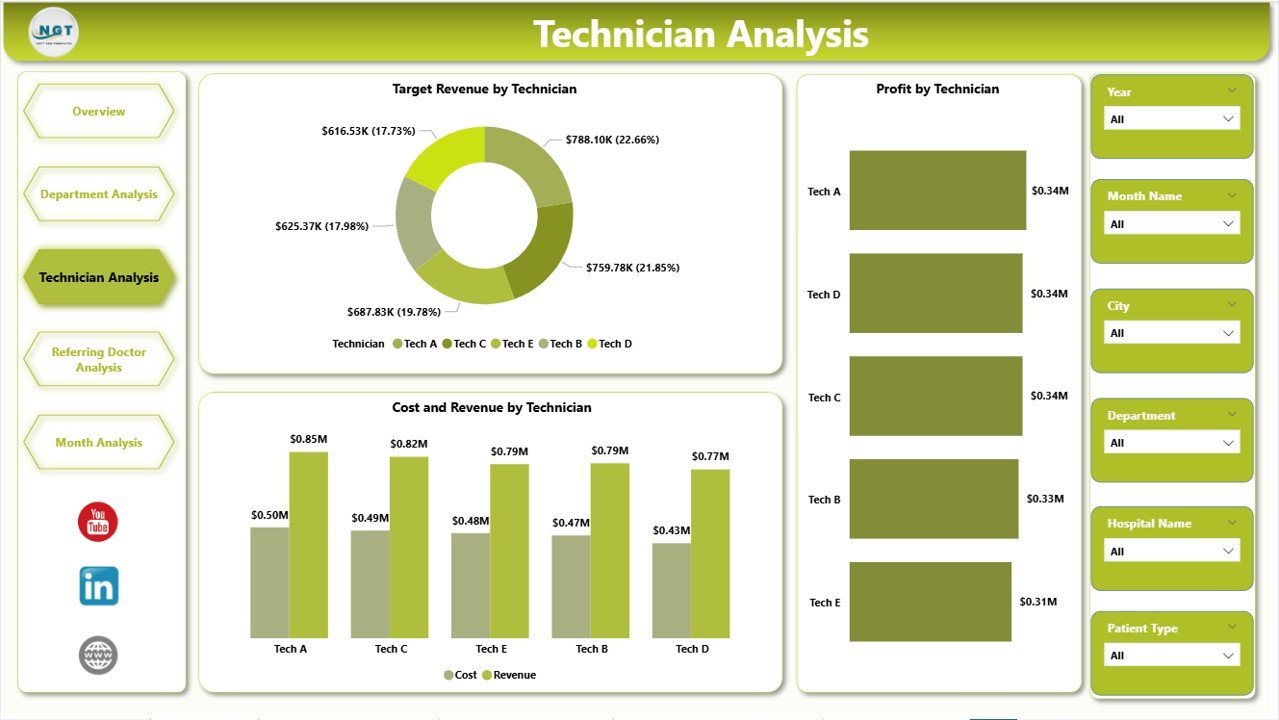
👨⚕️ Technician Productivity Insights
Measure technician contribution, workload balance, and operational efficiency.
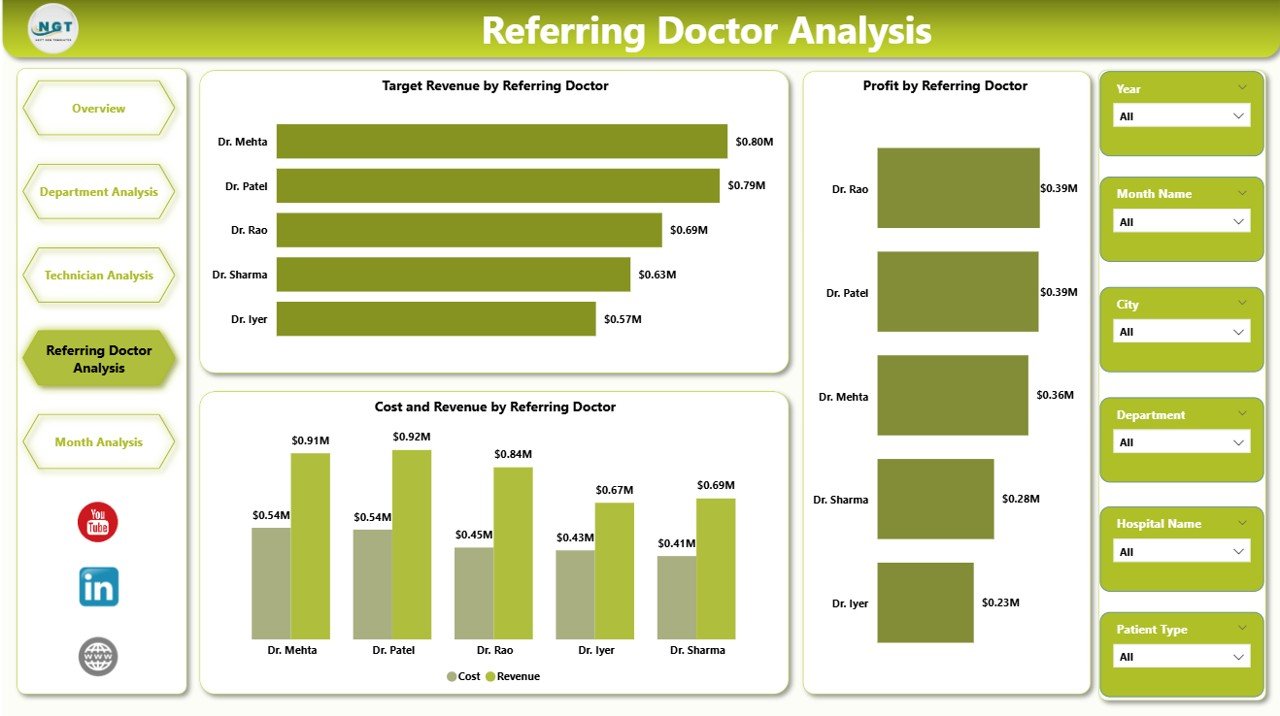
🤝 Referring Doctor Analytics
Identify top referral sources and strengthen partnership strategies.
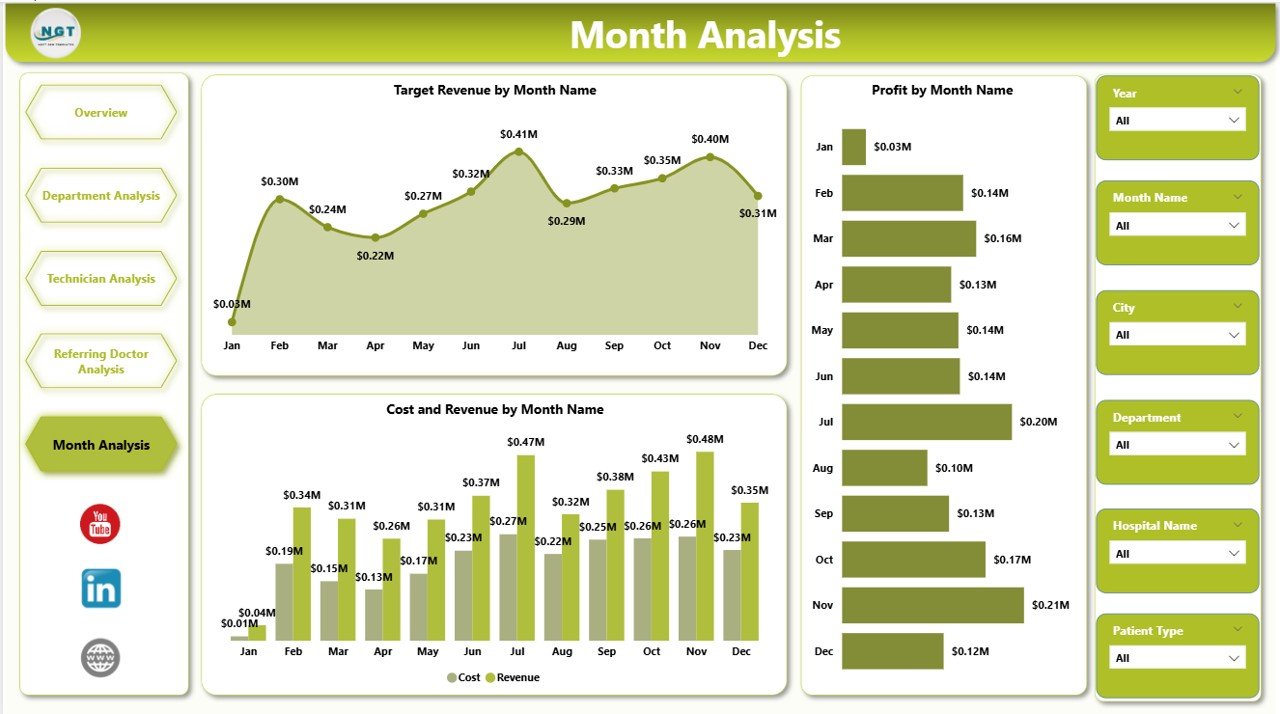
📅 Monthly Trend Analysis
Monitor revenue growth, seasonal demand, and operational patterns over time.
⚡ Dynamic Slicers & Filters
Analyze performance instantly by department, technician, city, modality, or time period.
📈 Real-Time Power BI Visualizations
Interactive charts and KPI cards update automatically with data refresh.
🧩 Scalable & Customizable Model
Adapt KPIs and visuals based on hospital or imaging center requirements.
📦 What’s Inside the Radiology and Imaging Dashboard in Power BI
This dashboard includes five powerful analytical pages:
✔️ Overview Page – Executive performance snapshot
✔️ Department Analysis – Modality and department comparison
✔️ Technician Analysis – Staff productivity insights
✔️ Referring Doctor Analysis – Referral performance tracking
✔️ Month Analysis – Trend and forecasting analysis
Additional components include:
-
Interactive slicers
-
KPI summary cards
-
Dynamic visual charts
-
Drill-down analytics
-
Automated calculations using Power BI measures
Simply connect your Excel or database source and start analyzing instantly.
🛠️ How to Use the Radiology and Imaging Dashboard in Power BI
Getting started is simple:
Step 1: Import radiology data (Excel or database)
Step 2: Refresh the Power BI dataset
Step 3: Use slicers to filter departments or time periods
Step 4: Review KPI cards and performance charts
Step 5: Conduct weekly or monthly performance reviews
Within minutes, your organization gains enterprise-level healthcare analytics.
🎯 Who Can Benefit from This Radiology and Imaging Dashboard in Power BI
This dashboard is ideal for:
✅ Radiology Center Owners
✅ Hospital Administrators
✅ Diagnostic Imaging Chains
✅ Healthcare Operations Managers
✅ Financial Controllers
✅ Department Heads
✅ Healthcare Data Analysts
If your organization wants centralized performance monitoring and smarter healthcare decisions, this dashboard is built for you.
Why This Dashboard Improves Radiology Operations
Instead of manual reporting, you gain:
✔️ Centralized operational visibility
✔️ Faster decision-making
✔️ Improved technician accountability
✔️ Better revenue tracking
✔️ Strong referral management
✔️ Accurate performance comparison
✔️ Automated reporting workflows
As a result, imaging centers improve efficiency, profitability, and patient service quality.
### Click hare to read the Detailed blog post
📺 Visit our YouTube channel to learn step-by-step video tutorials
👉 Youtube.com/@PKAnExcelExpert