


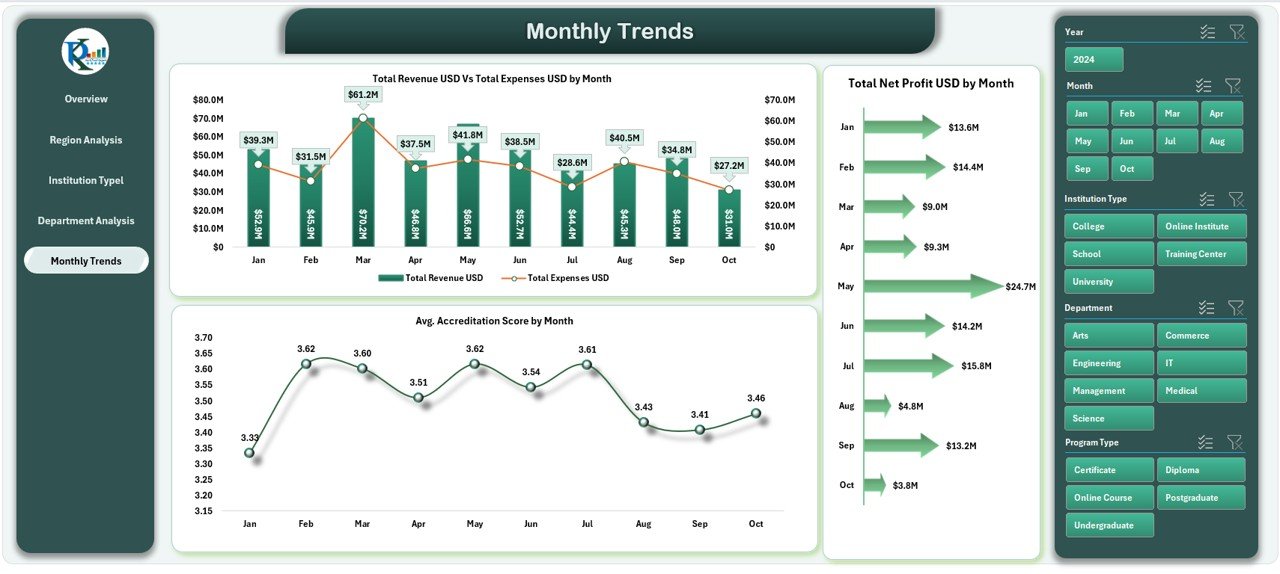

In today’s data-driven education landscape, success depends on real-time insights. The Education Services Dashboard in Excel is a ready-to-use, interactive reporting solution designed to help universities, colleges, and training institutes track academic and financial performance with ease. 🎓💡
This dynamic dashboard consolidates critical KPIs — such as student enrollment, graduation rate, revenue, expenses, and accreditation scores — into one visual platform. Built entirely in Microsoft Excel, it offers a professional, cost-effective, and user-friendly way to transform raw data into actionable insights.
🎯 Key Features of Education Services Dashboard in Excel
✨ Comprehensive Overview Page: Get a snapshot of institutional performance with cards displaying Total Students, Average Accreditation Score, Total Revenue, Total Expenses, and Net Profit (USD).
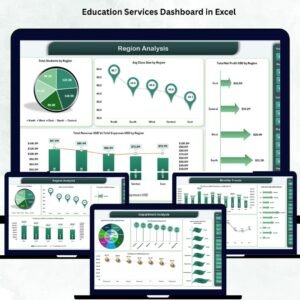
📊 Interactive Visuals: Analyze trends using dynamic charts for revenue vs. expenses, student satisfaction, graduation rates, and regional distribution.
🎛️ Smart Navigation Panel: Easily switch between analytical views such as Overview, Region, Institution Type, Department, and Monthly Trends.
📈 Automated KPI Updates: Data-driven formulas and Excel charts update automatically as new information is entered.
🧮 Data Accuracy and Transparency: Promote accountability and efficiency by centralizing academic and financial metrics in one file.
💰 Cost-Effective and Accessible: No need for complex BI tools—this Excel-based solution delivers enterprise-level analytics at a fraction of the cost.

📂 What’s Inside the Education Services Dashboard in Excel
Inside this digital product, you’ll find everything you need to manage and visualize educational data effectively:
Overview Sheet Tab: Institutional performance cards and visuals for total students, revenue, and satisfaction levels.
Region Analysis Sheet: Evaluate academic and financial outcomes by region.
Institution Type Analysis Sheet: Compare performance across universities, colleges, and training centers.
Department Analysis Sheet: Review placement rates, student distribution, and department-level expenses.
Monthly Trends Sheet: Monitor growth trends, monthly revenue, and accreditation scores over time.
Data Sheet Tab: The foundation of your dashboard, containing all raw data and formulas for automated reporting.
Each sheet is pre-designed with charts, slicers, and color-coded visuals that make it easy to understand institutional performance at a glance. 📘📊
⚙️ How to Use the Education Services Dashboard in Excel
1️⃣ Input Your Data: Enter your student, revenue, and expense data in the Data Sheet.
2️⃣ Select Filters: Use dropdowns and slicers to filter by region, program, or institution type.
3️⃣ View Instant Results: Watch KPIs and charts update automatically.
4️⃣ Analyze Performance: Identify top-performing regions, departments, and programs.
5️⃣ Share Reports: Export visuals as PDF or present them directly in Excel during reviews.
No coding or advanced Excel skills are required — just plug in your data and start analyzing instantly! ⚡
👩🏫 Who Can Benefit from This Education Services Dashboard
🎓 University Administrators: Track institutional KPIs and ensure academic excellence.
🏢 Finance & Operations Teams: Monitor revenue, expenses, and profitability in real time.
👩💼 Department Heads: Assess departmental performance, placement rates, and student success.
💻 Education Consultants: Present insights and analytics to clients using professional visuals.
📚 Training Institutes & EdTech Platforms: Manage enrollment, satisfaction, and retention metrics easily.
This dashboard is a perfect blend of functionality, visualization, and simplicity — making it an essential tool for any educational organization aiming for excellence. 🌟
Click here to read the Detailed Blog Post
Watch the step-by-step video tutorial:
Visit our YouTube channel to learn step-by-step video tutorials.
Compatibility and Requirements
- Works in Microsoft Excel desktop (Excel 2016 or later, or Microsoft 365).
- The Overview sheet uses slicers and dropdowns to filter by region, program or institution type. Microsoft explains them in Use slicers to filter data.
Frequently Asked Questions
Which sheets are included?
Six sheet tabs: Overview, Region Analysis, Institution Type Analysis, Department Analysis, Monthly Trends and Data.
Which KPIs does the dashboard show?
The Overview page has cards for Total Students, Average Accreditation Score, Total Revenue, Total Expenses and Net Profit (USD). Charts cover revenue vs. expenses, student satisfaction, graduation rates and regional distribution.
How do I update the dashboard?
Enter your student, revenue and expense data in the Data sheet. The formulas and charts update automatically.
Can I compare regions, institution types and departments?
Yes. Each has its own analysis sheet. Use the dropdowns and slicers to filter by region, program or institution type.
Is there a Power BI or Google Sheets version?
Yes. See the Education Dashboard in Power BI and the Education Dashboard in Google Sheets.
Related Education Templates
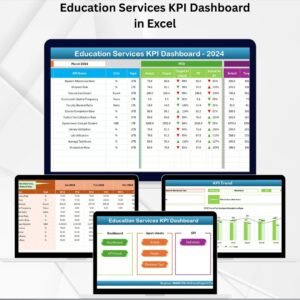
- Education Services KPI Dashboard in Excel: a KPI-focused view for education services
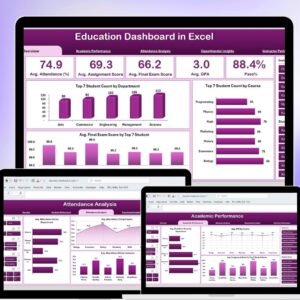
- Education Dashboard in Excel: a general education dashboard in Excel
- Education Dashboard in Power BI: the Power BI edition
- Education Dashboard in Google Sheets: the same topic in Google Sheets
- Education and Learning Quality Assurance KPI Dashboard in Excel: track quality assurance metrics
Browse all Excel dashboards or Excel education templates.







Reviews
There are no reviews yet.