


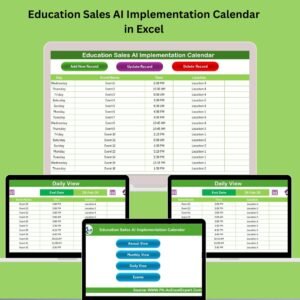
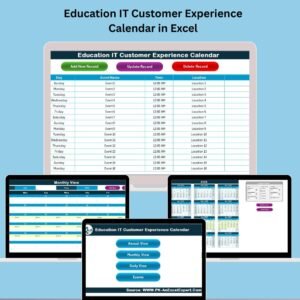
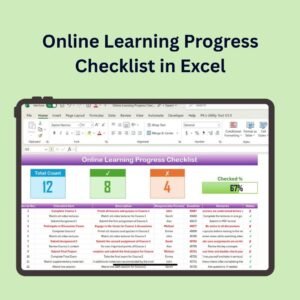
In today’s data-driven education system, institutions must track performance metrics to drive improvement, boost accountability, and ensure quality learning outcomes. The Education and Learning Quality Assurance KPI Dashboard in Excel is a powerful, no-code solution designed to help academic institutions monitor, evaluate, and act on key educational KPIs—all within Excel.
Perfect for school administrators, QA officers, and academic decision-makers, this dashboard makes educational performance management both simple and insightful.
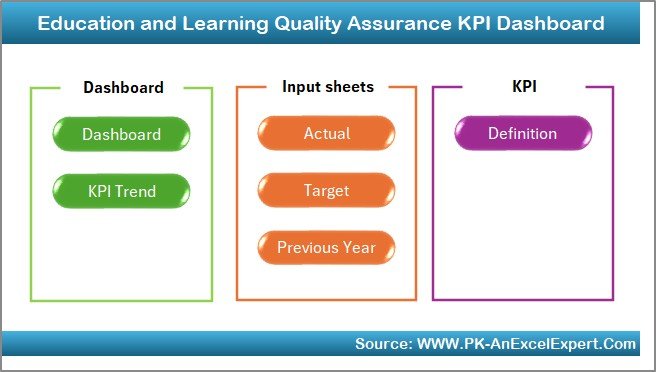
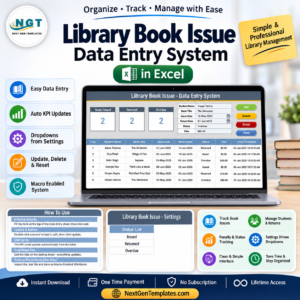
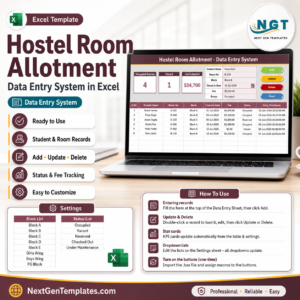
📚 Key Features of the KPI Dashboard
🏠 Home Sheet – Central Navigation
-
Easy access to all key sheets
-
6 navigation buttons: Dashboard, Trend Analysis, Inputs, Targets, Past Year, Definitions
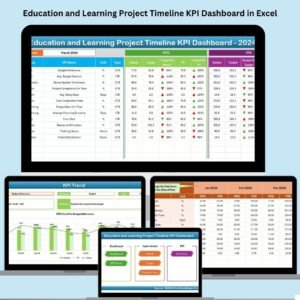
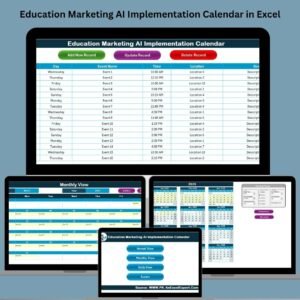
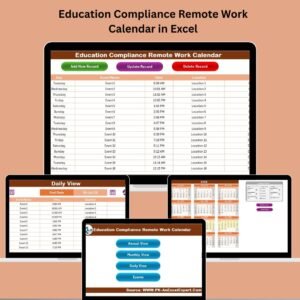
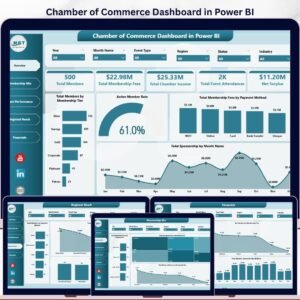
📊 Dashboard Sheet – Visual KPI Performance Overview
-
Select the Month from a dropdown to auto-update all metrics
-
View MTD (Month-to-Date) and YTD (Year-to-Date):
-
Actual vs Target
-
Actual vs Previous Year
-
-
Includes up/down arrows for quick visual analysis using conditional formatting
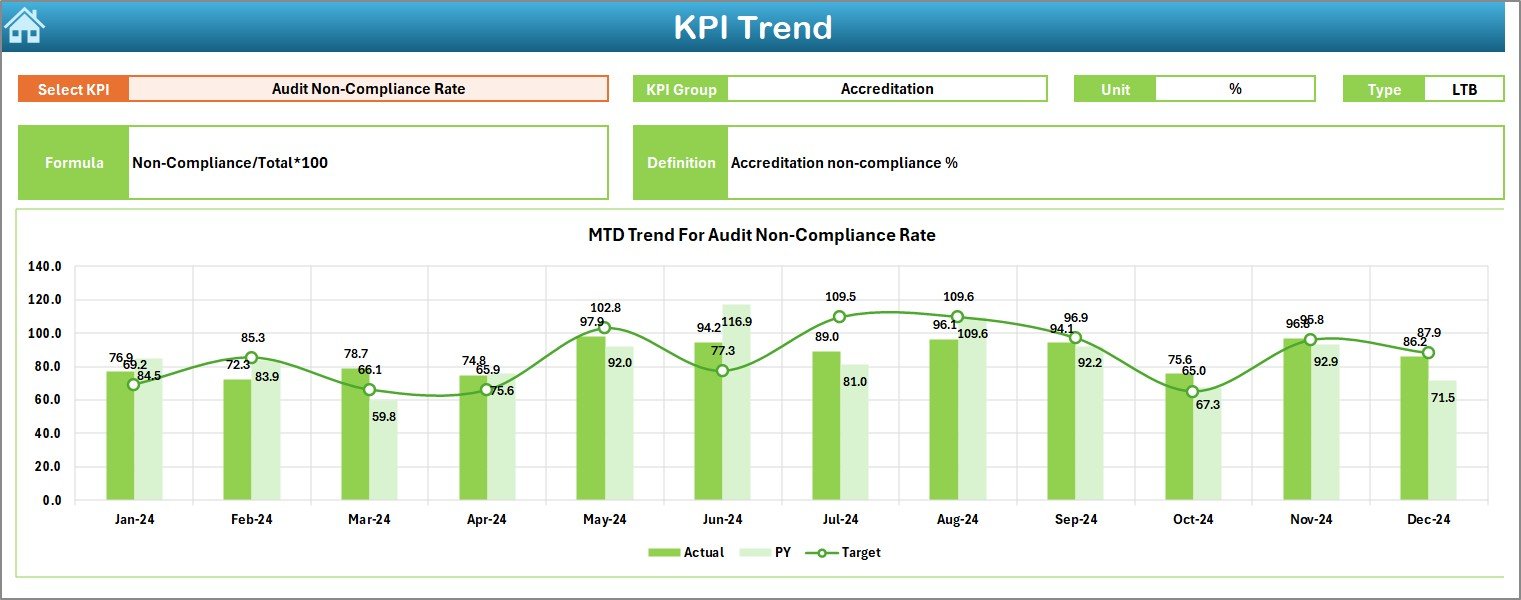
📈 KPI Trend Sheet – Analyze KPIs Over Time
-
Select any KPI from a dropdown
-
View its:
-
Group, Unit, Type (UTB or LTB)
-
Formula and Definition
-
-
Compare MTD and YTD trends with charts
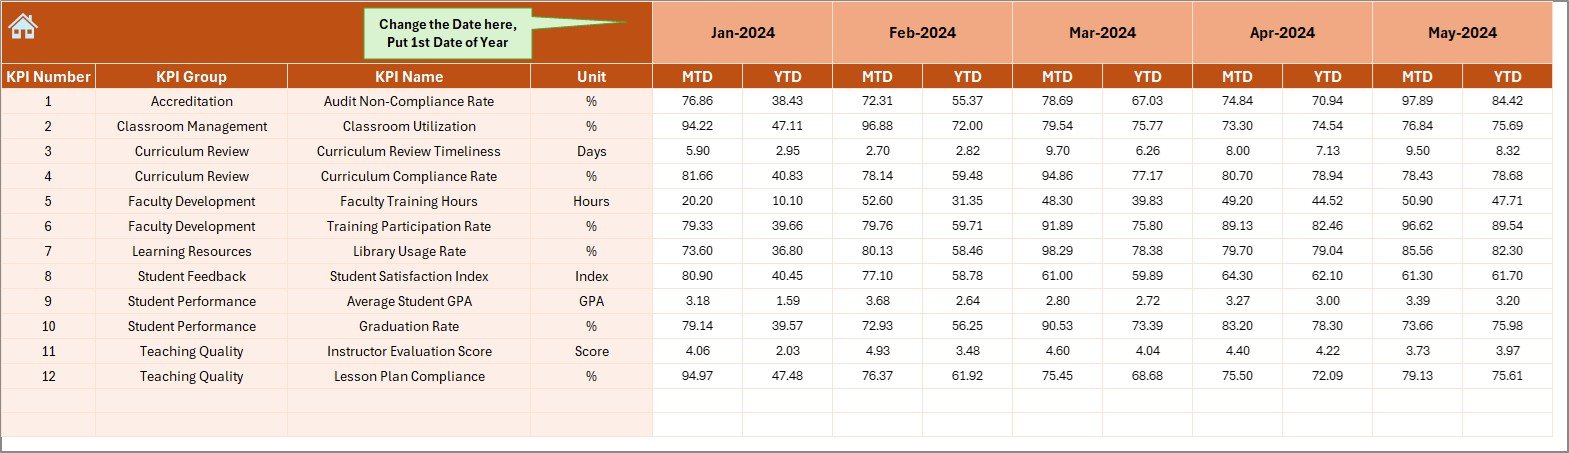
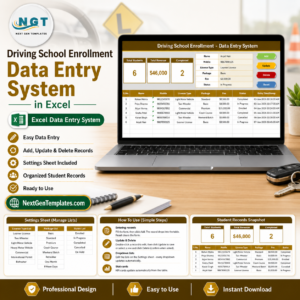
📝 Actual Numbers Input Sheet – Live Data Entry
-
Enter actual values monthly
-
Select the active month and update all KPIs instantly
-
Structured format ensures consistency and easy tracking
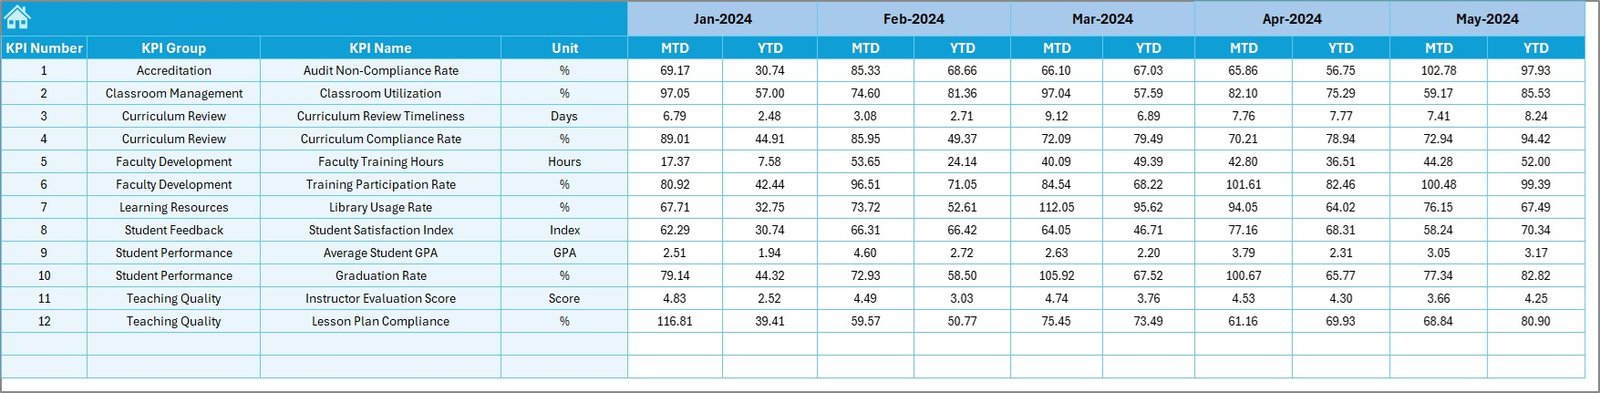
🎯 Target Sheet – Define Success Metrics
-
Enter monthly MTD and YTD target values
-
Adjust targets as per updated academic plans
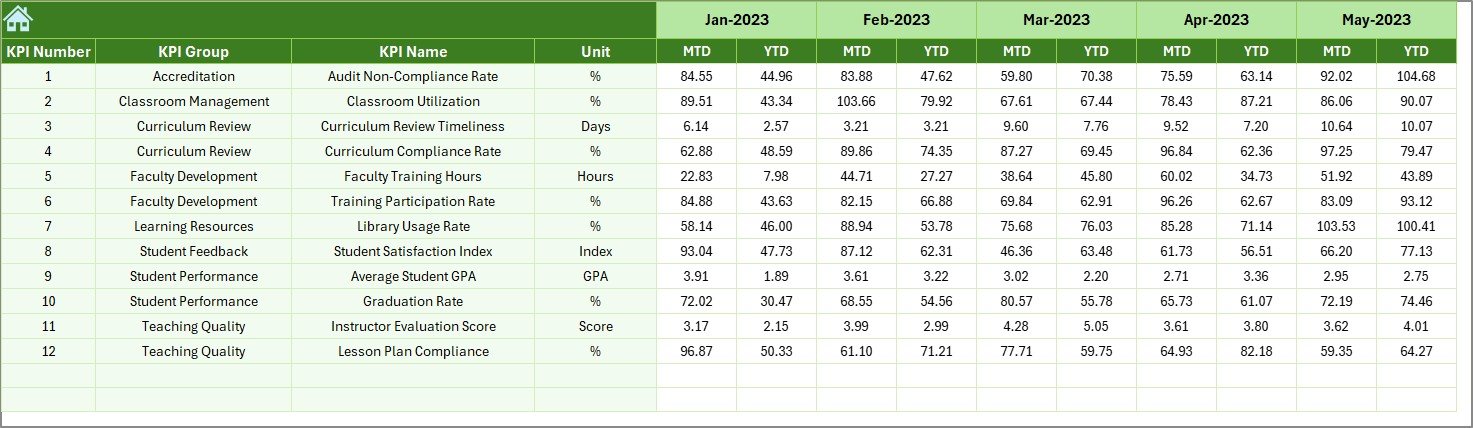
🗓️ Previous Year Number Sheet – YOY Comparisons
-
Input past year’s data for each KPI
-
Analyze year-over-year performance shifts and improvements
📘 KPI Definition Sheet – Unified KPI Reference
-
Includes:
-
KPI Group, Name, Unit
-
Formula, Definition, Type (UTB/LTB)
-
-
Acts as a dictionary to avoid confusion and promote consistency
📦 What’s Included in the Dashboard Package?
-
Excel (.xlsx) file with pre-formatted KPI tracking
-
KPI Dashboard, Trend Analysis & Data Input Sheets
-
Targets, Previous Year, and KPI Definitions Sheets
-
Dropdowns for KPI and Month selection
-
Pivot tables and charts for dynamic visuals
No macros or external plugins needed. Just open and start tracking!
🚀 Key Benefits
✅ Real-Time Monitoring – Track academic performance across months effortlessly
📊 Visual Insights – Clear charts and conditional arrows for instant decision-making
💡 Data-Driven Culture – Aligns teams toward evidence-based quality improvement
🧠 Fully Customizable – Add KPIs, localize terms, or create department-wise views
💰 Cost-Effective – Avoid expensive software; use Excel you already own
🎓 Who Should Use This Dashboard?
-
School Principals and Heads of Departments
-
College Deans and QA Managers
-
Corporate L&D Professionals
-
Education Boards and Compliance Officers
-
Training Institutes and E-Learning Coordinators
If you’re responsible for educational quality, this is your must-have tool.
🧠 Best Practices
✔️ Update the Actual and Target sheets monthly
✔️ Assign ownership to specific departments or leaders for each KPI
✔️ Keep the KPI definitions consistent across all sheets
✔️ Use conditional formatting to highlight performance gaps
✔️ Print or export the dashboard monthly for reporting
🛠️ Technical Requirements
-
Microsoft Excel 2016 or later
-
Works on Windows & Mac
-
Compatible with Excel Mobile and Teams (view/edit mode)
-
Fully formula-based (No VBA/macros required)
-
Easy printing and export to PDF
📥 What You Can Customize
-
Add or remove KPIs based on your institution’s focus
-
Include more sheets for department-wise breakdowns
-
Localize dropdowns for region or language-specific use
The modular structure allows you to scale the template with ease.
🔗 Blog Post: (Insert your blog post URL here)
📹 Watch the Full Tutorial on YouTube: youtube.com/@PKAnExcelExpert


Reviews
There are no reviews yet.