

Managing freight costs, carrier performance, and shipping timelines manually can be a logistical nightmare. The Shipping Dashboard in Excel is your all-in-one analytical solution — built to turn complex shipping data into interactive visuals and performance insights.
Designed for logistics teams, operations managers, and business owners, this ready-to-use Excel dashboard helps you track costs, monitor transit efficiency, and analyze profitability across regions, departments, and shipping modes — all from one central file.
With dynamic slicers, page navigation, and automated charts, it transforms ordinary data into actionable insights that drive smarter decisions and improve your bottom line.
⚙️ Key Features of the Shipping Dashboard in Excel
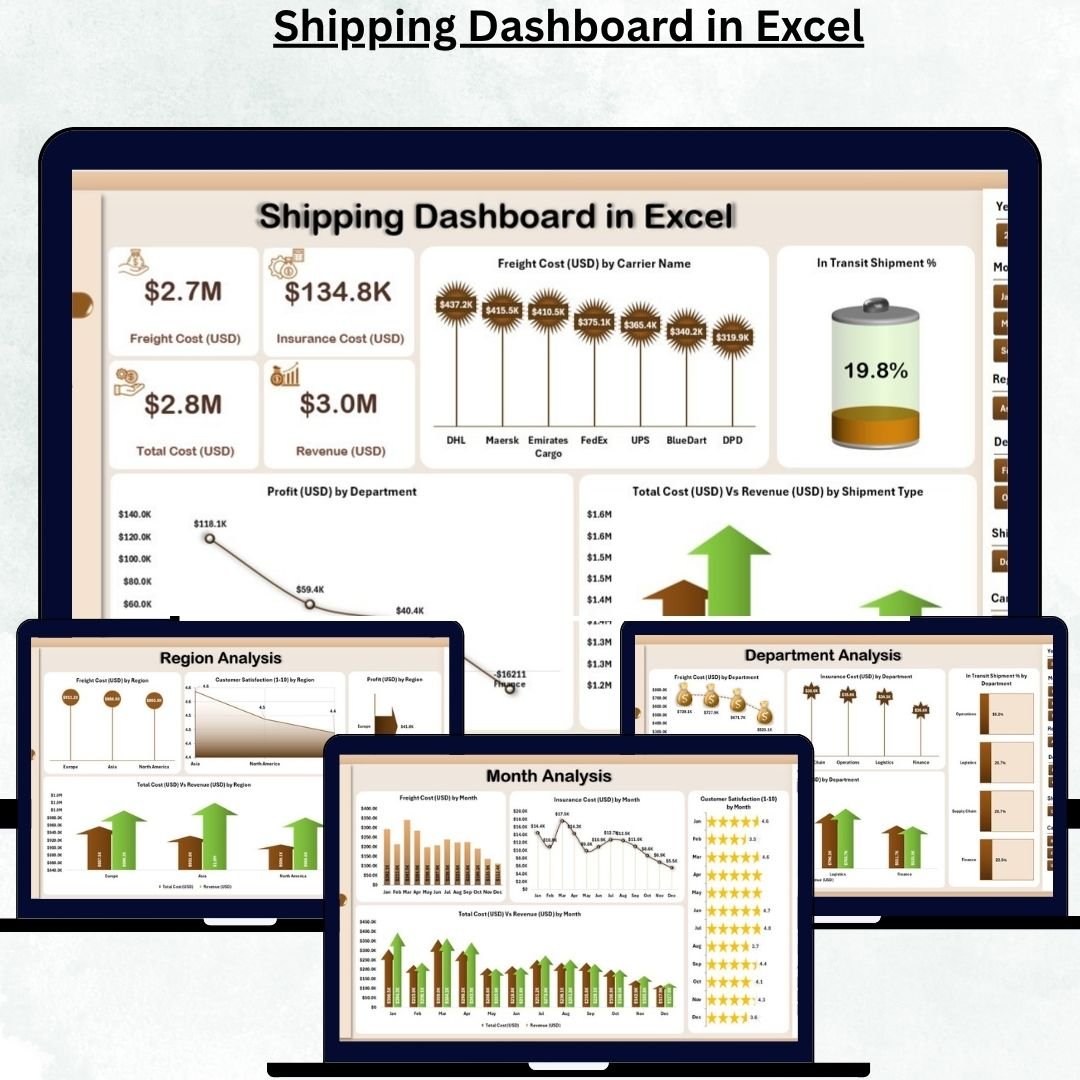
🏠 1️⃣ Overview Page – Central Control Panel
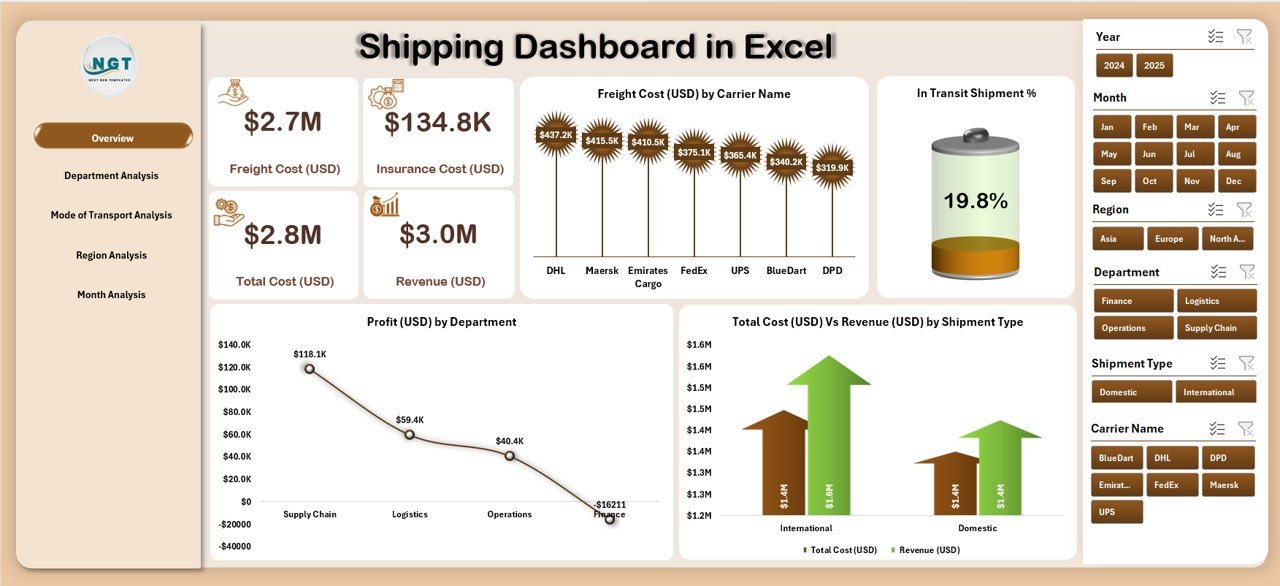
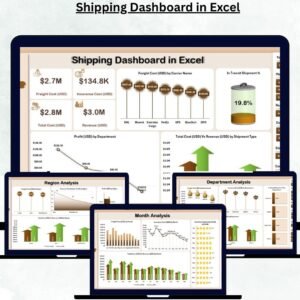
Get an at-a-glance summary of your shipping KPIs.
🎚️ Right-Side Slicer to filter data by Department, Region, or Shipping Mode.
💳 Five KPI Cards: Freight Cost (USD), Total Shipments, Profit (USD), Shipment in Transit %, and Total Cost vs Revenue.
📊 Four Interactive Charts:
Freight Cost (USD) by Carrier Name
In Transit Shipment %
Profit (USD) by Department
Total Cost (USD) vs Revenue (USD) by Shipment Type
Perfect for high-level management reviews and monthly business meetings.
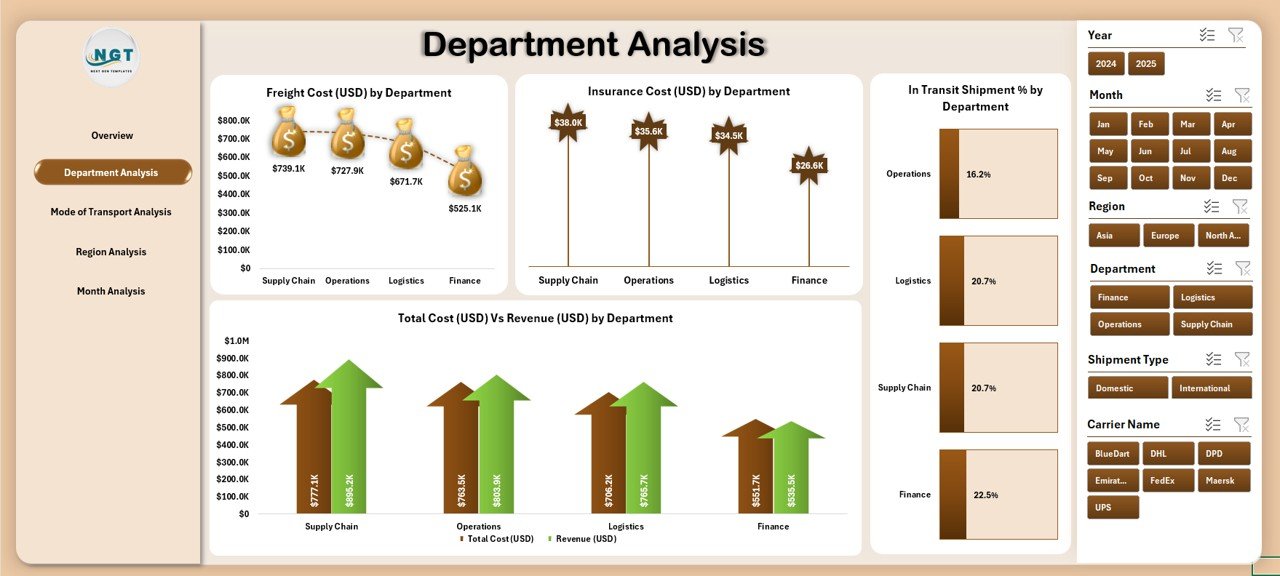
🏢 2️⃣ Department Analysis – Measure Cost & Efficiency
Drill down into departmental performance to control costs and maximize profit.
📈 Freight Cost (USD) by Department
💰 Insurance Cost (USD) by Department
🚚 In Transit Shipment % by Department
💹 Total Cost (USD) vs Revenue (USD) by Department
💡 Helps finance and operations teams pinpoint high-cost departments and improve efficiency.
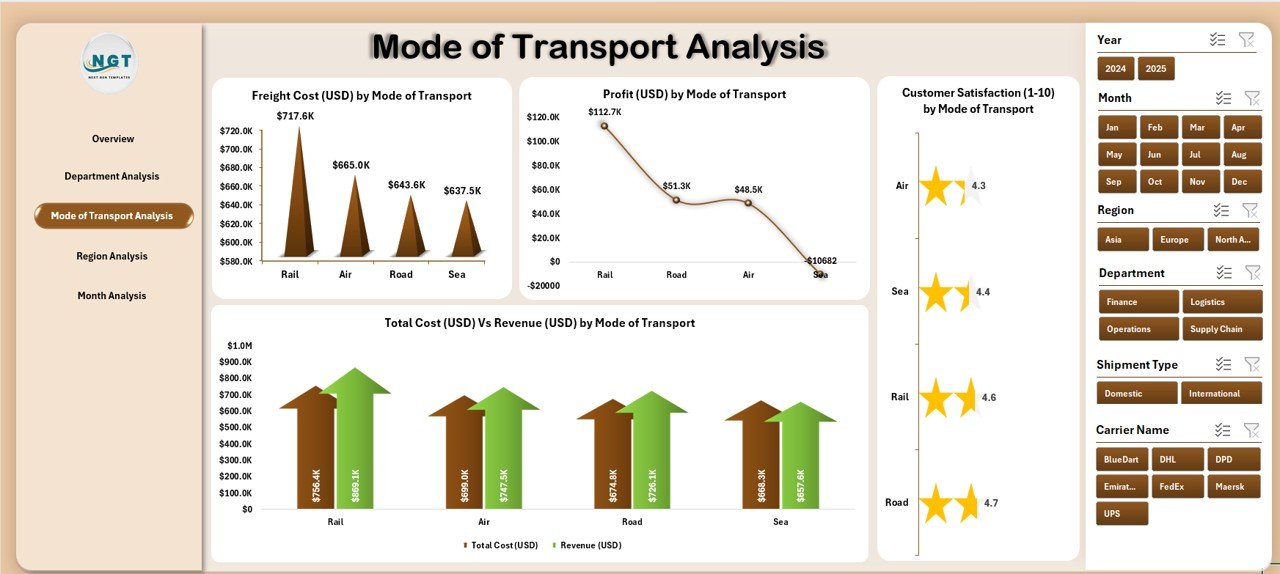
✈️ 3️⃣ Mode of Transport Analysis – Find the Most Cost-Effective Route
Compare Air, Sea, Road, and Rail shipments to determine the best mix of cost and performance.
📦 Freight Cost (USD) by Mode of Transport
💵 Profit (USD) by Mode of Transport
😊 Customer Satisfaction (1–10) by Mode of Transport
⚖️ Total Cost (USD) vs Revenue (USD) by Mode of Transport
🚀 Identify which mode offers the best cost-to-speed balance for your business.
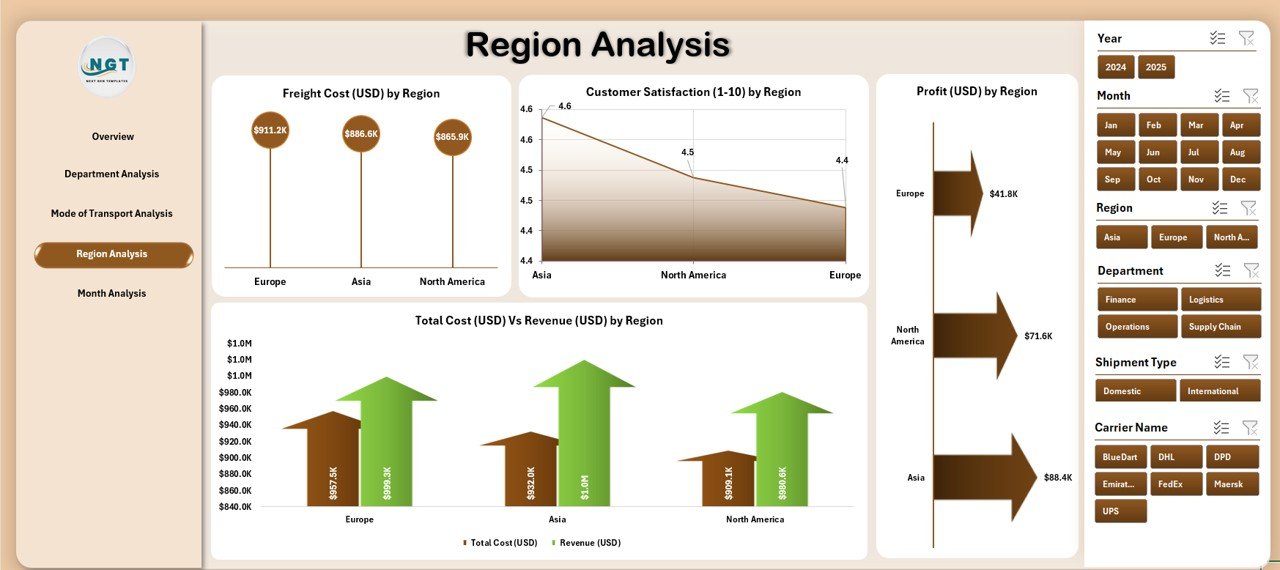
🌍 4️⃣ Region Analysis – Monitor Global Performance
Analyze how different regions contribute to cost, profit, and satisfaction.
Freight Cost (USD) by Region
Profit (USD) by Region
Customer Satisfaction (1–10) by Region
Total Cost (USD) vs Revenue (USD) by Region
📊 Optimize your shipping routes and focus resources where performance is highest.
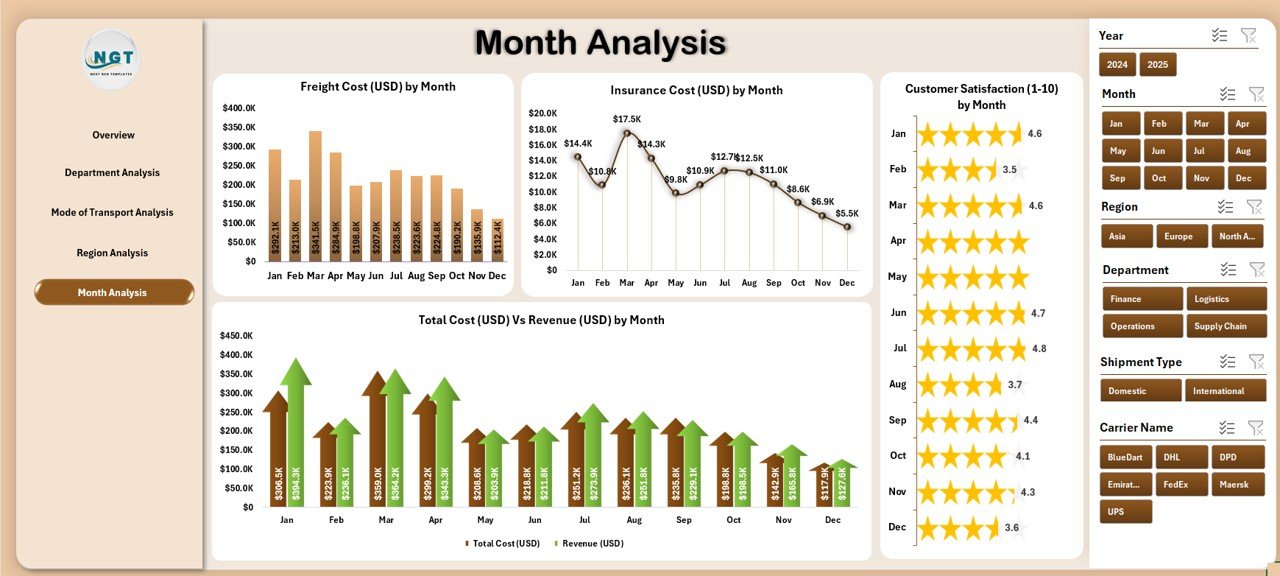
📅 5️⃣ Month Analysis – Understand Trends and Seasonality
Track monthly shipping metrics to plan budgets and logistics strategies.
Freight Cost (USD) by Month
Insurance Cost (USD) by Month
Customer Satisfaction (1–10) by Month
Total Cost (USD) vs Revenue (USD) by Month
📆 Spot seasonal cost spikes, demand peaks, and satisfaction patterns.
📦 What’s Inside the Shipping Dashboard in Excel
📊 Interactive KPI Dashboard – 5 analytical pages + 1 data sheet.
🧭 Page Navigator – Move between pages with one click.
🎚️ Dynamic Slicers – Filter by department, region, or mode.
🧾 Auto-Refreshing Charts – Update instantly after adding data.
📈 Clean Data Integration – Works seamlessly with your Excel files.
🧮 No Macros Required – 100% formula-based design.
🧭 How to Use the Shipping Dashboard in Excel
1️⃣ Enter shipment data (carrier, region, cost, satisfaction score) in the Data Sheet.
2️⃣ Click Data → Refresh All to update all visuals.
3️⃣ Navigate between pages using the left-side Page Navigator.
4️⃣ Use slicers to analyze specific regions, modes, or departments.
5️⃣ Review KPIs and charts to identify trends and improvement areas.
✨ Within minutes, your data becomes a professional-grade logistics report ready for presentation.
👥 Who Can Benefit from This Dashboard
🚛 Logistics & Supply Chain Managers – Track performance across carriers.
💼 Finance Teams – Analyze freight, insurance, and profitability.
🏭 Manufacturing Units – Monitor shipping costs and regional trends.
🛒 Retailers & E-Commerce Firms – Ensure efficient and on-time delivery.
🧭 Operations Leaders – Make data-backed logistics decisions.
🔗 Click here to read the Detailed Blog Post
📺 Visit our YouTube Channel for Step-by-Step Tutorials
👉 YouTube.com/@PKAnExcelExpert






















Reviews
There are no reviews yet.