

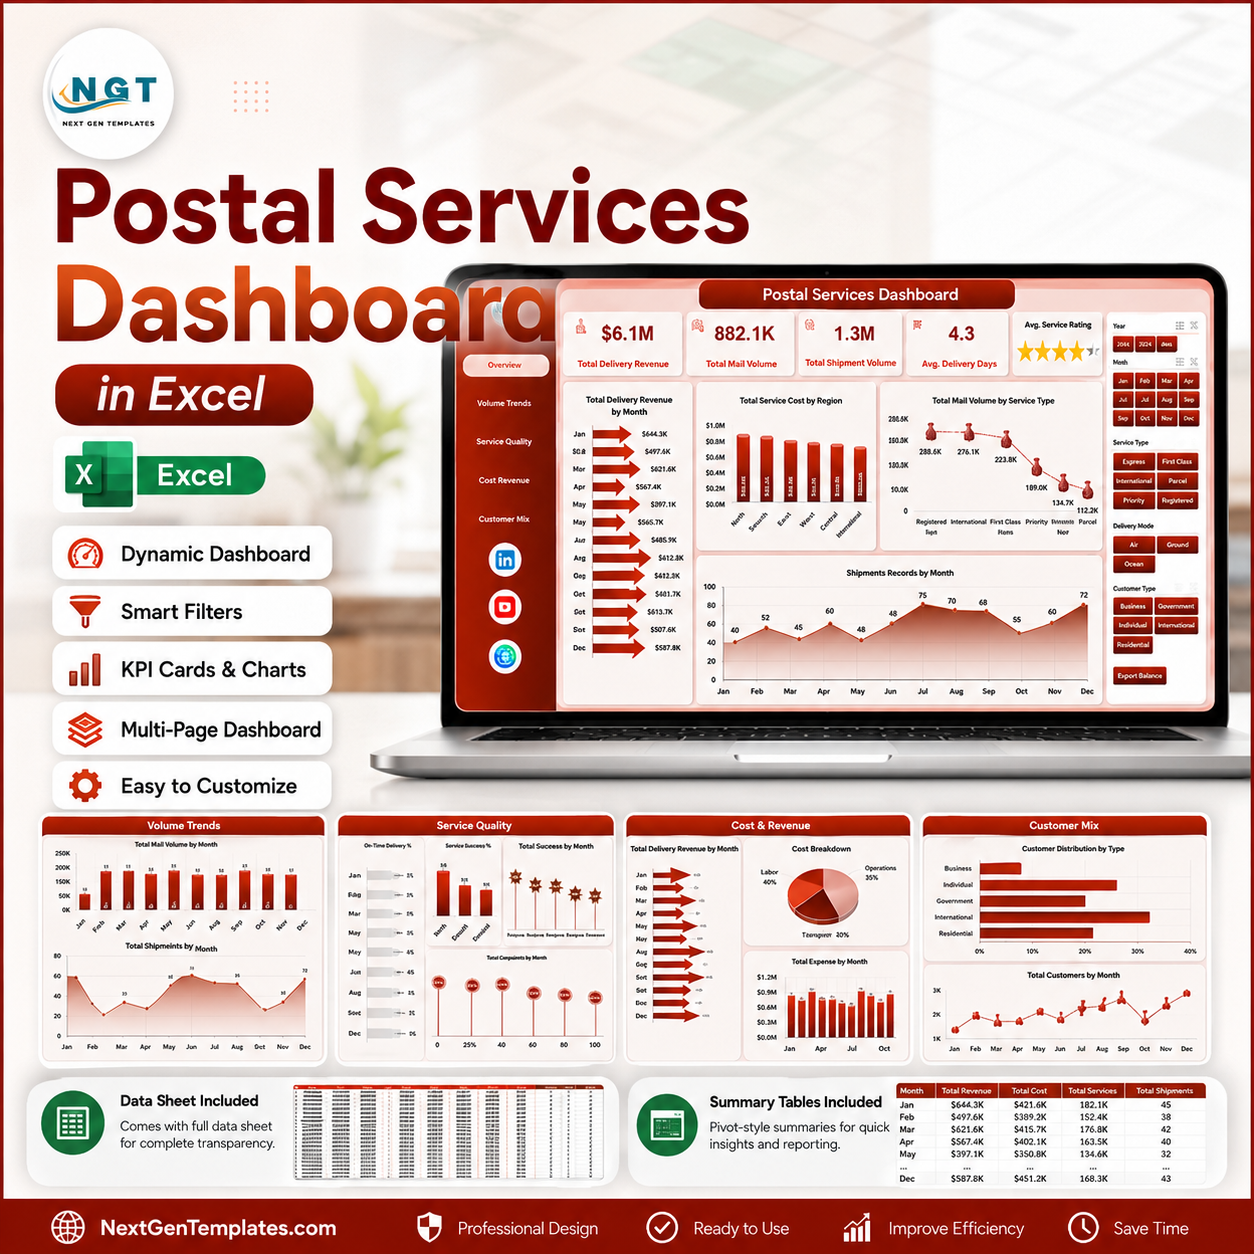

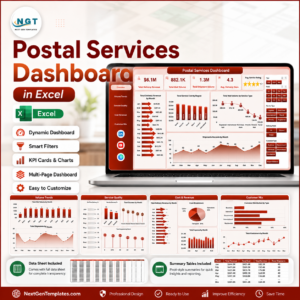
Postal Services Dashboard in Excel helps postal branches, courier teams, and delivery operations review 5 headline metrics, 5 analysis pages, 20 chart views, and slicer-driven filtering from one Excel workbook. Instead of checking mail volume, shipment volume, revenue, cost, delivery days, complaints, and service ratings in separate files, your team can update the Data sheet, refresh pivots, and review the full dashboard flow in minutes. Join 8,400+ teams in 40+ countries using NextGenTemplates to replace recurring software costs with one-time Excel, Google Sheets, Power BI, and HTML templates. Instant download, one-time payment, no subscription, lifetime access.
Key Features of Postal Services Dashboard in Excel
- 5 dashboard pages – Overview, Volume Trends, Service Quality, Cost Revenue, and Customer Mix.
- 5 headline cards – Total Delivery Revenue, Total Mail Volume, Total Shipment Volume, Avg. Delivery Days, and Avg. Service Rating.
- 20 chart views – Analyze delivery revenue, service cost, mail volume, shipment records, delivery success, complaints, facility type, customer type, and regional performance.
- Multiple slicers – Filter the dashboard quickly by the available dimensions in your workbook.
- Structured Data and Support sheets – Replace source data, refresh pivots, and keep the support pivots hidden during daily use.
Postal Services Dashboard in Excel
What’s Inside the Postal Services Dashboard in Excel
Overview Page
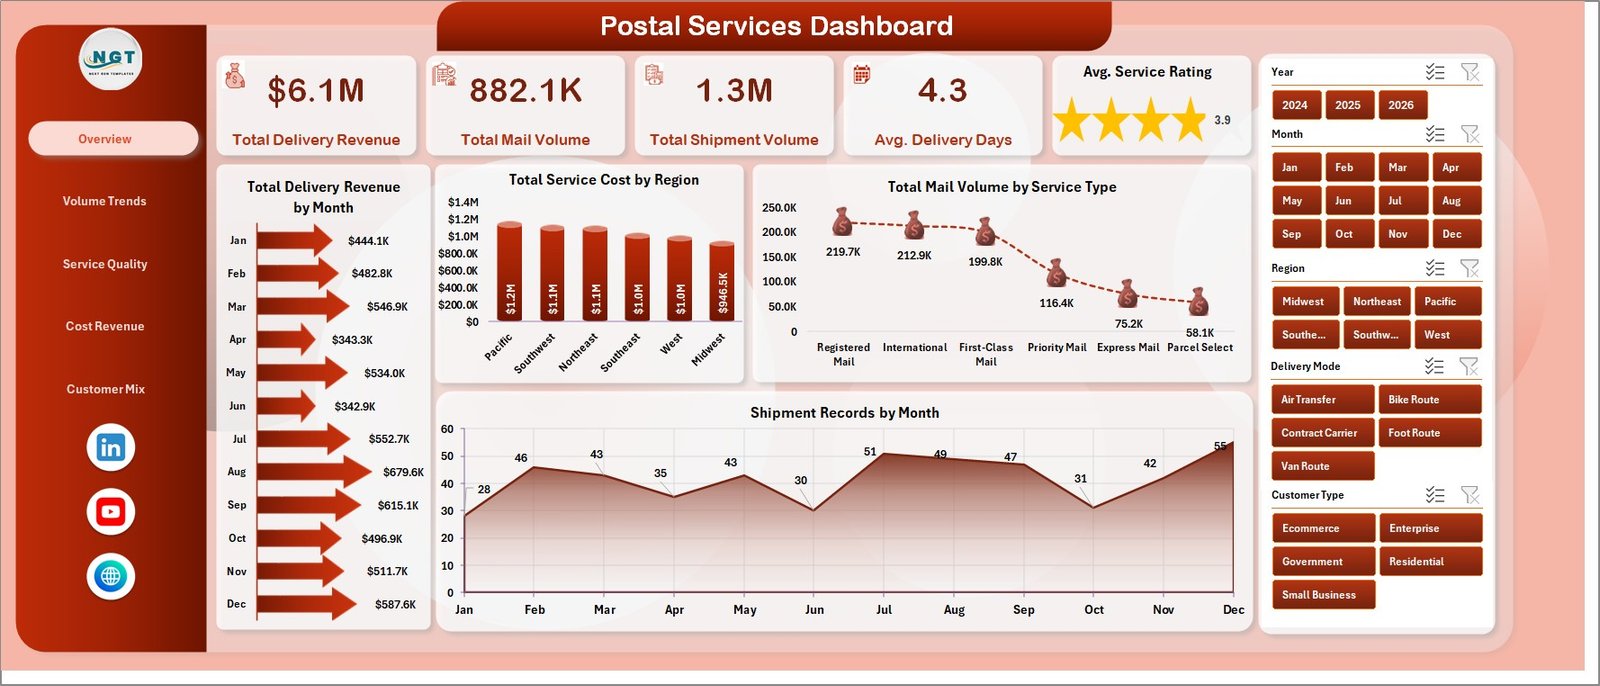
The Overview page gives the high-level view first. The top cards summarize Total Delivery Revenue, Total Mail Volume, Total Shipment Volume, Avg. Delivery Days, and Avg. Service Rating, so managers can see service health before opening deeper pages.
The charts show Total Delivery Revenue by Month, Total Service Cost by Region, Total Mail Volume by Service Type, and Shipment Records by Month. These visuals help compare financial performance, demand mix, and shipment activity over time while slicers make filtered review fast.
Volume Trends
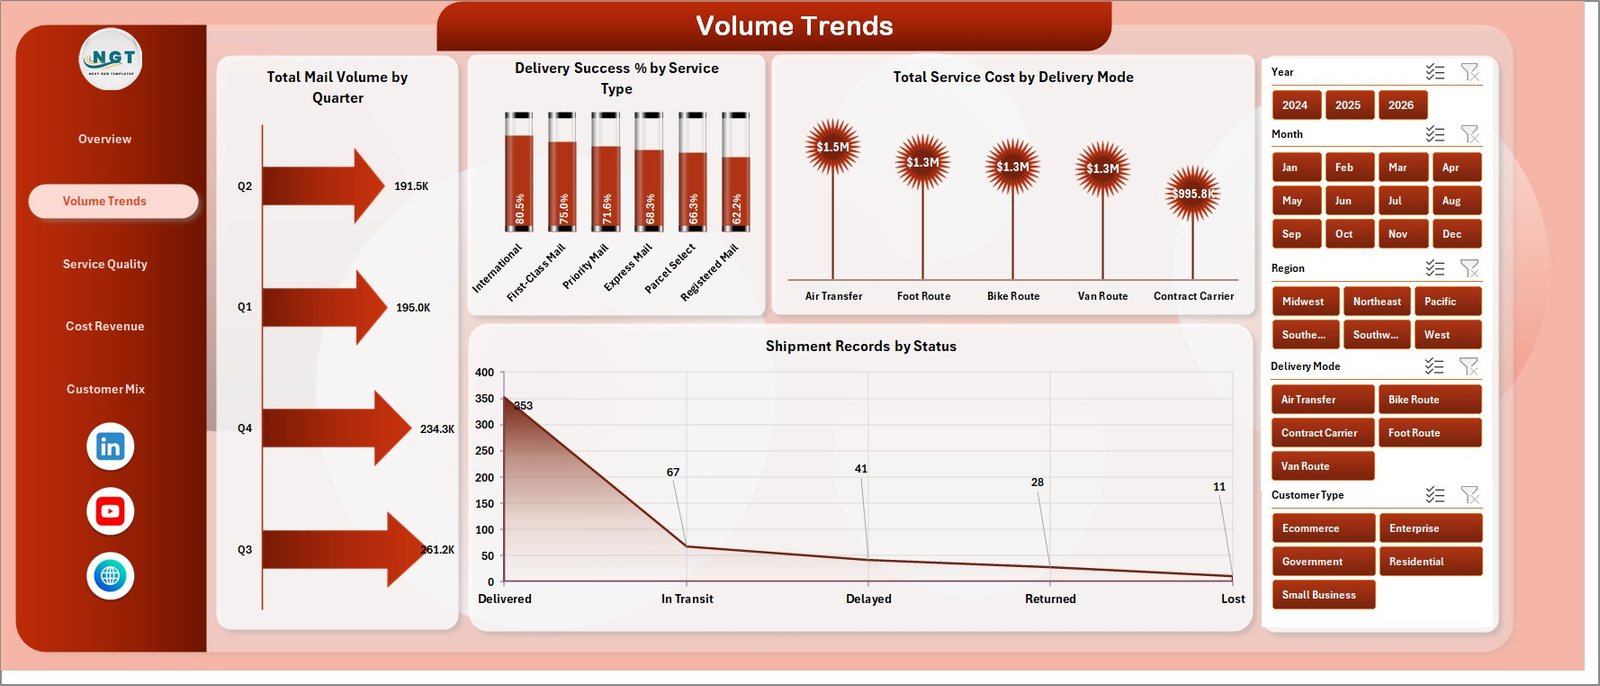
This page focuses on movement volume and delivery throughput. It includes Total Mail Volume by Quarter, Delivery Success % by Service Type, Total Service Cost by Delivery Mode, and Shipment Records by Status.
Volume Trends
Service Quality
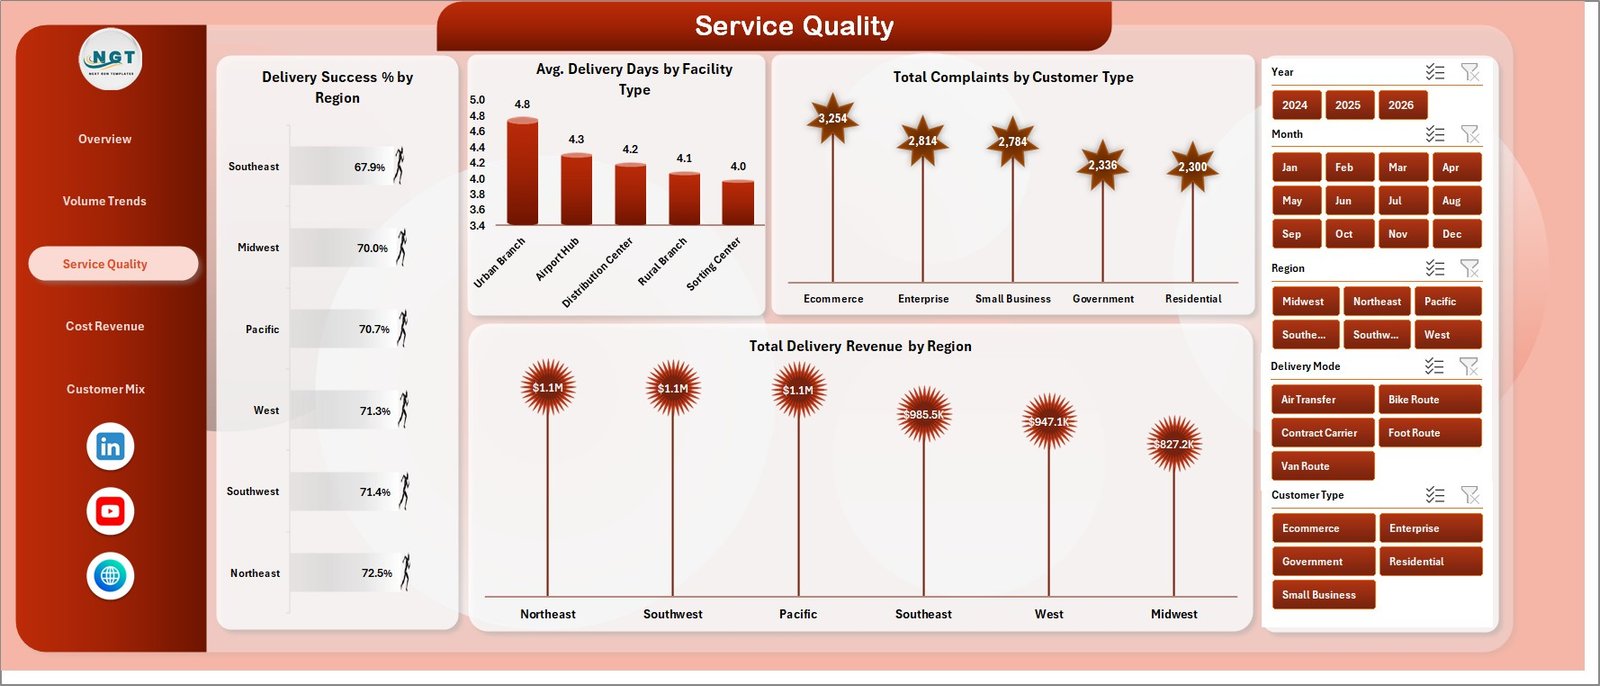
The Service Quality page helps identify where delivery experience is strong and where corrective action is needed. It reviews Delivery Success % by Region, Avg. Delivery Days by Facility Type, Total Complaints by Customer Type, and Total Delivery Revenue by Region.
Service Quality
Cost Revenue
The Cost Revenue page connects operational workload with cost and revenue signals. It includes Total Shipment Volume by Service Type, Total Service Cost by Facility Type, Delivery Success % by Quarter, and Total Delivery Revenue by Customer Type.
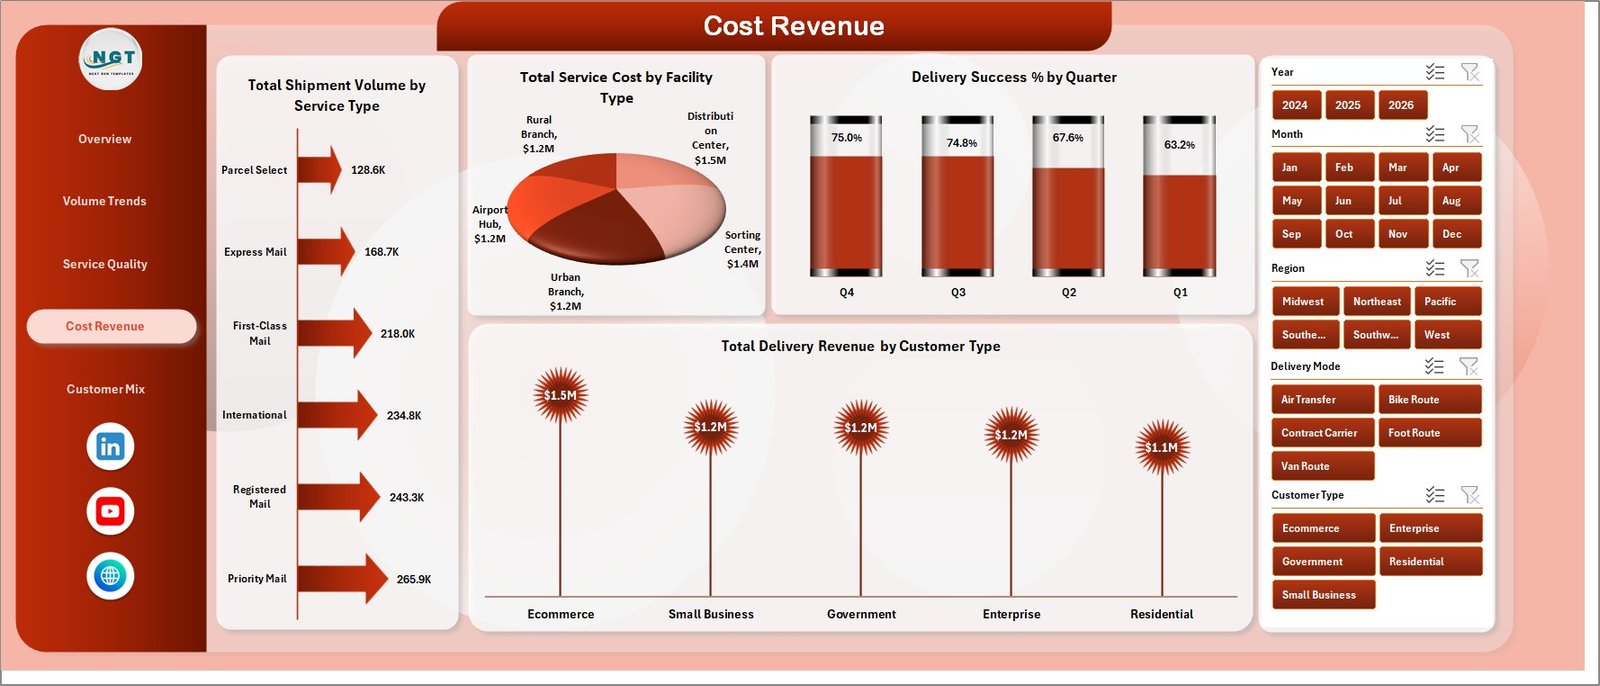
Cost Revenue
Customer Mix
The Customer Mix page shows how different customer groups and time periods contribute to shipment activity. It includes Delivery Success % by Customer Type, Total Shipment Volume by Quarter, and Total Shipment Volume by Month.
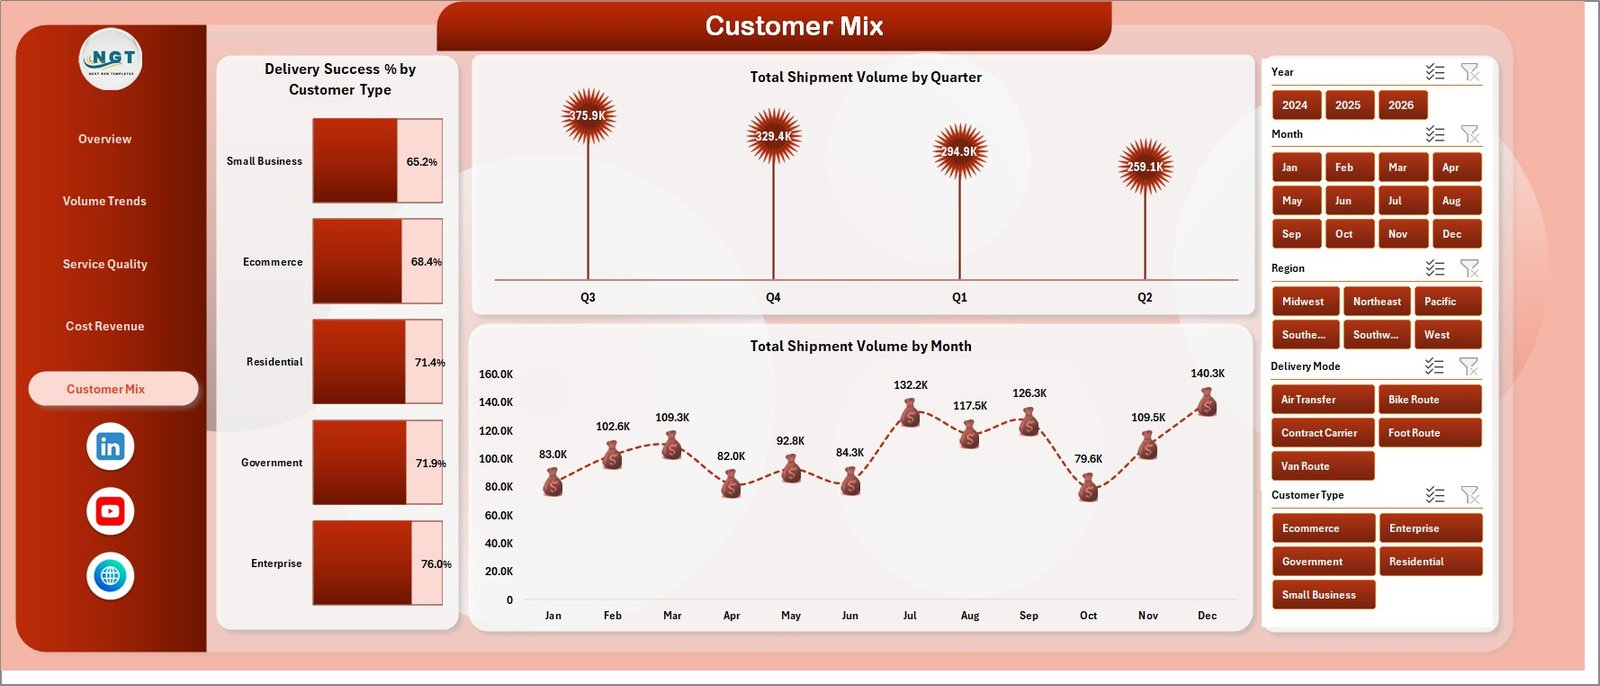
Customer Mix
Data Sheet and Support Sheet
The Data sheet is where users add postal records in the same format as the sample data. The Support sheet stores the pivot tables that feed the entire dashboard. After updating the Data sheet, go to the Excel Data tab and click Refresh All; you can keep the Support sheet hidden during normal use.

Data Sheet tab

Support sheet tab
Postal Services Dashboard in Excel vs. Google Sheets vs. Paid Logistics SaaS – Where This Fits
| Feature | This Excel dashboard | Google Sheets dashboard | Paid logistics SaaS |
|---|---|---|---|
| Cost | $17.99 one-time | One-time or shared sheet cost | Usually monthly per user or location |
| Platform | Microsoft Excel desktop | Browser-based spreadsheet | Cloud software account |
| Setup time | Update data and refresh pivots | Requires sheet sharing setup | May need onboarding and integrations |
| Offline access | Yes | Limited | No |
| Postal-specific pages | 5 ready pages | Must be built or copied | Depends on vendor module |
Who This Template Is For – and Who It’s Not For
This template is for postal department managers, courier branch supervisors, logistics analysts, regional service heads, and Excel users who need monthly service, volume, cost, and customer mix reporting without a new software subscription.
It is not for teams that need live GPS tracking, barcode scanning, automated route optimization, customer-facing parcel tracking, or API-based operational control. For those needs, a full logistics SaaS or transportation management system is a better fit.
How to Use the Postal Services Dashboard in Excel
- Download and unzip the template file.
- Open the workbook in Microsoft Excel.
- Go to the Data sheet and replace the sample records with your postal service data in the same format.
- Use the Excel Data tab and click Refresh All.
- Review each dashboard page and use slicers to filter the dashboard.
- Keep the Support sheet hidden if you want a cleaner user-facing workbook.
Real-World Use Cases
Anita, a regional postal operations manager, reviews delivery revenue by month and service cost by region before the weekly performance meeting. She uses slicers to isolate underperforming regions and prepares action points without rebuilding reports.
Rohit, a courier branch supervisor, checks shipment records by status and delivery success by service type to understand where delayed or failed shipments are increasing.
Meena, a postal finance analyst, compares service cost by delivery mode and facility type so she can explain why certain delivery channels are becoming more expensive.
Frequently Asked Questions
What does the Postal Services Dashboard in Excel track?
It tracks delivery revenue, mail volume, shipment volume, average delivery days, service rating, service cost, delivery success percentage, complaints, customer type, service type, region, facility type, delivery mode, and status-based shipment records.
Can I use my own postal data?
Yes. Replace the sample data in the Data sheet using the same columns and refresh all pivots from the Excel Data tab.
Do I need advanced Excel skills?
No. Basic Excel knowledge is enough for data entry, slicer filtering, and refresh. Advanced users can customize formulas, pivots, and charts.
Can the Support sheet be hidden?
Yes. The Support sheet contains pivot tables that power the dashboard. You can keep it hidden for daily users and unhide it when you need to inspect or adjust pivots.
Does it work offline?
Yes. The workbook runs in Microsoft Excel and does not require a subscription dashboard platform.
About the Author
Built by PK – Microsoft Certified Professional with 15+ years of Excel, Google Sheets, and Power BI experience. Founder of NextGenTemplates, reaching 300K+ subscribers across YouTube channels. Every template is hand-built and tested before release.
Explore Related Templates
- Postal Services KPI Dashboard in Excel
- Fleet Fuel Log Data Entry System in Excel
- Logistics Manager Toolkit
- Trucking and Logistics Dashboard in Power BI
- Excel Dashboard Templates
- Logistics Templates
Click here to read the Detailed Blog Post
Download the Postal Services Dashboard in Excel today and turn postal operations data into a clear monthly performance review.
Last updated: July 2026
Watch the demo video:
Compatibility and Requirements
- Works in Microsoft Excel desktop (Excel 2016 or later, or Microsoft 365).
- The dashboard uses pivot tables and slicers. After you update the Data sheet, click Refresh All on the Data tab. Microsoft explains slicers in Use slicers to filter data.











Reviews
There are no reviews yet.