

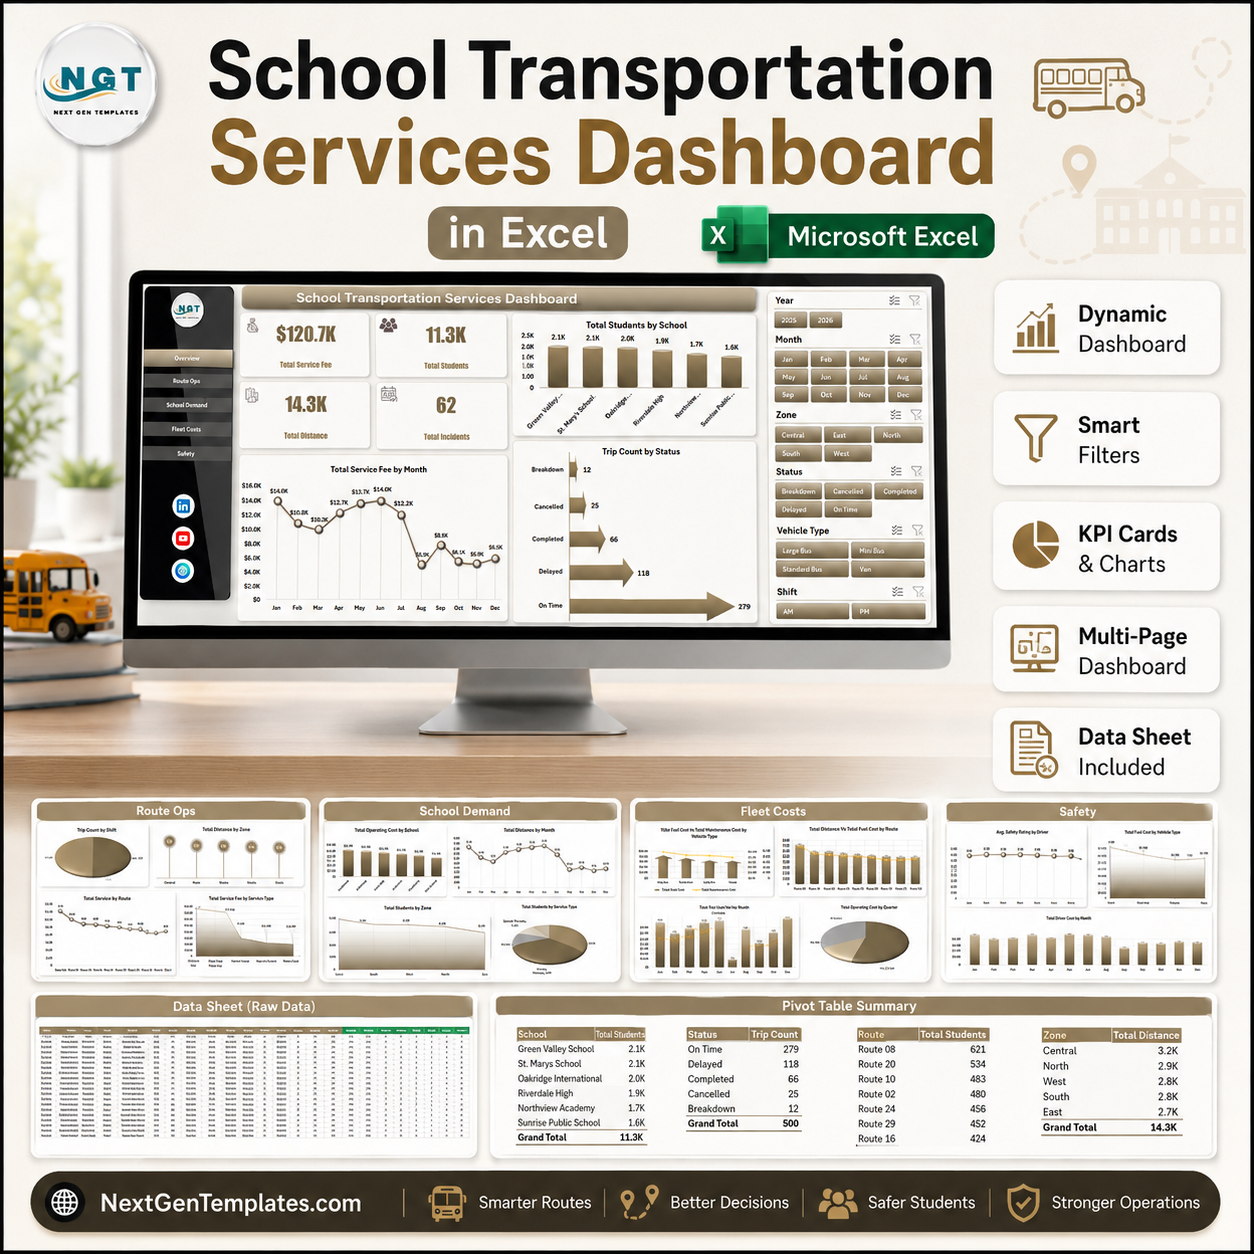


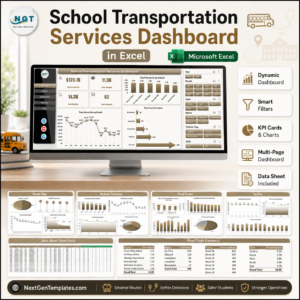
Last updated: August 8, 2026. The School Transportation Services Dashboard in Excel gives school transport teams 7 workbook tabs, 4 executive KPI cards, 18 analysis charts, and slicer-based filtering in one editable Excel dashboard. Built by PK, a Microsoft Certified Professional with 15+ years of spreadsheet experience and 300K+ tutorial subscribers, this template helps you review service fees, student volume, route distance, incidents, fleet cost, driver safety, and school demand without a recurring SaaS subscription. Download once, replace the sample data, click Refresh All, and use the dashboard for route reviews, monthly reporting, and management meetings.
Key Features of School Transportation Services Dashboard in Excel
- 4 KPI cards: Total Service Fee, Total Students, Total Distance, and Total Incidents.
- 7 worksheet tabs: Overview, Route Ops, School Demand, Fleet Costs, Safety, Data Sheet, and Support Sheet.
- 18 analysis charts: analyze schools, months, trip status, shifts, zones, routes, vehicle types, and safety performance.
- Multiple slicers: filter dashboard pages quickly without rebuilding formulas or charts.
- Pivot-driven refresh: update the Data Sheet, then click Data > Refresh All in Excel.
- Excel-native workflow: no coding, no add-ins, and no monthly transport software contract required.
What’s Inside the School Transportation Services Dashboard in Excel
1 – Overview Page
The Overview Page is the executive summary for school transportation services. It shows Total Service Fee, Total Students, Total Distance, and Total Incidents at the top so leaders can see the main operating picture before opening the detailed analysis pages.
Total Students by School: Compares student volume by school location. Use it to identify campuses with the highest transportation demand and plan vehicle capacity accordingly.
Total Service Fee by Month: Shows monthly fee trends for transportation services. It helps finance and operations teams understand seasonal movement in service revenue.
Trip Count by Status: Breaks trips into status groups based on your data. It helps route managers spot delays, cancellations, completed trips, and follow-up priorities.

2 – Route Ops
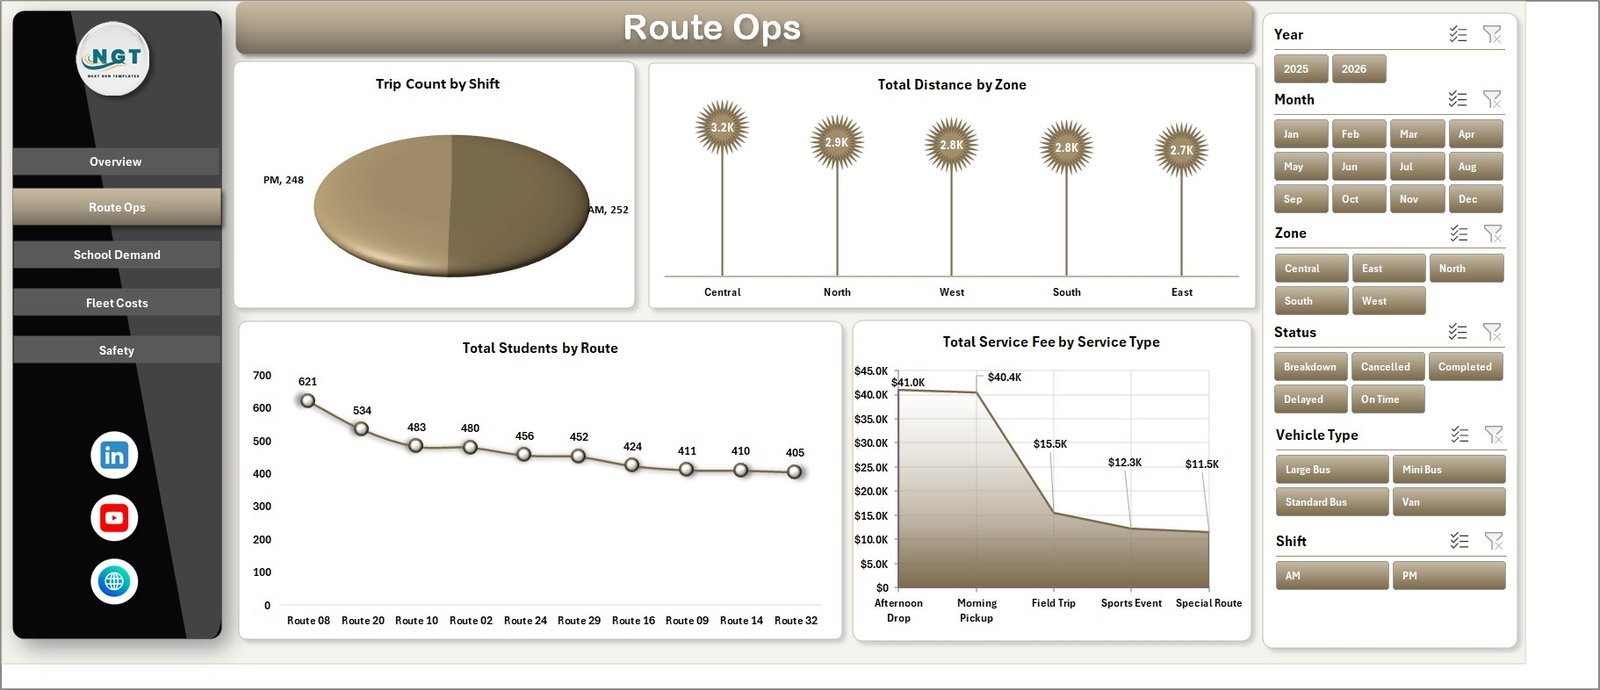
The Route Ops page focuses on daily route and trip operations. Trip Count by Shift helps coordinators balance morning, afternoon, and custom shift workloads. Total Distance by Zone highlights high-distance zones for cost and route review. Total Students by Route supports capacity planning, while Total Service Fee by Service Type shows which transportation services contribute most to collected fees.

3 – School Demand
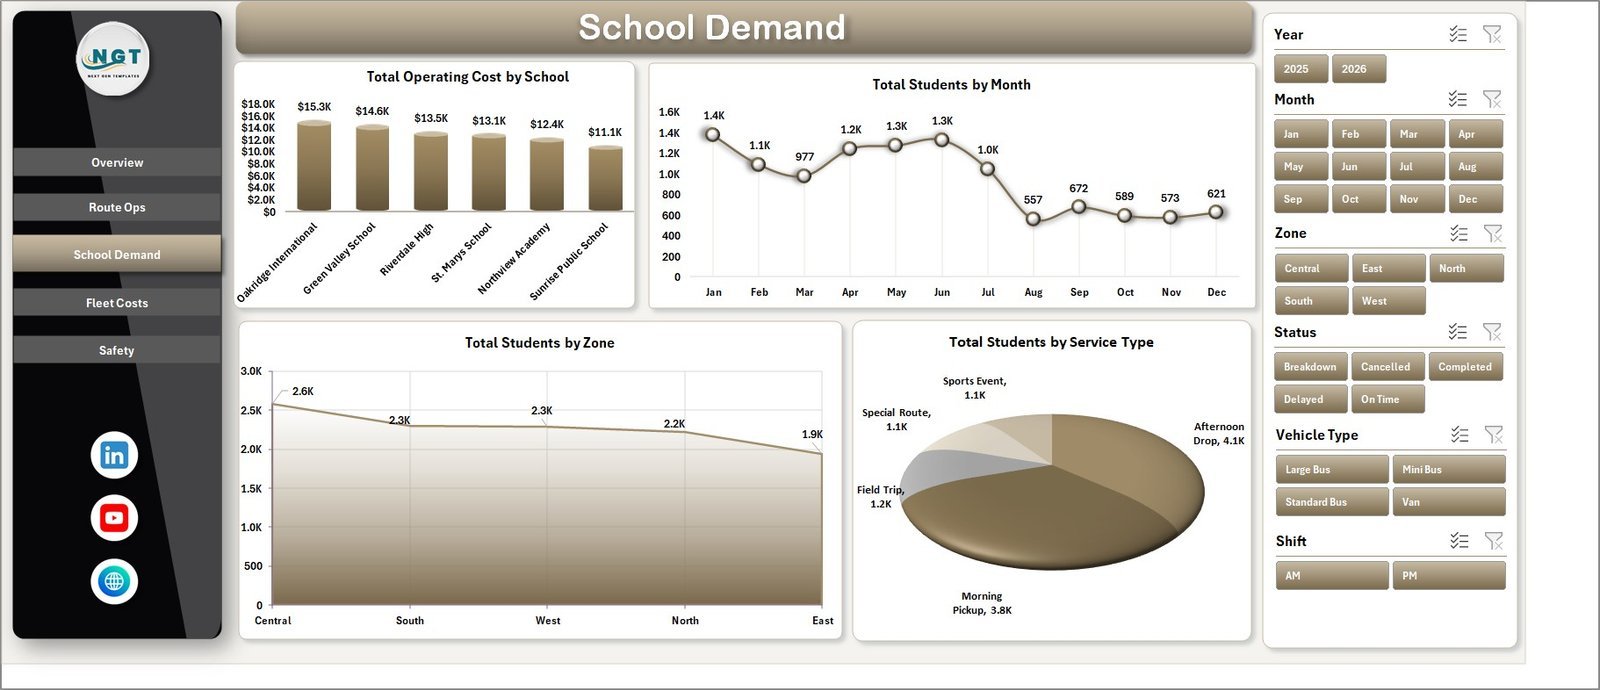
The School Demand page helps administrators understand where transport demand and operating cost are concentrated. It includes Total Operating Cost by School, Total Students by Month, Total Students by Zone, and Total Students by Service Type. These views help teams prepare for enrollment cycles, review zone coverage, and match transportation capacity with demand.

4 – Fleet Costs
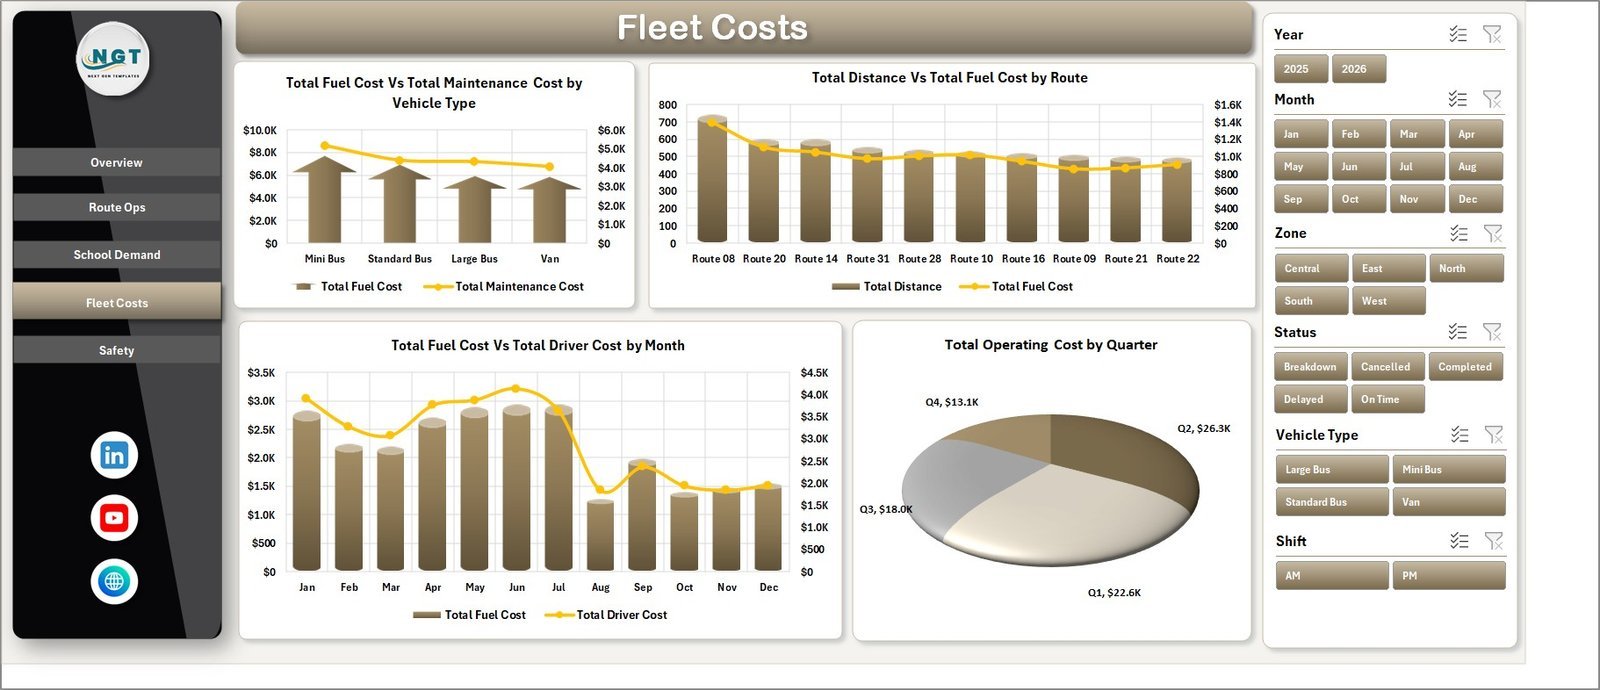
The Fleet Costs page reviews major transportation cost drivers. Total Fuel Cost vs Total Maintenance Cost by Vehicle Type helps identify vehicle groups that need cost review. Total Distance vs Total Fuel Cost by Route shows whether route fuel cost aligns with distance traveled. Total Fuel Cost vs Total Driver Cost by Month supports monthly cost control, and Total Operating Cost by Quarter summarizes cost movement across the school year.

5 – Safety
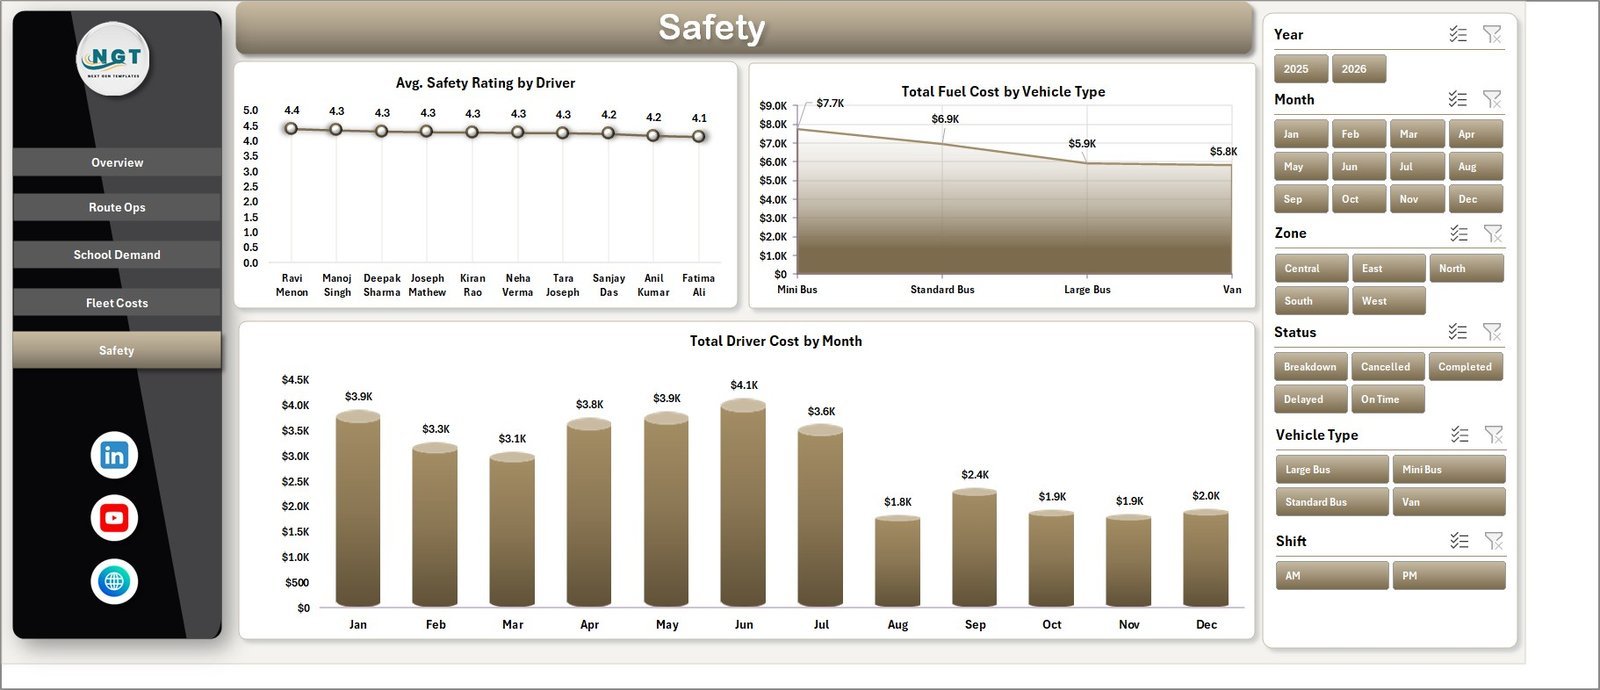
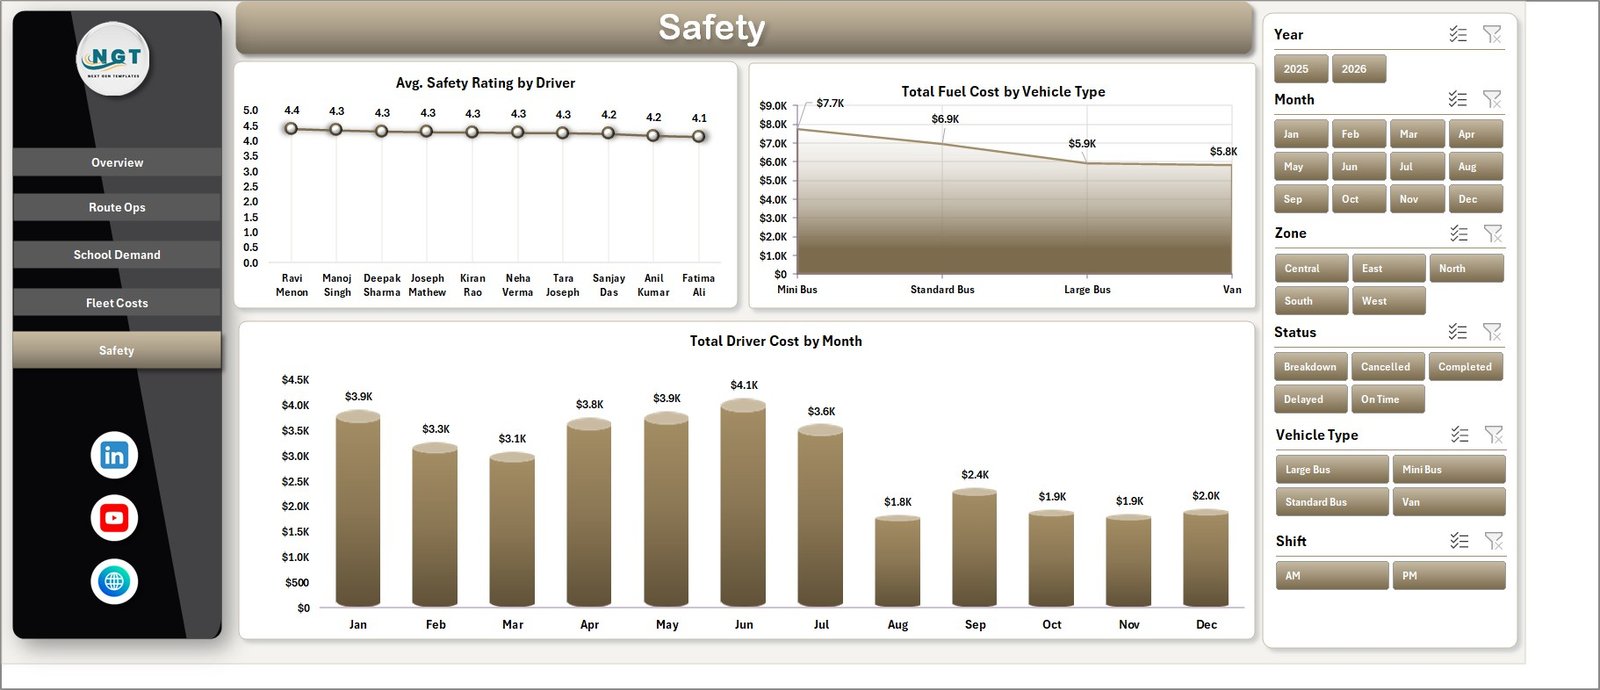
The Safety page gives supervisors a focused view of driver and vehicle-related safety indicators. Avg. Safety Rating by Driver helps identify strong performers and coaching needs. Total Fuel Cost by Vehicle Type supports fleet review from an operating lens, while Total Driver Cost by Month helps compare staffing cost movement against transport demand.
6 – Data Sheet Tab
The Data Sheet is where you add or replace the sample transportation records. Keep the same column structure so the pivot tables and dashboard visuals continue to update correctly.

7 – Support Sheet Tab
The Support Sheet contains the pivot tables used to power the dashboard. After updating the Data Sheet, go to the Excel Data ribbon and click Refresh All so the pivots, charts, and cards refresh together. You can keep this sheet hidden during normal use.

School Transportation Services Dashboard in Excel vs. Google Sheets vs. Paid School Transport SaaS – Where This Fits
| Feature | This Excel dashboard | Google Sheets alternative | Paid school transport SaaS |
|---|---|---|---|
| Cost | $17.99 one-time sale price | Manual build or template cost | Usually monthly, annual, or per-student |
| Platform | Microsoft Excel | Google Sheets in Drive | Vendor-hosted web app |
| Setup time | Replace data and refresh pivots | Requires chart and formula setup if built manually | Requires account, configuration, and training |
| Customizable fields | Editable workbook structure | Editable sheet structure | Limited by vendor settings |
| Year-1 cost at 5 users | $17.99 before any Microsoft licensing | Template plus Google Workspace costs if applicable | Can grow with users, buses, routes, or students |
| Pivot refresh workflow | Included with Support Sheet and Refresh All | Manual refresh or formulas depending on build | Vendor-managed reports |
Who This Template Is For – and Who It’s Not For
This template is for school administrators, transport coordinators, fleet supervisors, route managers, finance officers, and operations teams that need a clear way to track school transportation performance in Excel.
It is not a GPS tracking system, parent notification app, bus routing optimizer, payment gateway, live driver dispatch platform, or substitute for regulated transport compliance software. Use it for reporting and analysis, not live vehicle control.
How to Use the School Transportation Services Dashboard in Excel
- Download and unzip the file.
- Open the workbook in Microsoft Excel.
- Replace the sample records in the Data Sheet using the same format.
- Go to the Data tab in the Excel ribbon and click Refresh All.
- Use slicers on each page to filter by school, route, zone, month, vehicle type, status, or other available fields.
- Review KPI cards and charts for route planning, cost control, and safety follow-up.
Real-World Use Cases
Anita, school operations manager: reviews Total Students by Route and Trip Count by Shift every Monday to balance morning and afternoon bus schedules.
Marcus, fleet supervisor: uses the Fleet Costs page to compare fuel and maintenance by vehicle type before planning quarterly inspections.
Priya, school finance officer: checks Total Service Fee by Month and Operating Cost by School before monthly management reporting.
Frequently Asked Questions
What does the School Transportation Services Dashboard in Excel track?
It tracks service fee, students, distance, incidents, trip status, shifts, routes, zones, operating cost, fuel cost, maintenance cost, driver cost, and safety rating using the available workbook fields.
How many tabs are included?
The workbook includes 7 visible workflow tabs: Overview, Route Ops, School Demand, Fleet Costs, Safety, Data Sheet, and Support Sheet.
Do I need macros?
No macro requirement is described for this dashboard. It is designed around Excel data, pivot tables, slicers, cards, and charts.
How do I refresh the dashboard?
Update the Data Sheet, then click Data > Refresh All in Excel. The Support Sheet pivots and dashboard charts will refresh from the updated records.
Can I hide the Support Sheet?
Yes. The Support Sheet can be kept hidden after setup because it mainly contains the pivot tables that power the dashboard.
Can I customize the data?
Yes. Replace the sample data with your own school transportation records while keeping the same column format for best results.
About the Author
Built by PK – Microsoft Certified Professional with 15+ years of Excel, Google Sheets, and Power BI experience. Founder of NextGenTemplates, reaching 300K+ subscribers across YouTube channels. Every template is hand-built and tested before release.
Explore Related Templates
- School Admin Dashboard in Excel for broader school administration reporting.
- Transportation Services KPI Dashboard in Excel for transportation KPI tracking.
- Logistics and Transportation Hub for a larger transportation analytics bundle.
- Browse Excel dashboard templates.
- Browse Excel education templates.
Download the School Transportation Services Dashboard in Excel to monitor school transport fees, student demand, routes, distance, costs, incidents, and safety performance in one editable Excel workbook.
Last updated: August 8, 2026.











Reviews
There are no reviews yet.