

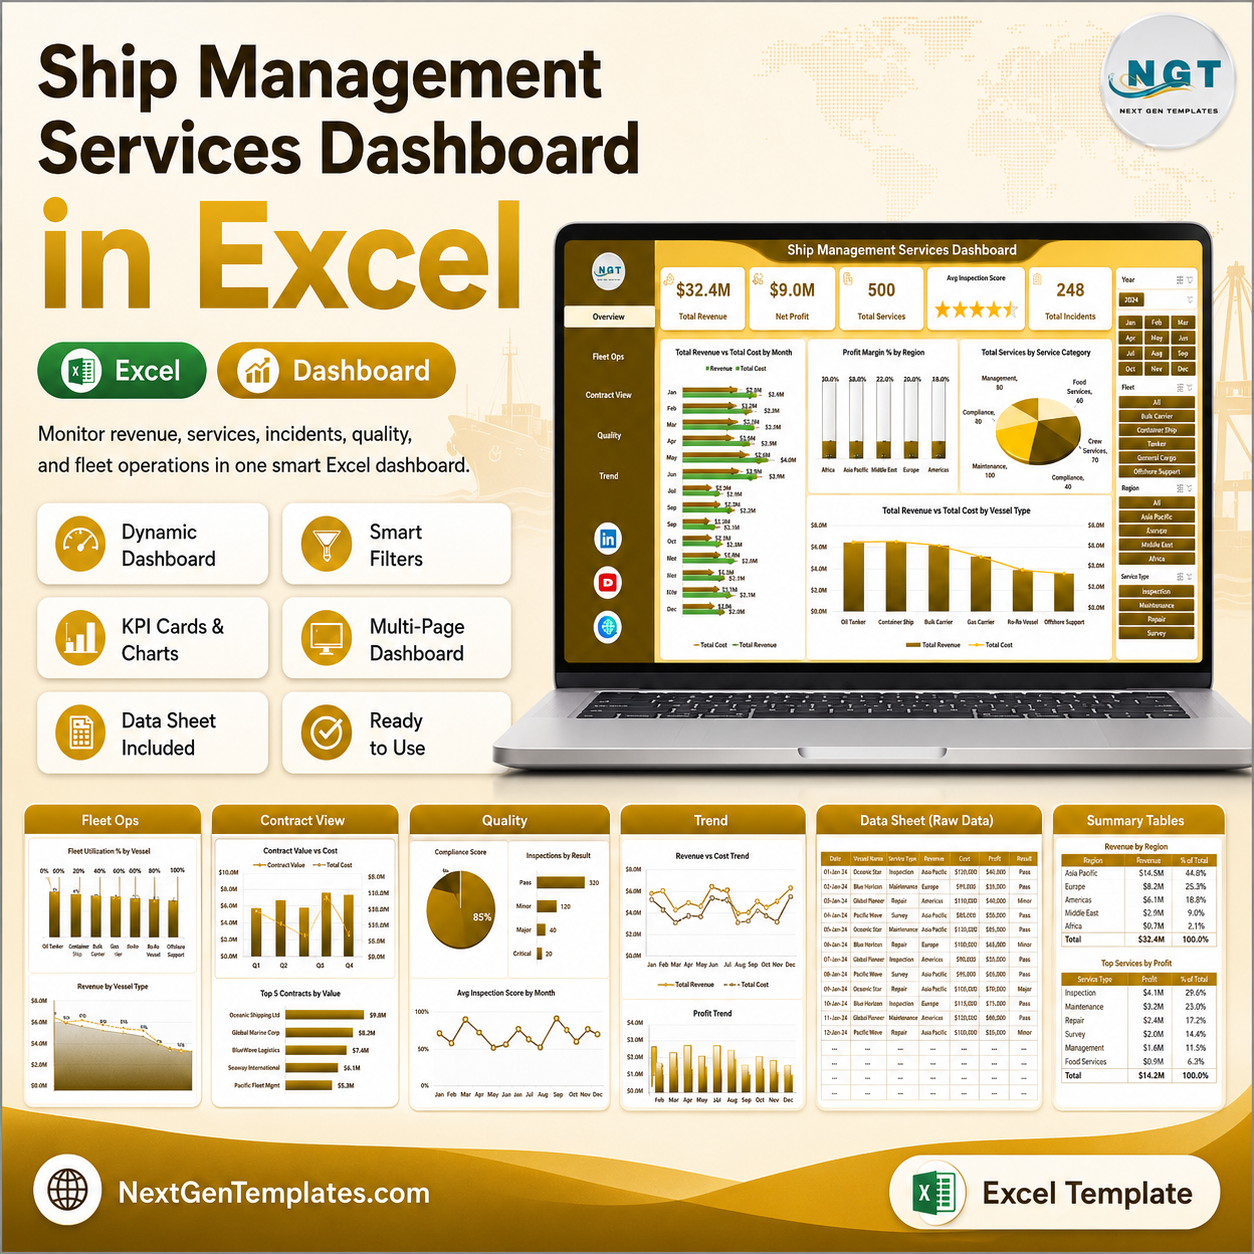


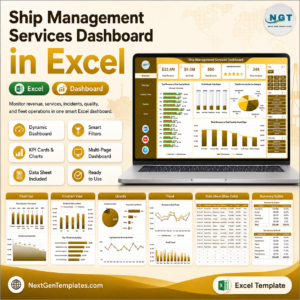
Ship Management Services Dashboard in Excel gives fleet service teams, marine operations managers, contract owners, and port service analysts a 7-sheet reporting workbook with 5 executive cards, 19 analysis charts, slicers, a structured data sheet, and a pivot-backed support sheet. For a one-time $17.99 sale price, it helps teams review revenue, cost, profit, SLA compliance, inspection scores, incidents, vessels, ports, clients, service categories, and contracts without paying for a recurring maritime analytics platform. Built by PK for a 300K+ subscriber audience, this Excel dashboard is designed for fast review, manual data replacement, and refreshable reporting.
Key Features of Ship Management Services Dashboard in Excel
- 5 overview KPI cards: Total Revenue, Net Profit, Total Services, Avg. Inspection Score, and Total Incidents.
- 7 worksheet tabs: Overview, Fleet Ops, Contract View, Quality, Trend, Data Sheet, and Support Sheet.
- 19 chart views: review revenue, cost, profit margin, services, SLA compliance, inspections, incidents, ports, clients, vessels, contract types, and monthly trends.
- Interactive slicers: filter dashboard pages quickly during fleet, contract, quality, and operations reviews.
- Editable source data: replace sample rows in the Data Sheet tab using the same structure.
- Pivot-backed reporting: refresh all pivots and charts from Excel’s Data tab after updating the data.
What’s Inside the Ship Management Services Dashboard in Excel
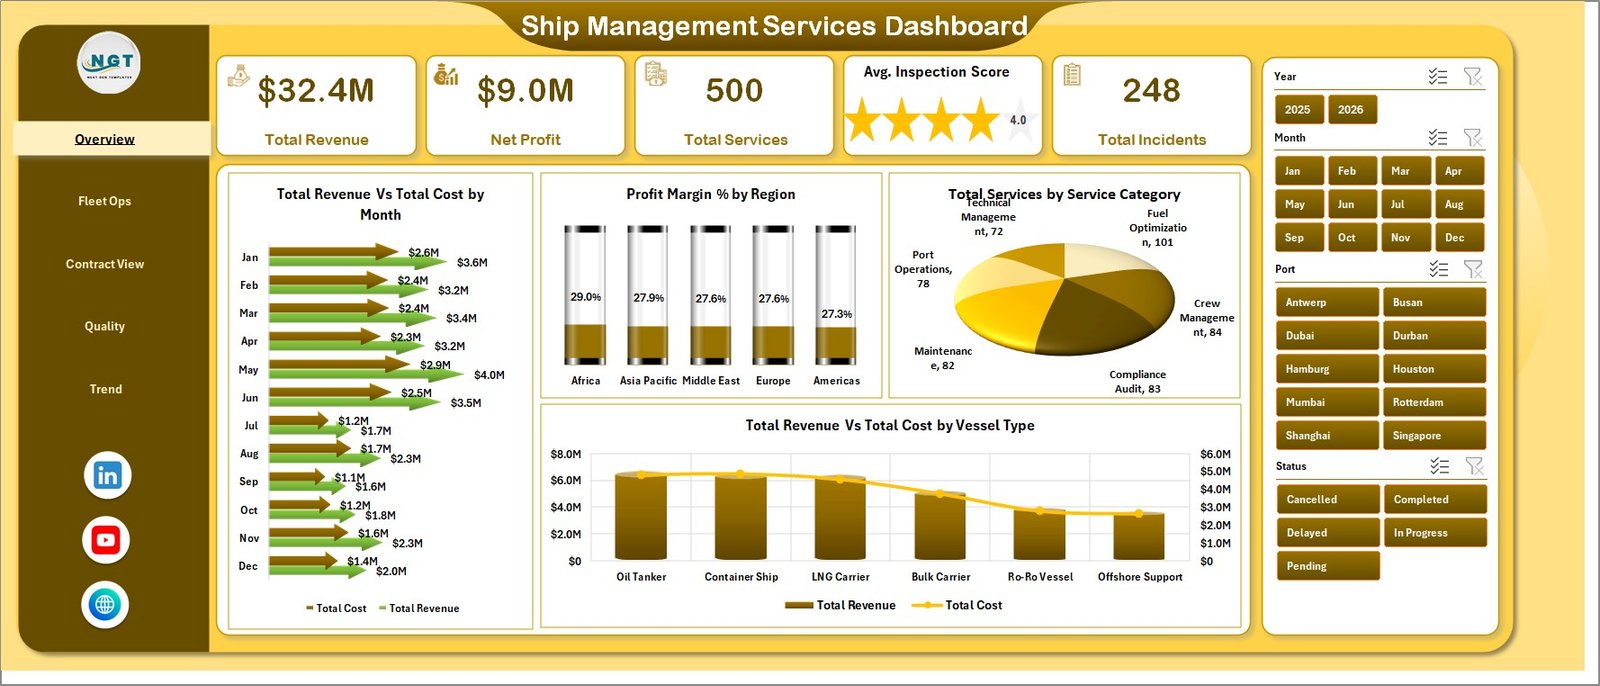
1 – Overview Page
The Overview page gives a high-level summary of commercial and service performance using cards for Total Revenue, Net Profit, Total Services, Avg. Inspection Score, and Total Incidents. Slicers let users filter the dashboard quickly while the main charts compare revenue, cost, profit margin, services, regions, categories, and vessel types.
Total Revenue Vs Total Cost by Month: Compares monthly income against service delivery cost so managers can see where margin pressure starts. It is useful for spotting cost spikes, seasonality, and months where revenue growth does not convert into profit.
Profit Margin % by Region: Shows which operating regions produce stronger or weaker margins. Regional leaders can use it to compare pricing, service mix, cost control, and commercial performance.
Total Services by Service Category: Breaks service volume into categories such as inspections, repairs, audits, compliance, or operations support. It helps teams understand service demand and plan staffing or vendor capacity.
Total Revenue Vs Total Cost by Vessel Type: Compares revenue and cost across vessel classes. This view helps identify vessel types that create higher workload, lower margin, or stronger revenue contribution.
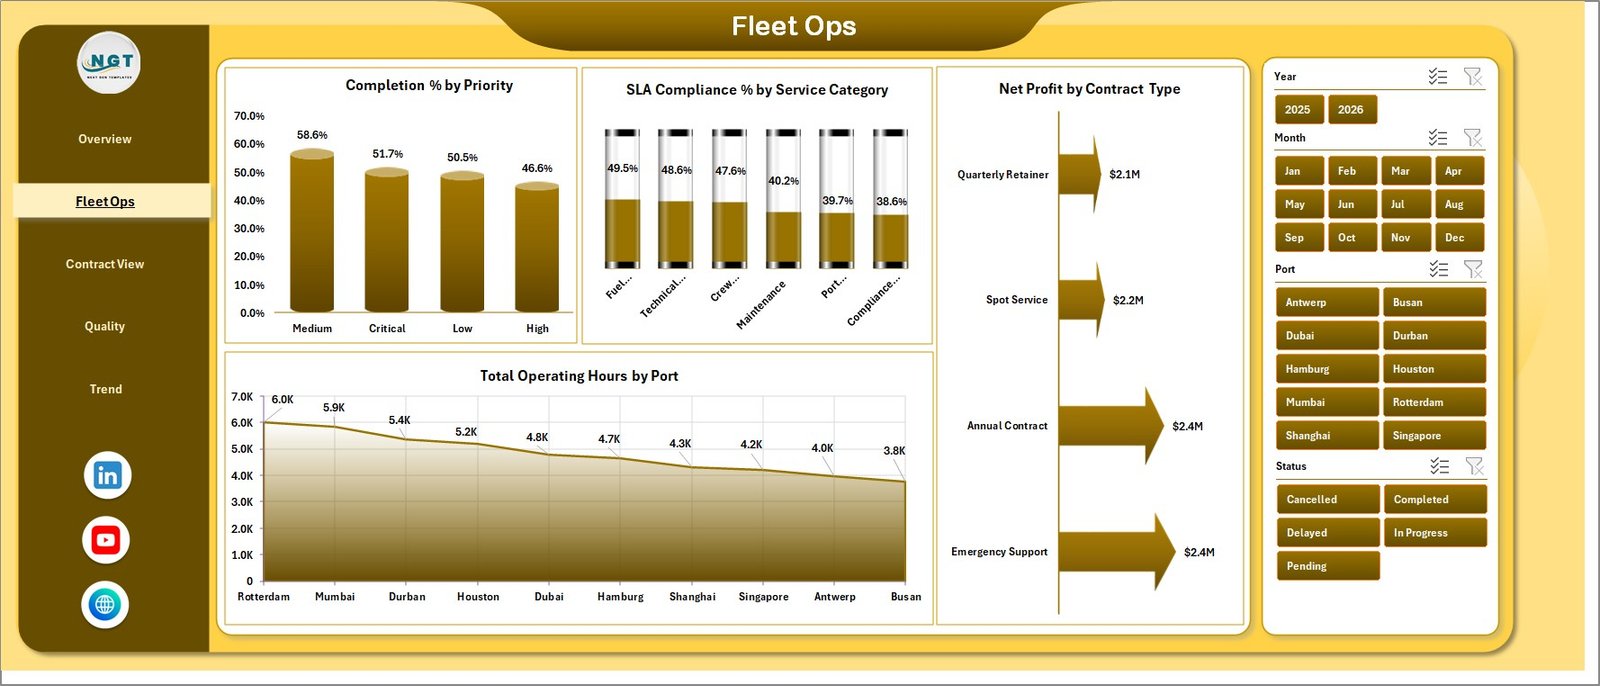
2 – Fleet Ops
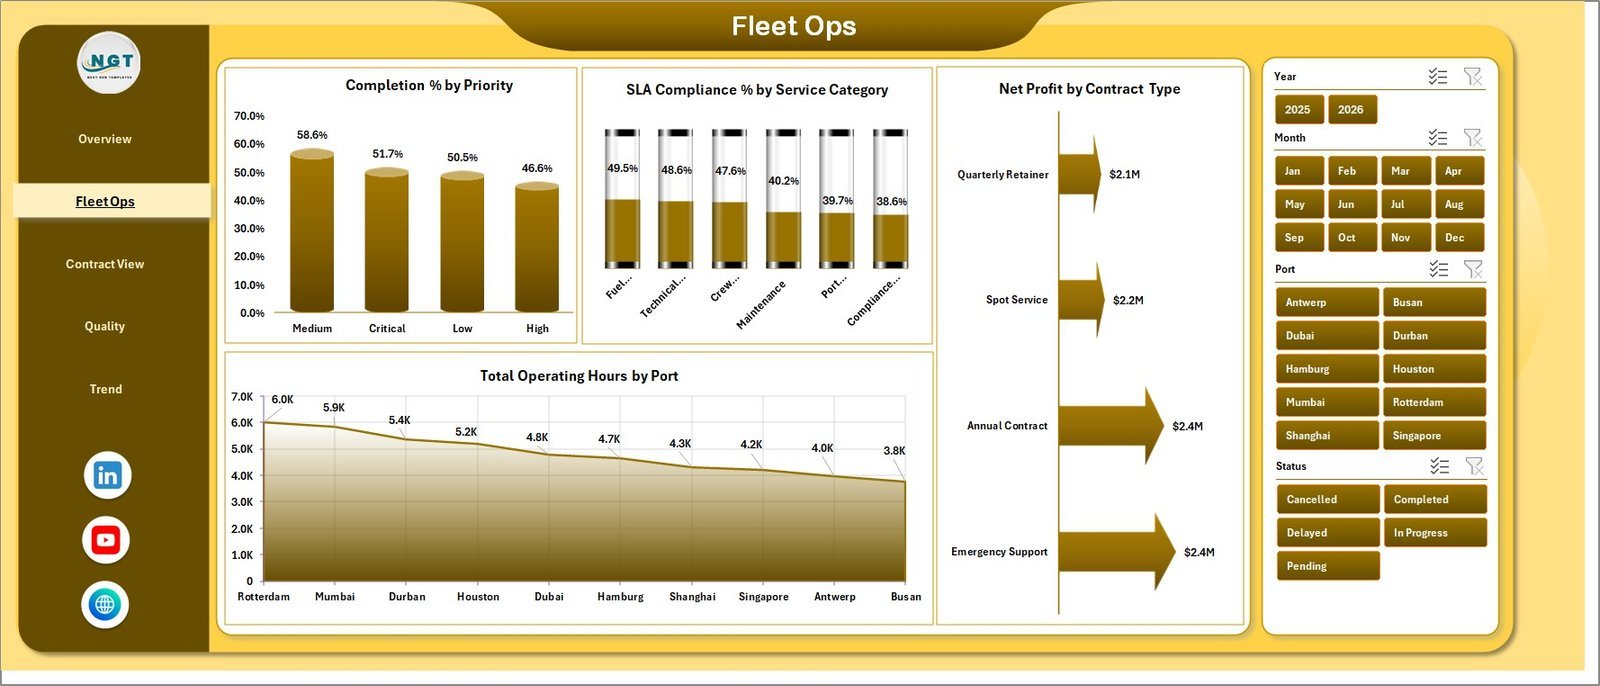
The Fleet Ops tab focuses on operational execution, service priority, SLA performance, port activity, and contract profitability. It is useful for fleet supervisors who need to compare delivery performance across ports, service categories, priorities, and contract structures.
Completion % by Priority: Shows how well high, medium, and low priority services are being completed. It helps operations teams check whether urgent work is getting the attention it needs.
SLA Compliance % by Service Category: Compares SLA performance across service types. Managers can quickly identify categories where delay risk or process issues need follow-up.
Total Operating Hours by Port: Displays workload concentration by port. This helps with resource planning, port coordination, and identifying locations with heavier operational demand.
Net Profit by Contract Type: Shows profit contribution across different contract models. It helps commercial teams compare fixed, variable, retainer, and other contract structures.
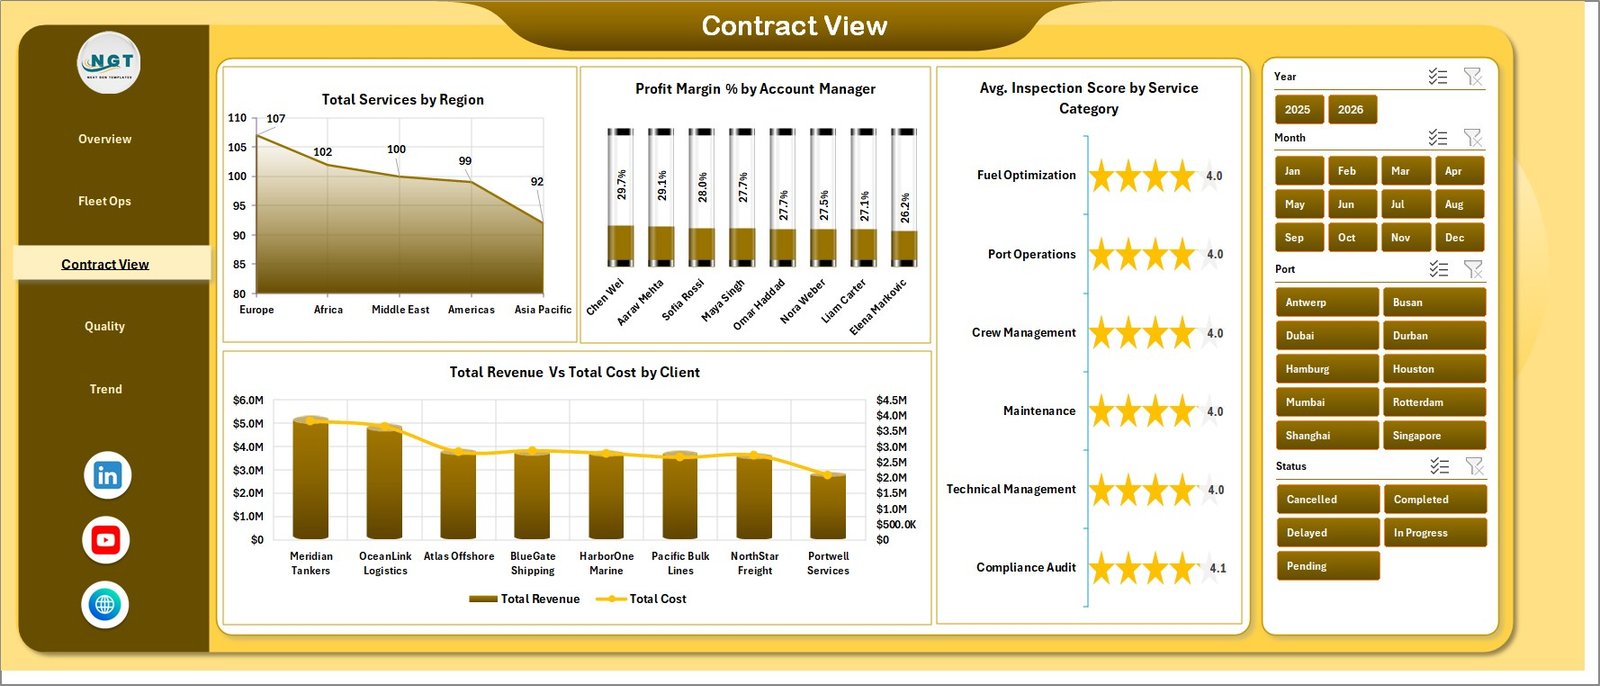
3 – Contract View
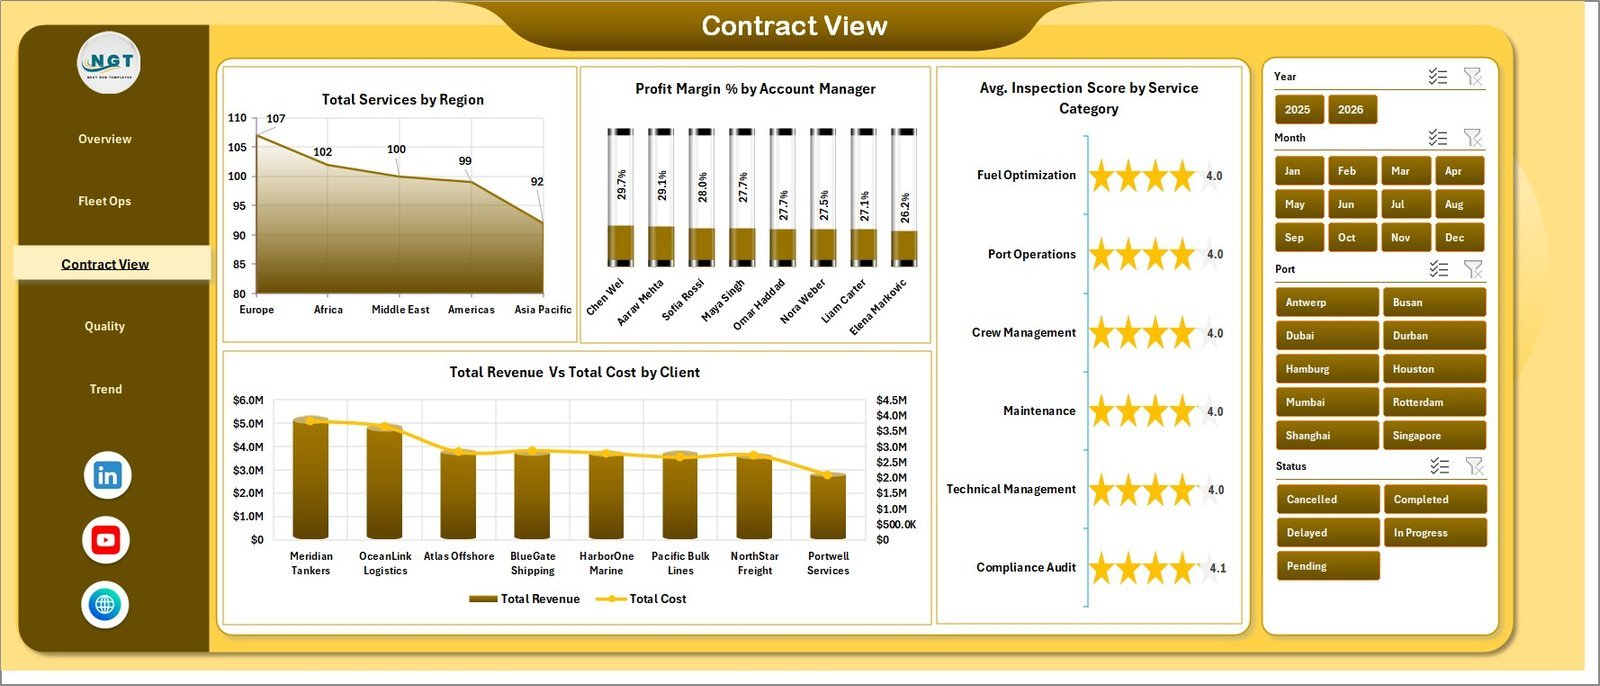
The Contract View tab connects service volume, region, account ownership, inspection quality, revenue, cost, and client-level performance. It helps account managers and contract owners review customer profitability and service quality from one sheet.
Total Services by Region: Summarizes where service demand is coming from geographically. It supports regional workload planning and performance comparison.
Profit Margin % by Account Manager: Shows margin performance by account ownership. Leaders can review pricing, service quality, and commercial follow-up by manager.
Avg. Inspection Score by Service Category: Compares quality results across service types. It helps teams see which service categories are meeting inspection expectations and which need improvement.
Total Revenue Vs Total Cost by Client: Compares client revenue and cost side by side. This is useful for identifying profitable clients, high-cost accounts, and contract review opportunities.
4 – Quality
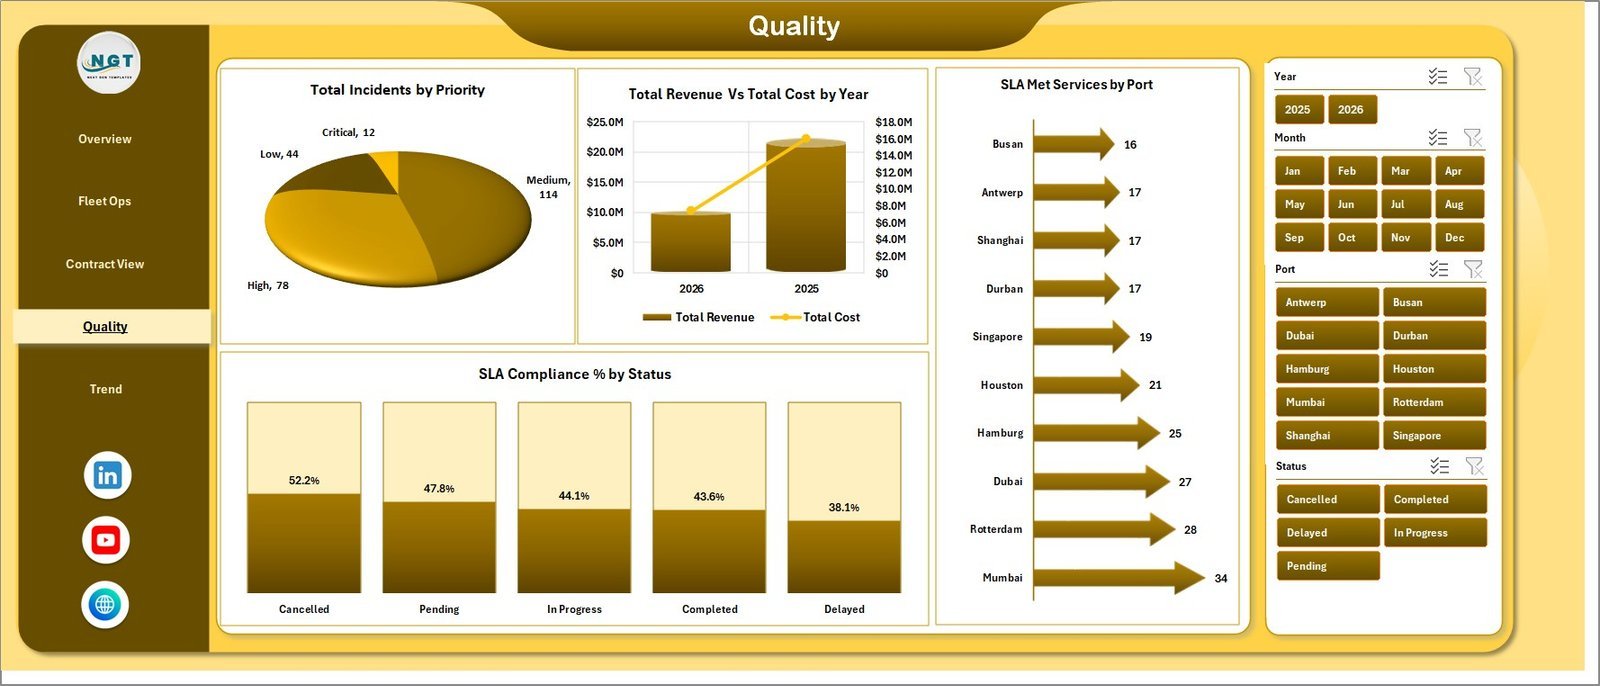
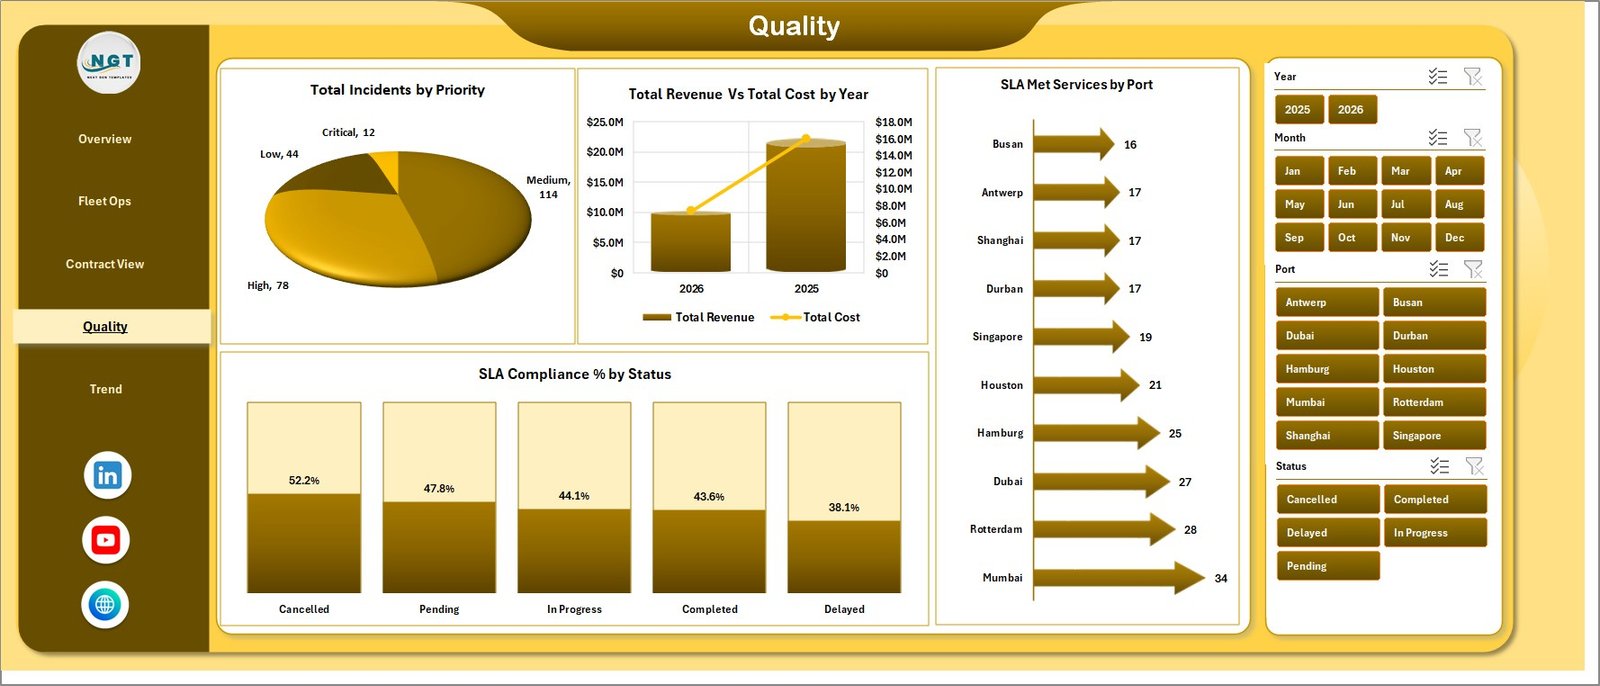
The Quality tab gives safety, service quality, SLA, and operational compliance teams a focused view of incidents, status, ports, and year-level cost and revenue movement. It is built for monthly review meetings and issue follow-up.
Total Incidents by Priority: Breaks incidents by severity or priority level. This helps teams see whether high-priority issues are increasing and where corrective action should start.
Total Revenue Vs Total Cost by Year: Compares annual revenue and cost movement. It helps leadership review longer-term financial direction for ship management services.
SLA Compliance % by Status: Shows SLA performance across service statuses. It helps identify whether open, delayed, completed, or other status groups are creating compliance risk.
SLA Met Services by Port: Compares successful SLA delivery across ports. Port managers can use it to review consistency and operational discipline.
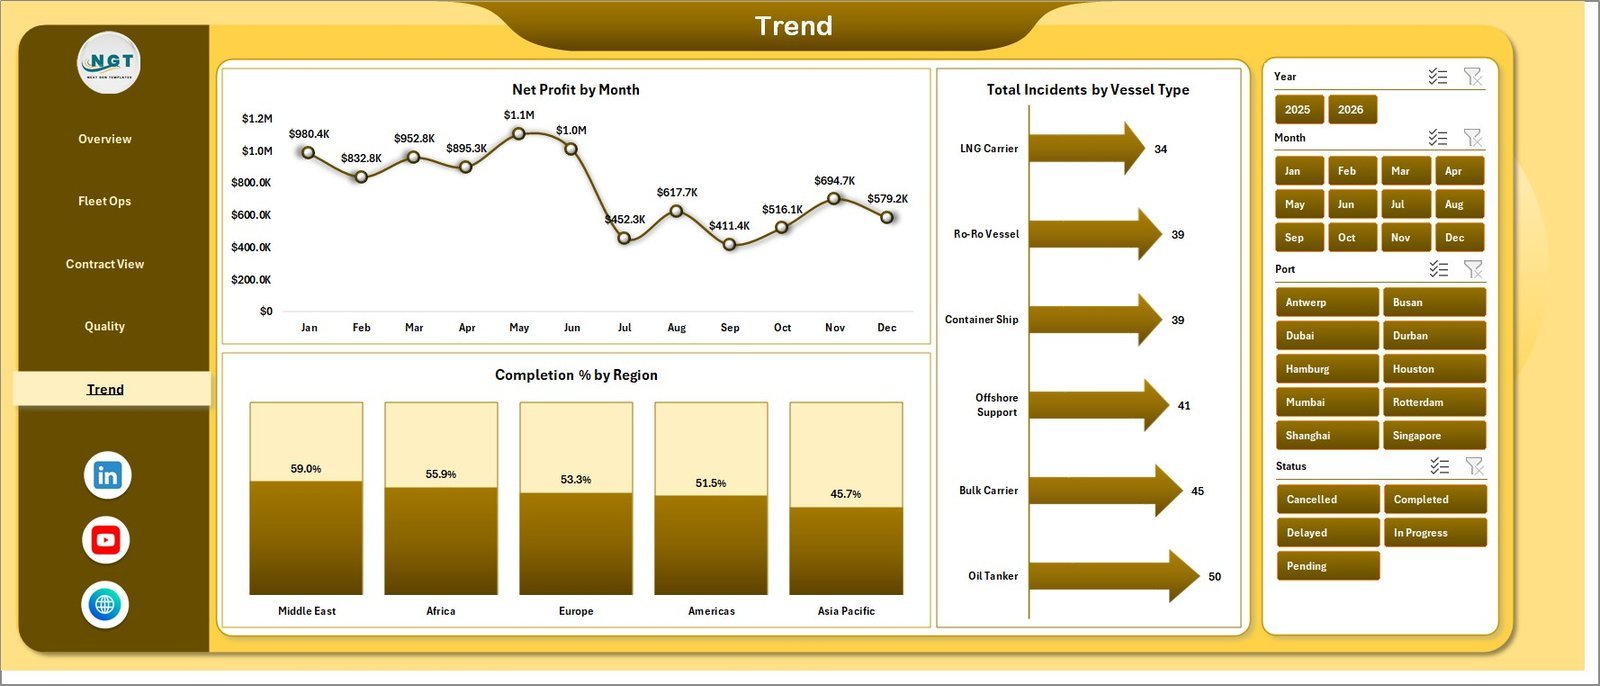
5 – Trend
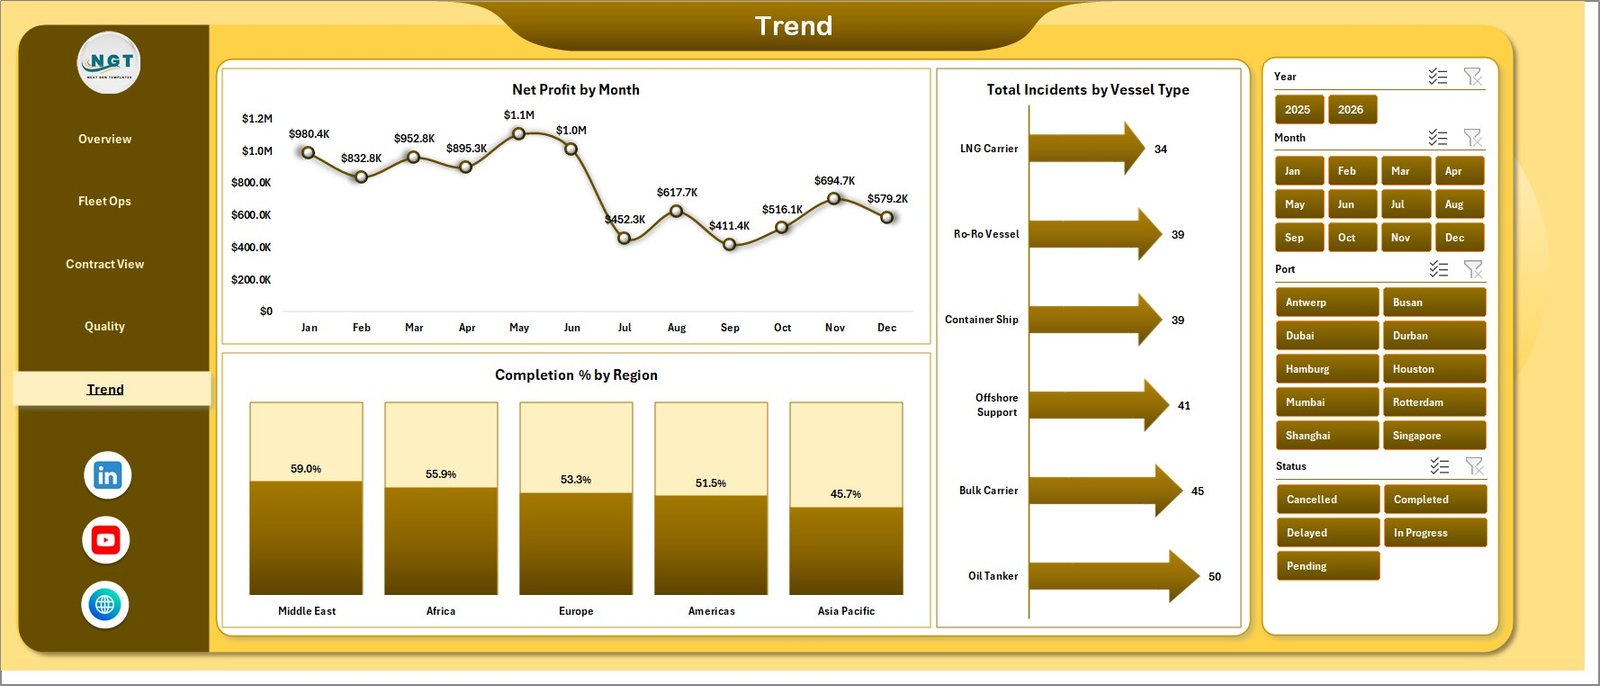
The Trend tab highlights time-based and comparative movement for profit, completion, and incidents. It is useful for leaders who want a simpler trend view after reviewing the detailed operational pages.
Net Profit by Month: Shows how profit changes month by month. This helps finance and operations teams see whether cost control and revenue growth are moving together.
Completion % by Region: Compares regional completion performance. It helps identify regions that are consistently finishing services on time and regions that may need support.
Total Incidents by Vessel Type: Breaks incident volume by vessel type. This view helps safety and operations teams identify vessel classes with higher risk or recurring service issues.
6 – Data Sheet Tab
The Data Sheet is where users add or replace records in the same column format as the sample data. Keeping the same headers and structure protects the slicers, pivots, cards, and charts across the workbook.

7 – Support Sheet
The Support Sheet contains the pivot tables used to drive the dashboard dynamically. After updating the Data Sheet, go to the Data tab in the Excel Ribbon and click Refresh All so the pivots and connected charts update. You can keep this sheet hidden for day-to-day use.

Ship Management Services Dashboard in Excel vs. Google Sheets vs. Paid Maritime SaaS – Where This Fits
| Feature | This Excel dashboard | Google Sheets alternative | Paid maritime SaaS |
|---|---|---|---|
| Cost | $17.99 one-time sale price | Template cost or build time | Monthly or annual subscription |
| Platform | Microsoft Excel desktop or web | Browser-based Sheets | Vendor-hosted platform |
| Setup time | Replace data and refresh | Copy file and configure sharing | Onboarding and implementation |
| Real-time team collaboration | Works best with OneDrive or SharePoint | Native collaboration | Usually included by plan |
| Mobile access | Excel mobile app or viewer | Google Sheets mobile app | Usually included |
| Customizable fields | Edit sheets, pivots, charts, and formulas | Edit sheets and formulas | Limited by vendor settings |
| Share with link | Yes, with Microsoft sharing setup | Yes, through Drive permissions | Usually login controlled |
| Year-1 cost at 5 users | $17.99 plus Excel licensing | Template plus Workspace cost if used | Often hundreds or thousands |
| Maritime service analysis | Ports, vessels, contracts, SLA, incidents, revenue, and cost | Depends on template design | Plan and module dependent |
Who This Template Is For – and Who It’s Not For
This template is for ship management service providers, fleet operations teams, port service coordinators, marine contract managers, quality teams, account managers, and finance analysts who track service records and need a clean Excel reporting layer.
It is not a live vessel tracking platform, ERP, CMMS, crewing system, AIS tool, dispatch system, or compliance filing system. Use it for reporting and analysis after operational service data is available.
How to Use the Ship Management Services Dashboard in Excel
- Download and unzip the Excel file after purchase.
- Open the workbook in Microsoft Excel.
- Go to the Data Sheet tab and replace the sample records using the same columns.
- Open the Data tab in the Excel Ribbon and click Refresh All.
- Review the Overview page first, then move through Fleet Ops, Contract View, Quality, and Trend.
- Use slicers to filter the dashboard by available dimensions such as month, region, port, vessel type, client, contract type, priority, status, or service category.
Real-World Use Cases
Arjun, fleet operations manager: reviews operating hours by port and completion by priority before weekly fleet service planning.
Maria, contract account lead: compares client revenue versus cost and profit margin by account manager before contract renewal discussions.
Kevin, marine quality supervisor: checks incidents by priority, inspection scores by category, and SLA met services by port during monthly quality review.
Frequently Asked Questions
What does this dashboard track?
It tracks revenue, cost, net profit, services, inspection score, incidents, SLA compliance, ports, regions, clients, vessel types, contract types, account managers, service categories, priorities, statuses, and monthly trends.
How many sheet tabs are included?
The workbook includes 7 tabs: Overview, Fleet Ops, Contract View, Quality, Trend, Data Sheet, and Support Sheet.
Can I replace the sample data?
Yes. Replace the sample rows in the Data Sheet tab using the same structure, then click Refresh All from Excel’s Data tab.
Does the dashboard use pivot tables?
Yes. The Support Sheet contains pivot tables that feed the dynamic cards and charts. You can keep this sheet hidden after setup.
Do I need advanced Excel skills?
No advanced modeling is required for normal use. You only need to replace data, refresh pivots, and use slicers. Users comfortable with Excel can customize the workbook further.
Is this a full ship management software system?
No. It is a reporting dashboard, not a live operational platform for crew, maintenance, compliance filing, dispatch, or vessel tracking.
About the Author
Built by PK – Microsoft Certified Professional with 15+ years of Excel, Google Sheets, and Power BI experience. Founder of NextGenTemplates, reaching 300K+ subscribers across YouTube channels. Every template is hand-built and tested before release.
Explore Related Templates
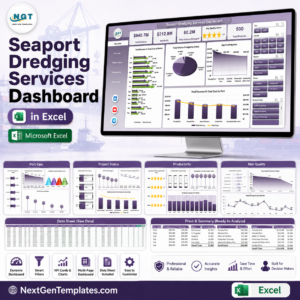
- Seaport Dredging Services Dashboard in Excel
- Seaport Dredging Services Dashboard in Power BI
- Port Tender Dashboard in Excel
- Trucking and Logistics Dashboard in Excel
- Browse MS Excel templates
- Browse Excel dashboard templates
Download the Ship Management Services Dashboard in Excel to monitor maritime service revenue, cost, profit, SLA compliance, incidents, inspection scores, ports, vessels, clients, and contracts in one refreshable workbook.
Last updated: August 10, 2026.






Reviews
There are no reviews yet.