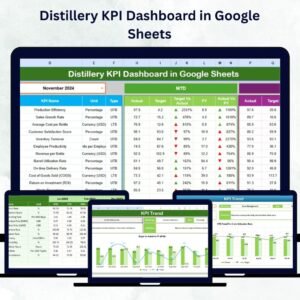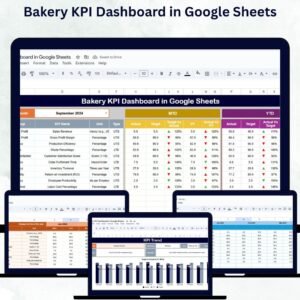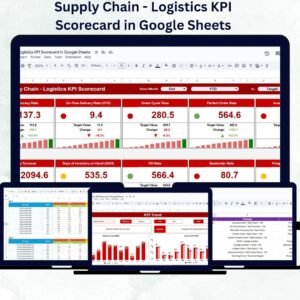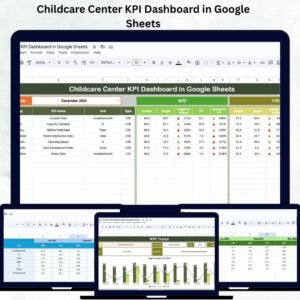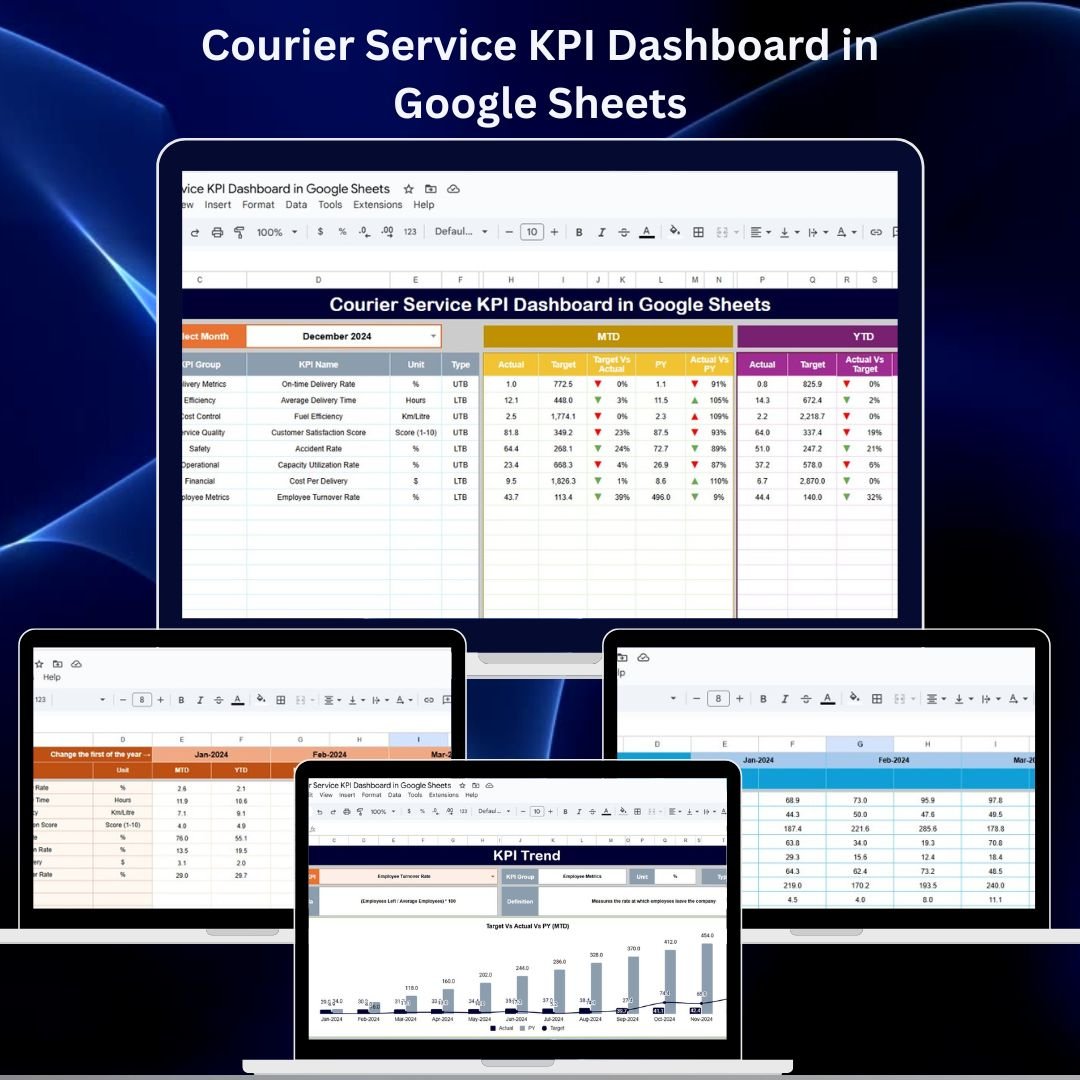
Managing courier operations requires real-time visibility into delivery performance, operational efficiency, and service quality. The Courier Service KPI Dashboard in Google Sheets is a ready-to-use and fully interactive template designed to help logistics teams and delivery managers track all key performance indicators (KPIs) in one centralized place.
From on-time delivery rates to delivery cost per order, this dashboard provides a complete overview of your courier performance through dynamic charts and automated comparisons. With Month-to-Date (MTD) and Year-to-Date (YTD) metrics, managers can easily monitor trends, compare actuals against targets, and make faster, data-driven decisions.
Whether you manage a regional delivery team or a full-scale courier company, this dashboard offers the insights you need to improve operational efficiency and enhance customer satisfaction.
🔑 Key Features of the Courier Service KPI Dashboard
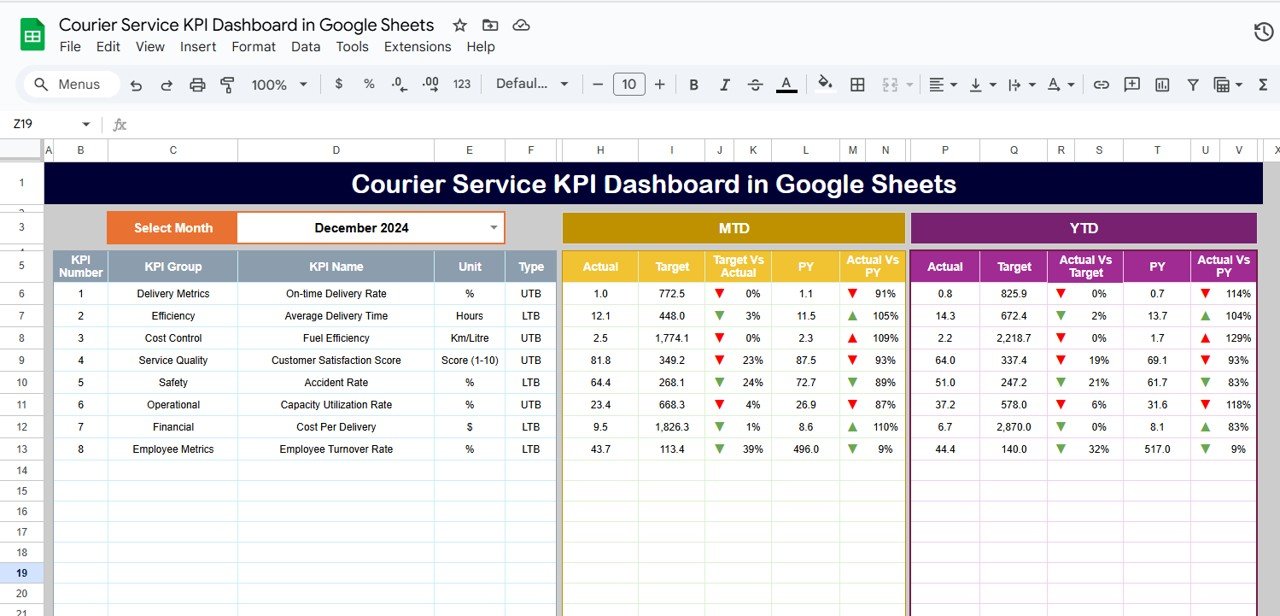
📌 Dashboard Sheet Tab – Real-Time Performance Overview
Month Selection (Range D3) for dynamic dashboard update
MTD & YTD Metrics – view Actuals, Targets, and Previous Year values
Comparisons – Target vs Actual and PY vs Actual with conditional arrows
Quickly identify areas performing above or below expectations.
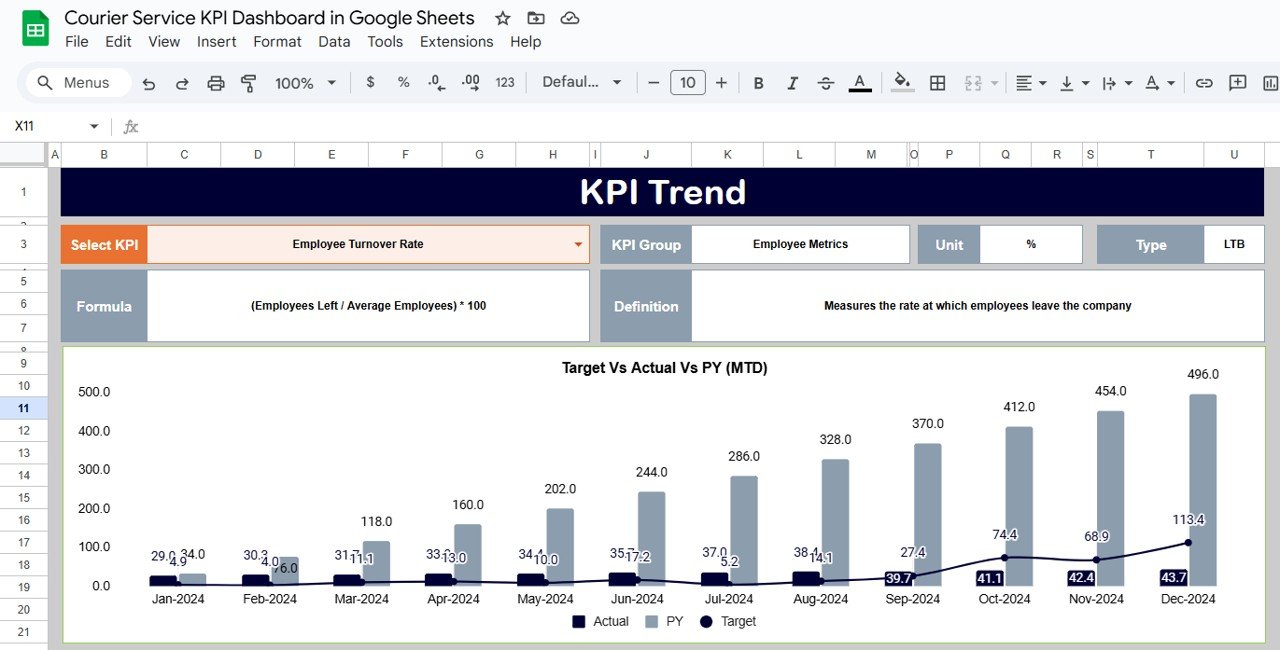
📌 KPI Trend Sheet Tab – Trend and KPI Insight
Select any KPI from a dropdown (Range C3)
Displays KPI Group, Unit, Formula, and Definition
Shows whether the KPI is Lower the Better (LTB) or Upper the Better (UTB)
Ideal for performance trend analysis and KPI understanding.
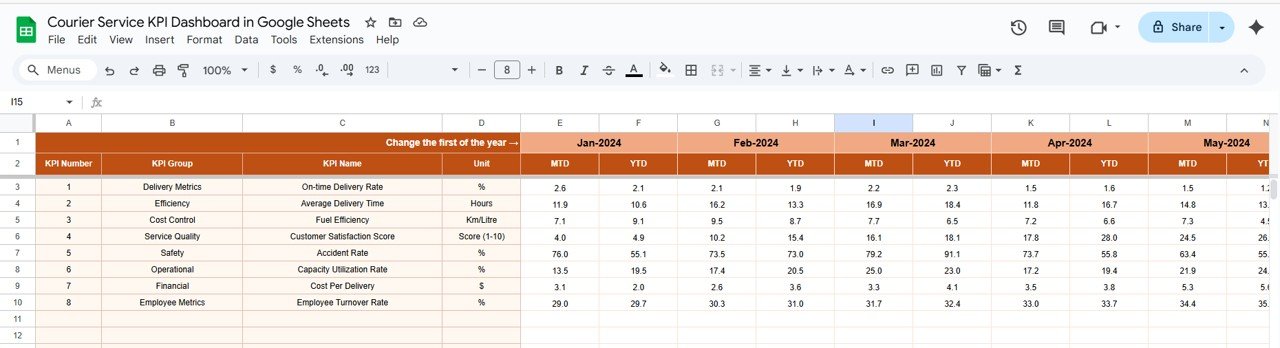
📌 Actual Numbers Sheet Tab – Operational Data Input
Enter monthly data for MTD and YTD
Automatically feeds into the dashboard
Supports fiscal year start month customization (Range E1)
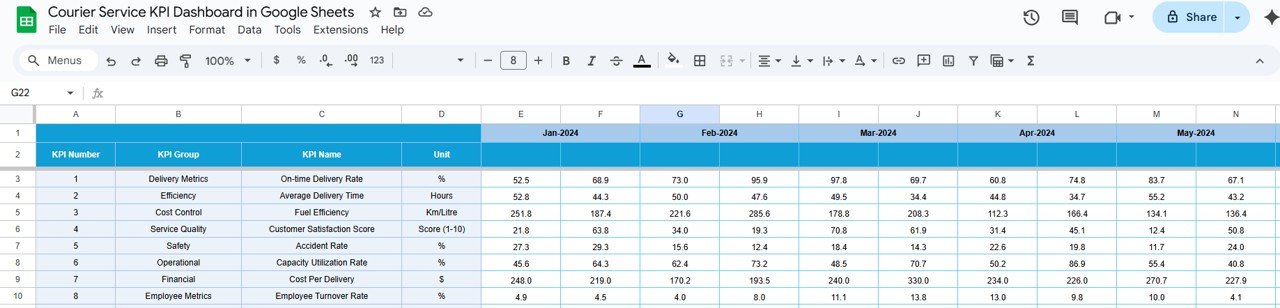
📌 Target Sheet Tab – Goal Tracking
Enter monthly and yearly targets per KPI
Compare targets versus actuals instantly in the dashboard
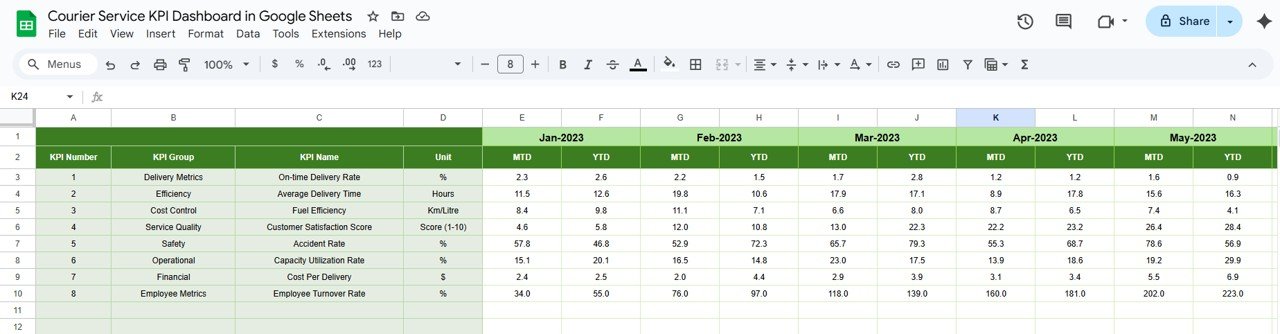
📌 Previous Year Numbers Sheet Tab – Historical Comparison
Store last year’s KPI values for monthly comparison
Enables effective year-over-year (YoY) performance monitoring
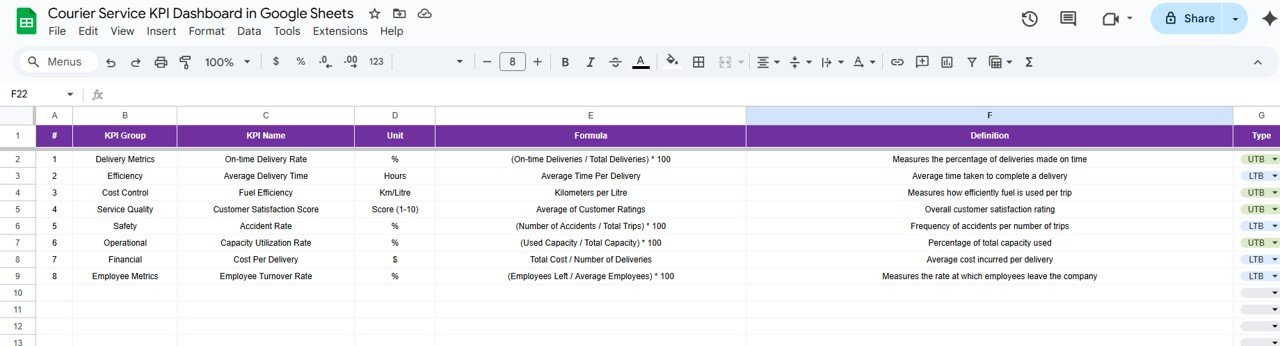
📌 KPI Definition Sheet Tab – Standardized KPI Reference
List of all KPI Names, Groups, Units, and Formulas
Provides clear KPI definitions
Ensures consistent understanding across the team
📦 What’s Inside the Courier Service KPI Dashboard?
✅ Dashboard Sheet – All KPIs in one view
✅ KPI Trend Sheet – Drill-down performance review
✅ Actual Numbers Sheet – Monthly performance data input
✅ Target Sheet – KPI target definitions
✅ Previous Year Sheet – Historical KPI values
✅ KPI Definition Sheet – KPI reference guide
✅ Pre-Formatted Charts & Logic – No setup required
🧠 How to Use the Dashboard
Copy the file to your Google Drive
Enter current performance data under Actual Numbers
Set goals in the Target Sheet
Add last year’s data to the Previous Year Sheet
Select a month on the Dashboard Sheet to view results
Use the KPI Trend Sheet for deeper performance analysis
👥 Who Can Benefit from This Dashboard?
🚚 Courier Service Managers – Monitor key KPIs in real time
📦 Logistics Professionals – Identify operational bottlenecks
📈 Business Analysts – Evaluate trends and performance variances
🏢 Executives – Track high-level delivery and service KPIs