


Struggling to track delivery performance, cut costs, or boost customer satisfaction in your courier business? 🚚📦 Say goodbye to messy spreadsheets and inconsistent reporting! The Courier Service KPI Dashboard in Power BI is your all-in-one solution to track, analyze, and improve courier service performance using powerful visualizations and automated insights.
Built for logistics and courier companies of all sizes, this ready-to-use Power BI dashboard template turns raw data into smart, action-oriented visuals that help you deliver faster, save more, and delight customers like never before.
✨ Key Features of Courier Service KPI Dashboard in Power BI
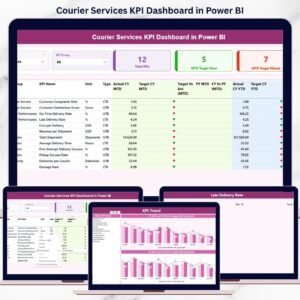
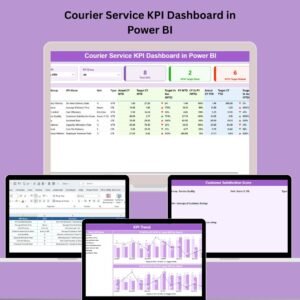
The Courier Service KPI Dashboard is intelligently designed with 3 interactive pages that streamline your operations and decision-making:
🔹 Summary Page

View MTD (Month-to-Date) and YTD (Year-to-Date) performance at a glance
Conditional icons (🔺 or 🔻) indicate performance against targets with green/red indicators
Quickly compare Current vs Previous Year performance
Auto-calculated metrics like “Target vs Actual” for instant analysis
Track top KPIs including delivery time, cost per delivery, on-time rate, customer satisfaction and more
🔹 KPI Trend Page
Dive deep into your KPIs over time using combo charts
Toggle between MTD and YTD data and compare against target and previous year
Use the KPI slicer to select and analyze individual KPIs with precision
🔹 KPI Definition Page
Understand the logic behind each KPI
Drill-through to view KPI formula, definition, type (LTB/UTB)
Ideal for internal teams, auditors, and strategic planners needing clarity
📦 What’s Inside the Courier Service KPI Dashboard Package?
You’ll receive a fully functional Power BI file with Excel integration for dynamic data updates:
Power BI File (.pbix) – Pre-built, interactive dashboard with slicers, icons, and visuals
Excel Data File (.xlsx) – Contains 3 editable sheets:
Input_Actual: Add actual performance data (MTD & YTD)Input_Target: Enter monthly/annual targets for each KPIKPI Definition: Define KPI name, unit, formula, and type
User Guide – Step-by-step PDF instructions for setup and usage
🚀 How to Use the Courier Service KPI Dashboard
📥 Open the Excel File and update actual and target numbers in the respective sheets
📊 Launch Power BI and connect to the Excel file (refresh when updated)
🔎 Use slicers to filter by KPI or view by MTD/YTD
📈 Analyze trends and take corrective action based on up/down arrows
🔁 Update weekly/monthly for real-time decision-making
This plug-and-play dashboard is designed to require zero coding knowledge—just your data and insights!
🎯 Who Can Benefit from This Dashboard?
Whether you’re a startup courier company or an enterprise logistics service provider, this dashboard can transform the way you operate. It’s ideal for:
Courier & Parcel Delivery Companies
Third-Party Logistics (3PL) Providers
E-Commerce Fulfillment Teams
Operations Managers & Analysts
Customer Experience Managers
Business Strategy Consultants
If your business thrives on timely deliveries and customer satisfaction, you NEED this dashboard! 🔍
👇 Click here to read the Detailed blog post
📺 Visit our YouTube channel to learn step-by-step video tutorials



























Reviews
There are no reviews yet.