


✅ Customer Onboarding Dashboard in Excel
Customer onboarding is a critical step in building strong and long-lasting business relationships. From the moment a new customer registers to the time they complete all onboarding activities, multiple departments need to work together to achieve a smooth experience. Without a central dashboard, this process can quickly become fragmented and hard to manage — causing delays, missed tasks, and poor satisfaction.
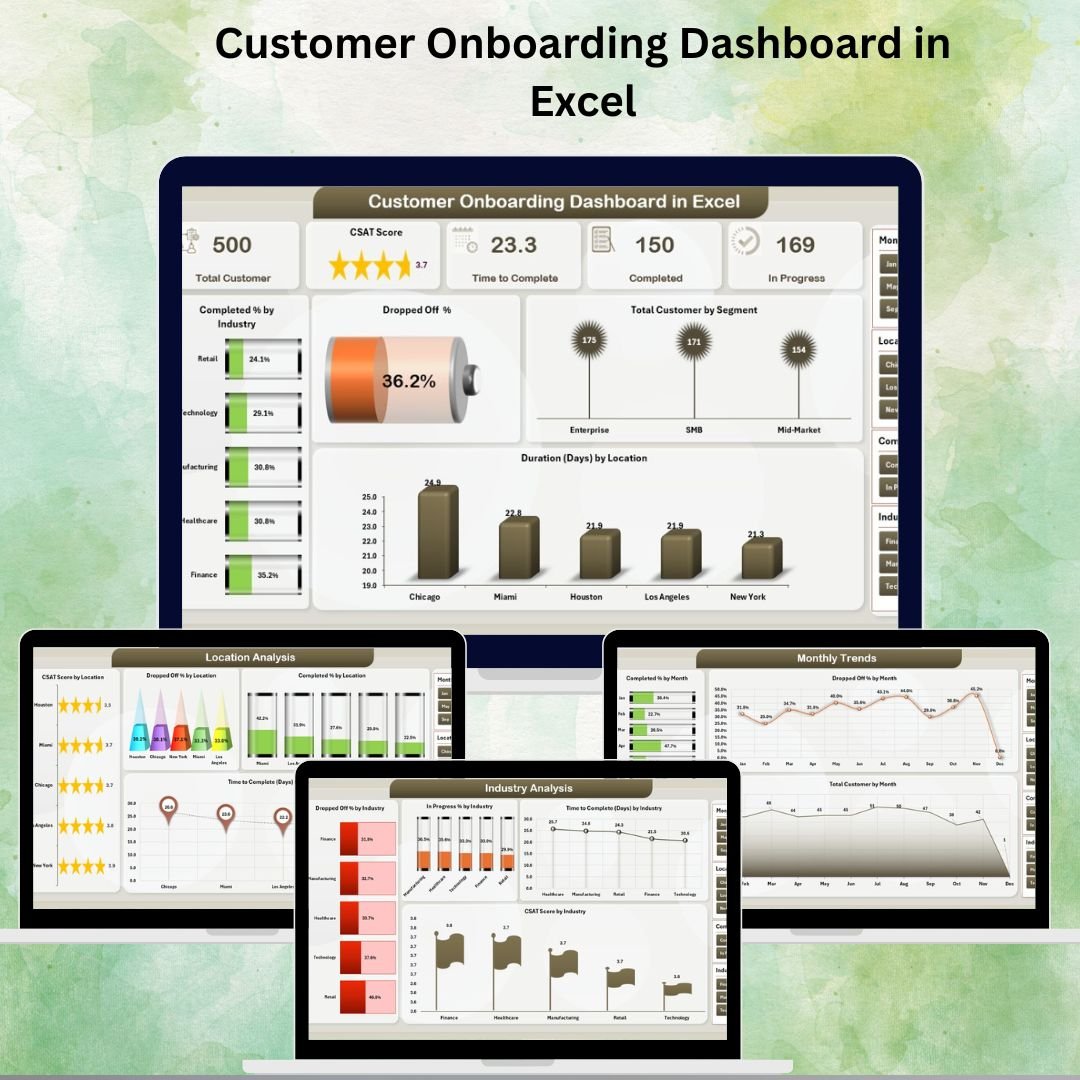
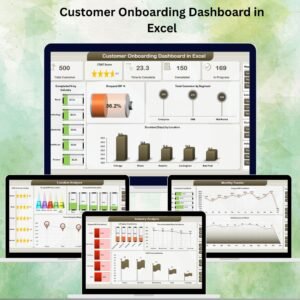
The Customer Onboarding Dashboard in Excel is a ready-to-use, highly visual template that helps you centralize onboarding performance data in one place. It transforms raw data into actionable insights, allowing you to track completion rates, dropped-off percentages, customer satisfaction (CSAT) scores, and task delays. Designed with 5 analytical pages, this dashboard gives leaders a clear overview and allows teams to drill down into specific areas (industry, location, stage, or month).
You don’t need any coding or expensive BI tools — everything works inside Excel using pivot tables, charts, slicers, and conditional formatting.
✨ Key Features of the Customer Onboarding Dashboard in Excel
✅ Overview Page – High-Level Snapshot
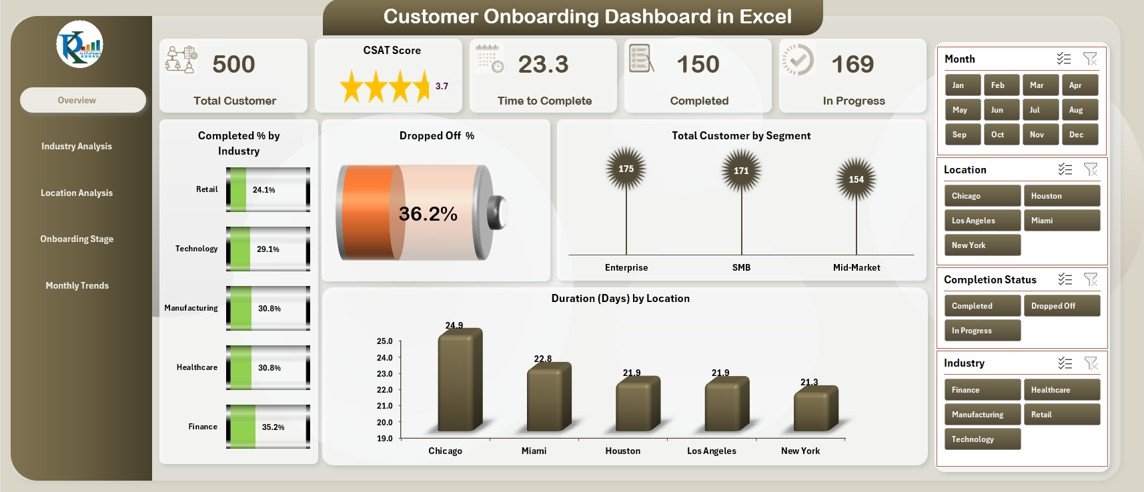
KPI Cards such as Completed %, Delayed %, High Urgency %, CSAT %, Completion % by Department and Industry
Visuals for Dropped Off %, Total Customers by Segment, and Duration by Location
Slicers on the right-hand side for quick filtering (e.g., Month, Segment)
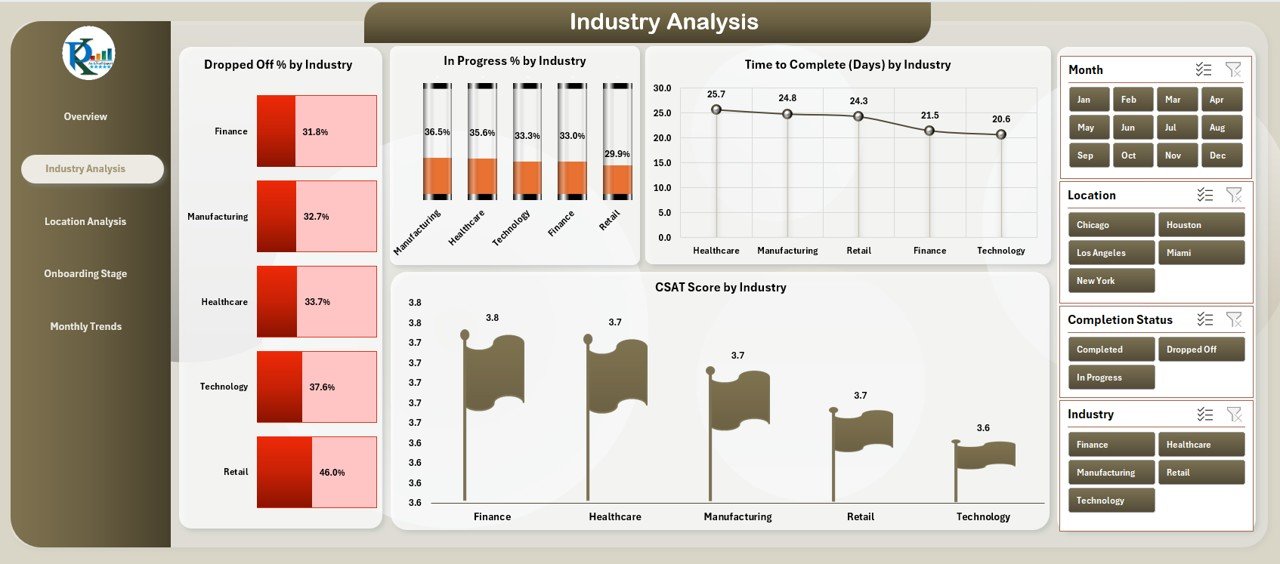
✅ Industry Analysis Page
Dropped Off % by Industry
In Progress % by Industry
Time to Complete (Days) by Industry
CSAT Score by Industry
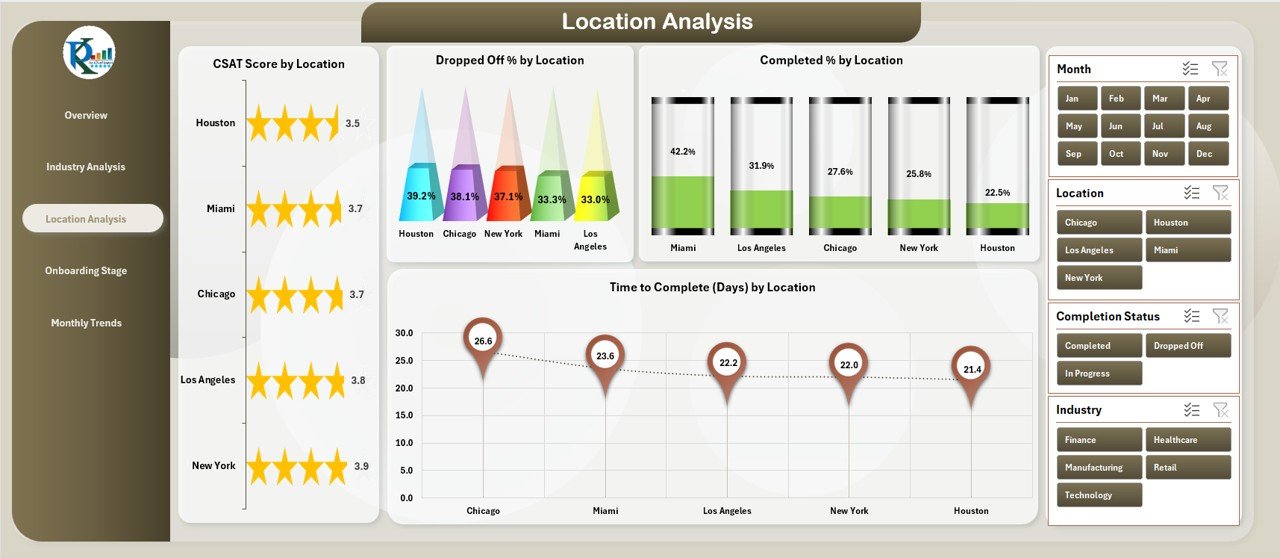
✅ Location Analysis Page
Regional performance view with CSAT, Dropped Off %, Completed %, and Time to Complete by Location
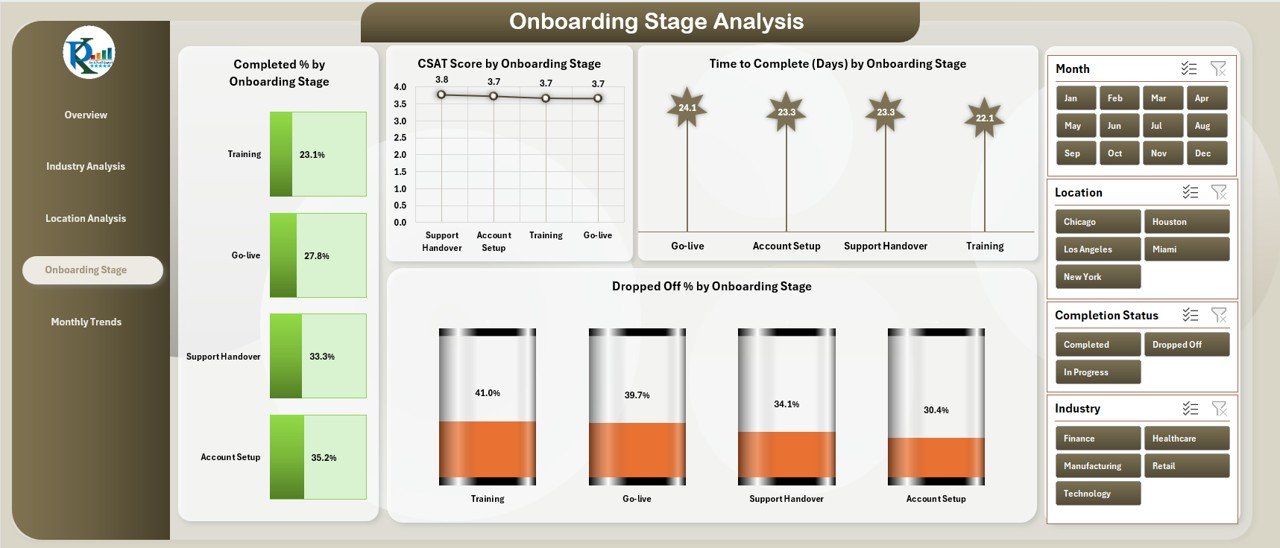
✅ Onboarding Stage Analysis Page
Completed % by Stage
Dropped Off % by Stage
Time to Complete by Stage
CSAT Score by Stage
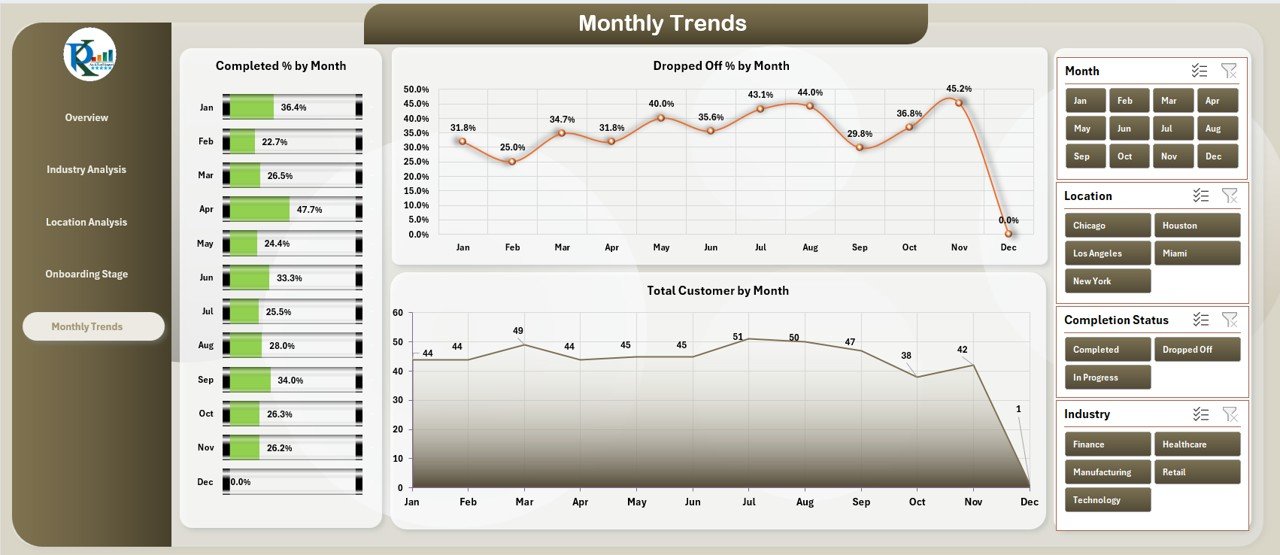
✅ Monthly Trends Page
Time-series charts of Completed %, Dropped Off %, and Total Customers per month
Identify seasonality and performance shifts quickly
🛠 How to Use the Customer Onboarding Dashboard
Organize Your Data in a clean table with fields like Customer Name, Industry, Location, Stage, CSAT, Start Date, End Date.
Insert Pivot Tables & Charts to summarize data into KPIs.
Create Dashboard Pages (Overview, Industry, Location, Stage, Monthly Trends).
Add Slicers (Month, Segment, Department) to make the dashboard interactive.
Apply Conditional Formatting to highlight delays and urgent tasks.
Review & Update Data Regularly to keep insights accurate.
🎯 Who Can Benefit from This Dashboard
📞 Customer Success Teams – Track onboarding progress and identify customers needing support
🧑💼 Operations & Process Managers – Monitor workloads and optimize onboarding processes
📈 Executive Management – Get a real-time overview of onboarding health and CSAT performance
🧠 Data & Insight Analysts – Drill down into patterns by industry, region, or stage
🚀 Key Benefits
Full Visibility of onboarding progress in one dashboard
Early Detection of Delays & Drop-Offs
Improved Customer Satisfaction through faster follow-up
Better Resource Allocation across departments or regions
Data-Driven Decisions instead of assumptions
100% Customizable – No code, no license required
📖 Click here to read the Detailed blog post
Visit our YouTube channel to learn step-by-step video tutorials
Watch the step-by-step video tutorial:
Compatibility and Requirements
- Works in Microsoft Excel desktop (Excel 2016 or later, or Microsoft 365).
- Microsoft’s guide Use slicers to filter data explains the Excel feature this file is built on.
Frequently Asked Questions
Which pages are in the Customer Onboarding Dashboard?
Five: Overview, Industry Analysis, Location Analysis, Onboarding Stage Analysis and Monthly Trends.
Which KPIs does the Overview page show?
Completed %, Delayed %, High Urgency %, CSAT %, and completion by department and industry, plus Dropped Off % and duration by location.
How do I filter the dashboard?
Use the slicers on the right-hand side, such as Month and Segment.
Which data fields do I need?
Customer Name, Industry, Location, Stage, CSAT, Start Date and End Date, kept in a clean table.
Related Customer Success Templates
- Customer Onboarding Effectiveness Dashboard in Google Sheets: onboarding results in the browser
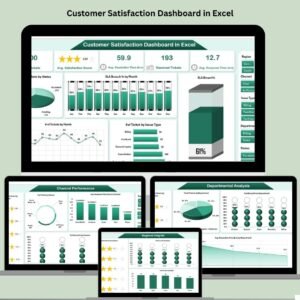
- Customer Satisfaction Dashboard in Excel: follow CSAT after onboarding
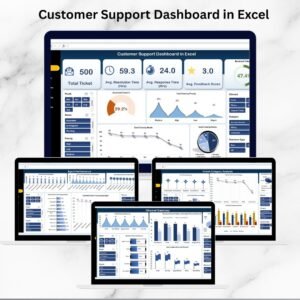
- Customer Support Dashboard in Excel: support tickets for new customers
- Customer Demographics KPI Dashboard in Excel: understand who your customers are
Browse all Excel dashboards or the Sales and Marketing templates.





























Reviews
There are no reviews yet.