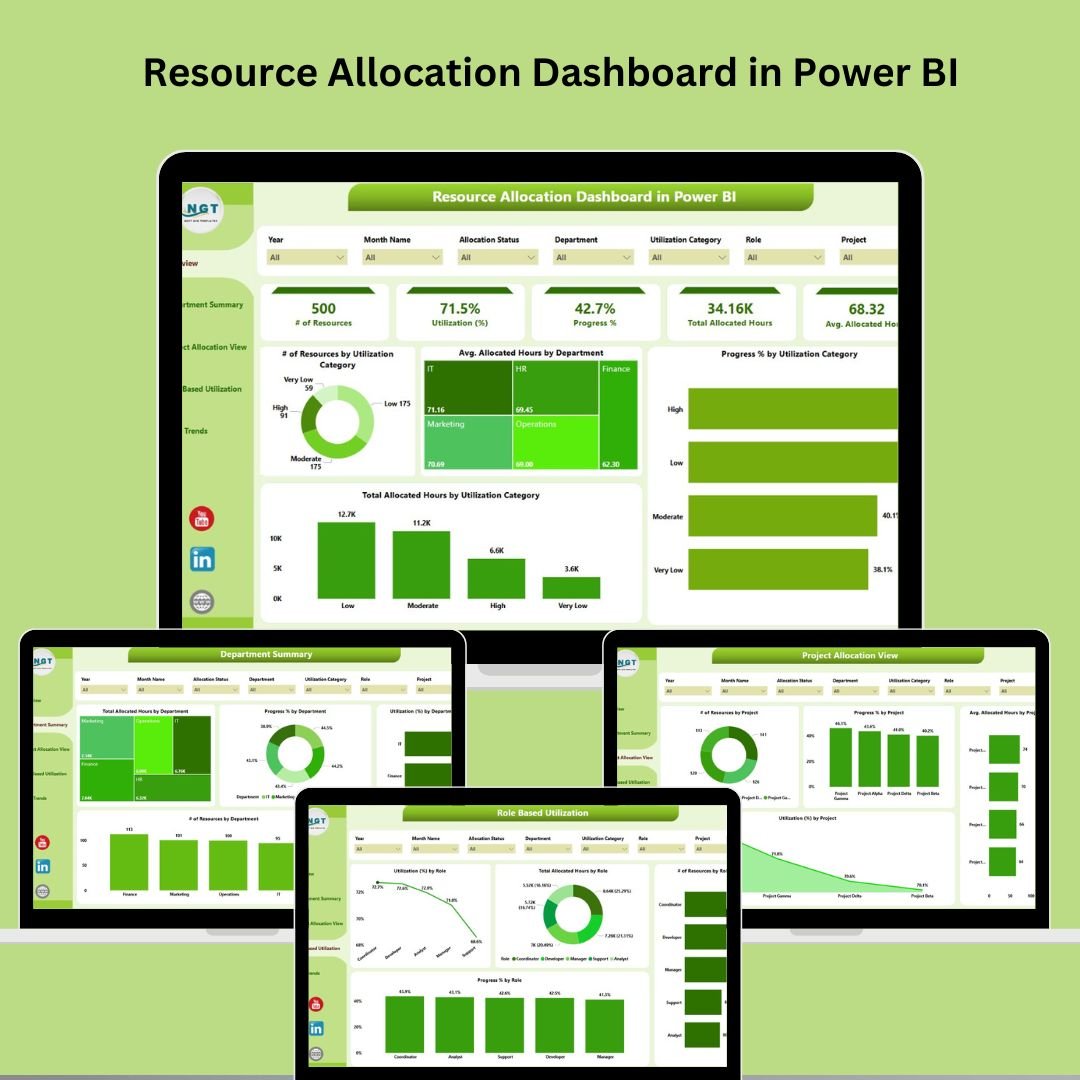

Resource Allocation Dashboard in Power BI

Power BI - instant download

Original price was: ₹2,499.00.Current price is: ₹1,799.00.
Details, requirements and demo below
Sale!

Resource Allocation Dashboard in Power BI

Original price was: ₹2,499.00.Current price is: ₹1,799.00.

Take control of your workforce with this dynamic Power BI dashboard! 🧠📊 Track and optimize every hour, role, and resource:

🧭 5 Detailed Pages – Overview, Department, Projects, Roles & Time Trends
📊 Live KPIs – Utilization %, Progress %, Allocated Hours
🔄 7 Slicers/Page – Filter by project, department, role, or time
📈 Trend Analysis – Forecast staffing needs with monthly views
👥 Role Insights – Identify underused or overworked job types
🧮 Department Metrics – Compare productivity and allocation
⚙️ Fully Customizable – Add visuals, apply brand themes
🔌 Connects to Excel, SQL, Google Sheets
📤 Easy to Share – Publish to Power BI Service
💡 Beginner-Friendly – Built for non-technical users too!

Customize this template for your business (optional)

Handled by email: we contact you within 1 business day. One revision round included. What is included

- +
Have your own data? Build a dashboard from your Excel, CSV or Google Sheets file free in Dashboard Studio →

💡 Buy any 2 templates and save 20% automatically at checkout.

Included in All-Access Templates. Get this plus 7,000+ templates for ₹4,999.00 a year. Compare plans →
Pricing country
Prices follow your selected country; checkout uses your billing country.
Power BI: Raw Data to Professional Business Dashboards courseLaunch offer
🎓 NEXTGENTEMPLATES ACADEMY
Like this Power BI dashboard? Learn to build your own.
Power BI: Raw Data to Professional Business Dashboards

Power Query, data modeling, DAX, time intelligence and dashboard design, from messy raw files to an executive dashboard. 9h 19m of video by PK, with practice files, quizzes and a capstone.

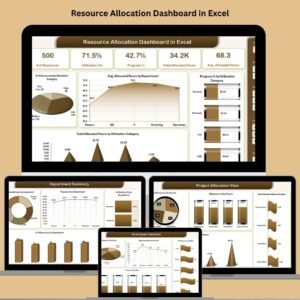
Managing people, projects, and departments across multiple teams? The Resource Allocation Dashboard in Power BI is your secret weapon for achieving smarter staffing, better planning, and higher productivity—all through intuitive, real-time visual analytics. 🚀

This ready-to-use Power BI dashboard empowers project managers, HR teams, and operations leaders with everything they need to allocate, track, and optimize resources in just a few clicks.


🔧 Key Features of the Resource Allocation Dashboard

🧭 5 Interactive Pages for 360° Resource Visibility

Overview Page
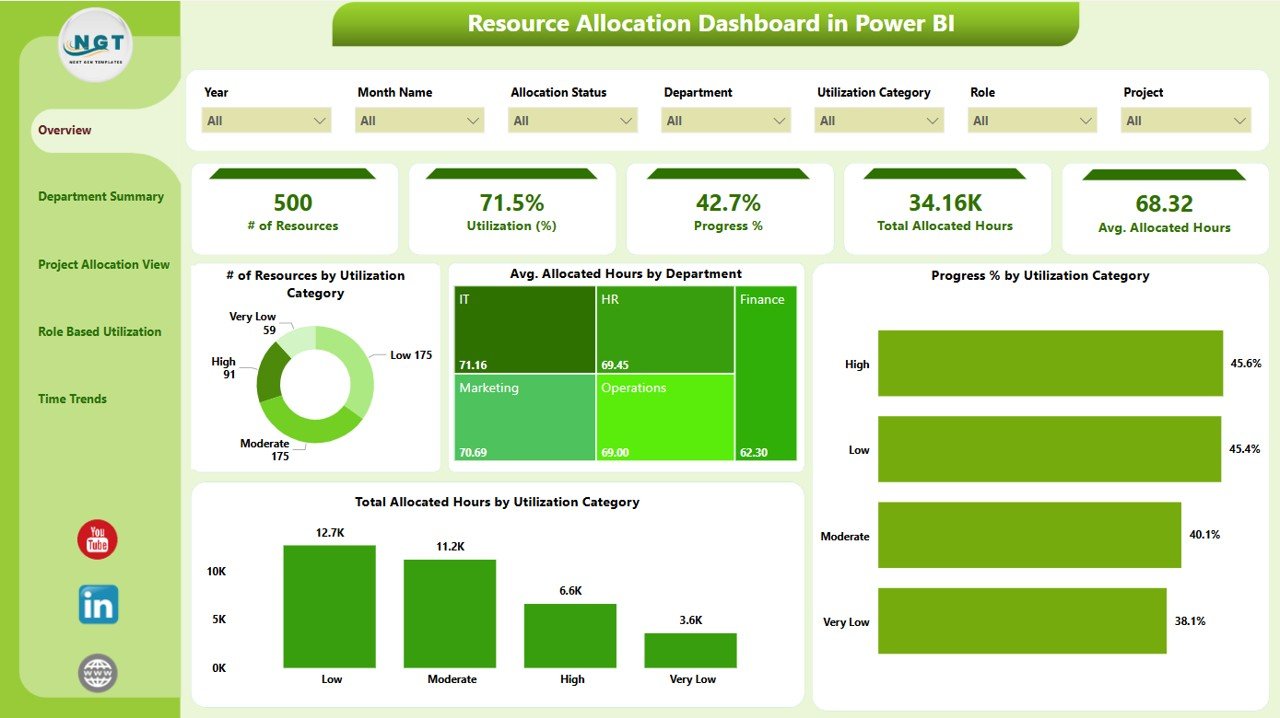
Resource Allocation Dashboard
    • KPIs: Total Resources, Avg. Utilization %, Total Allocated Hours

    • Charts: Resources by Utilization Category, Hours by Department, and more

    • Filters: 7 slicers for instant drilldowns

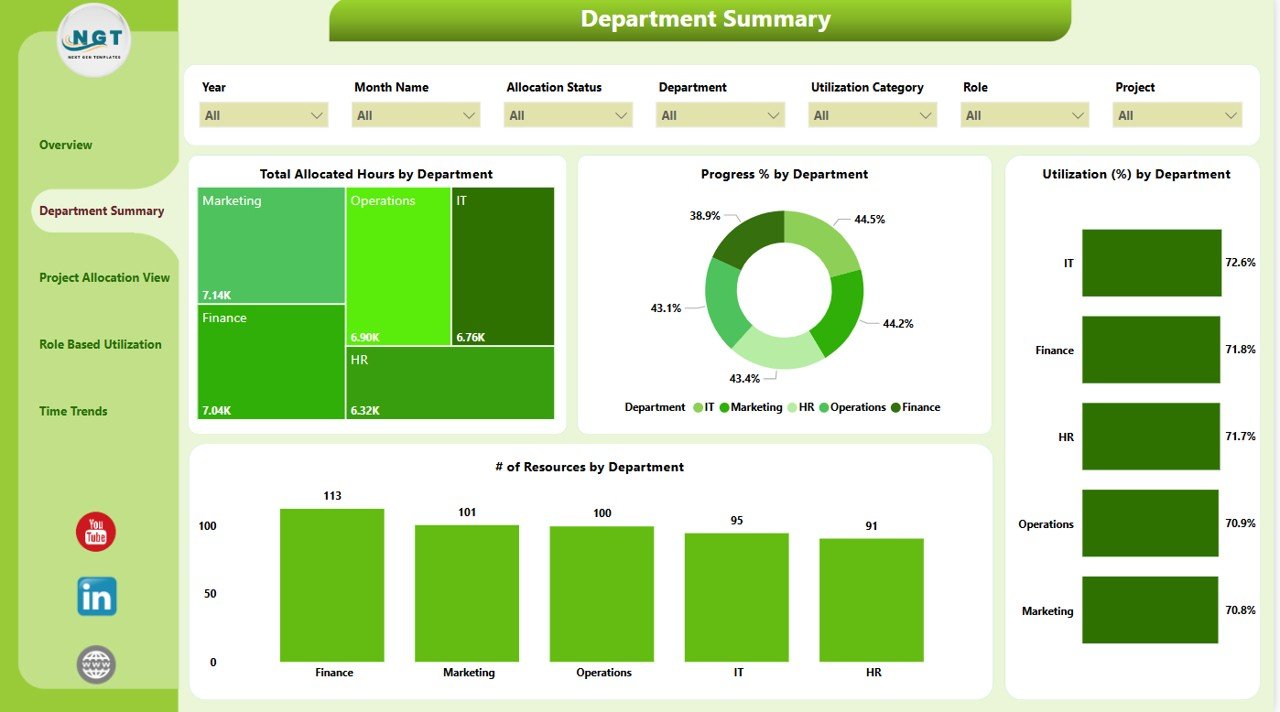
  1. Department Summary

    • Compare resource use across departments

    • Visuals: Utilization %, Progress %, and Hours by Department

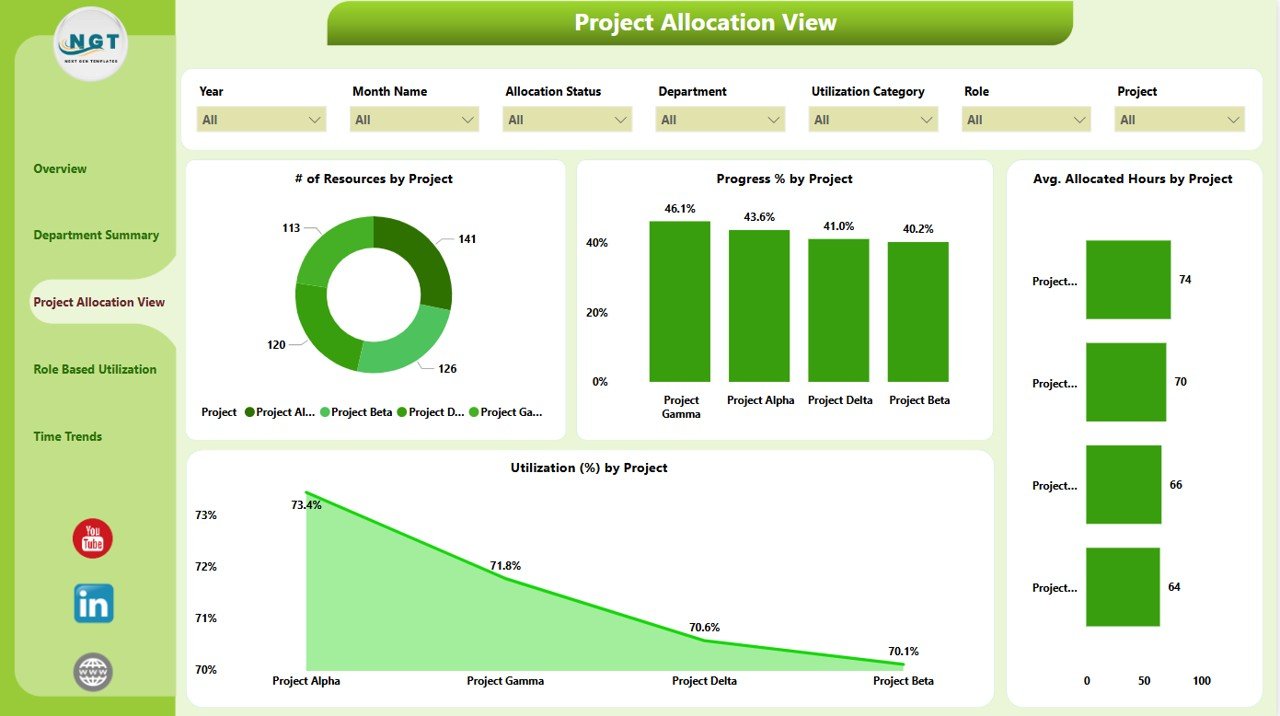
  2. Project Allocation View

    • Track how resources are spread across projects

    • Monitor Average Hours, Resource Count, and Utilization % per project

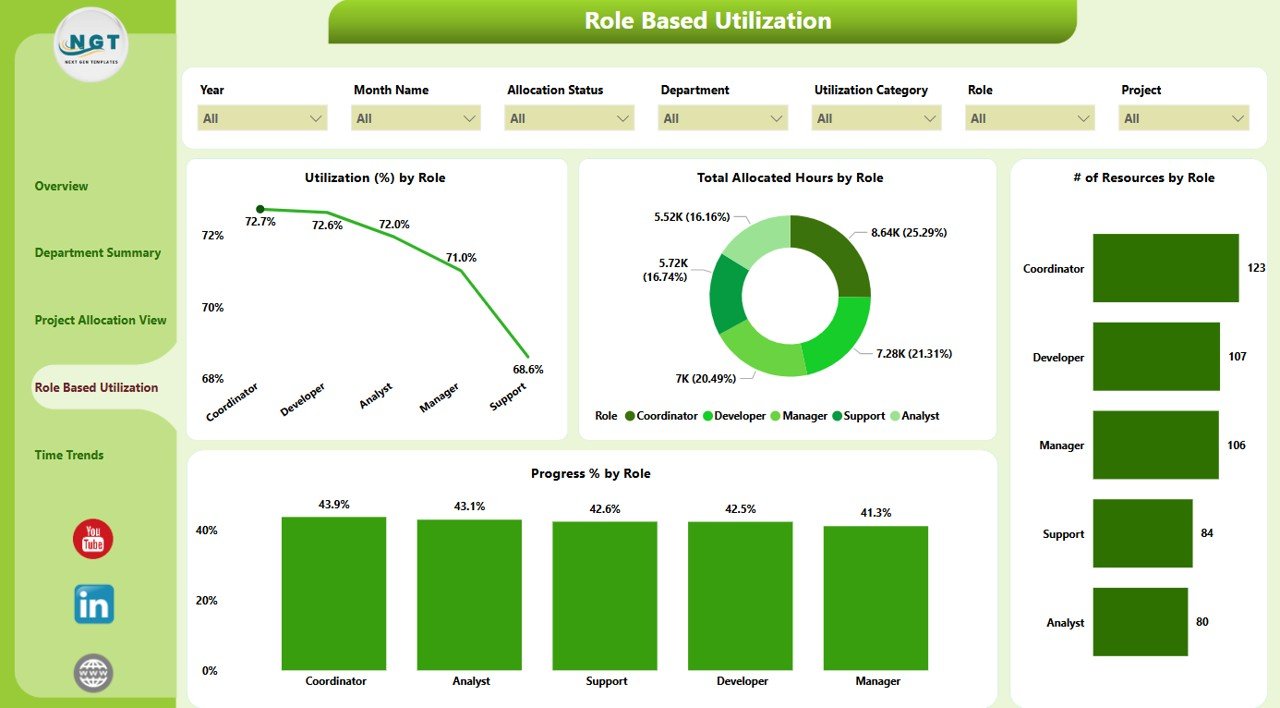
  3. Role-Based Utilization

    • Understand how different roles perform

    • Find skill gaps or overused job functions using role-specific metrics

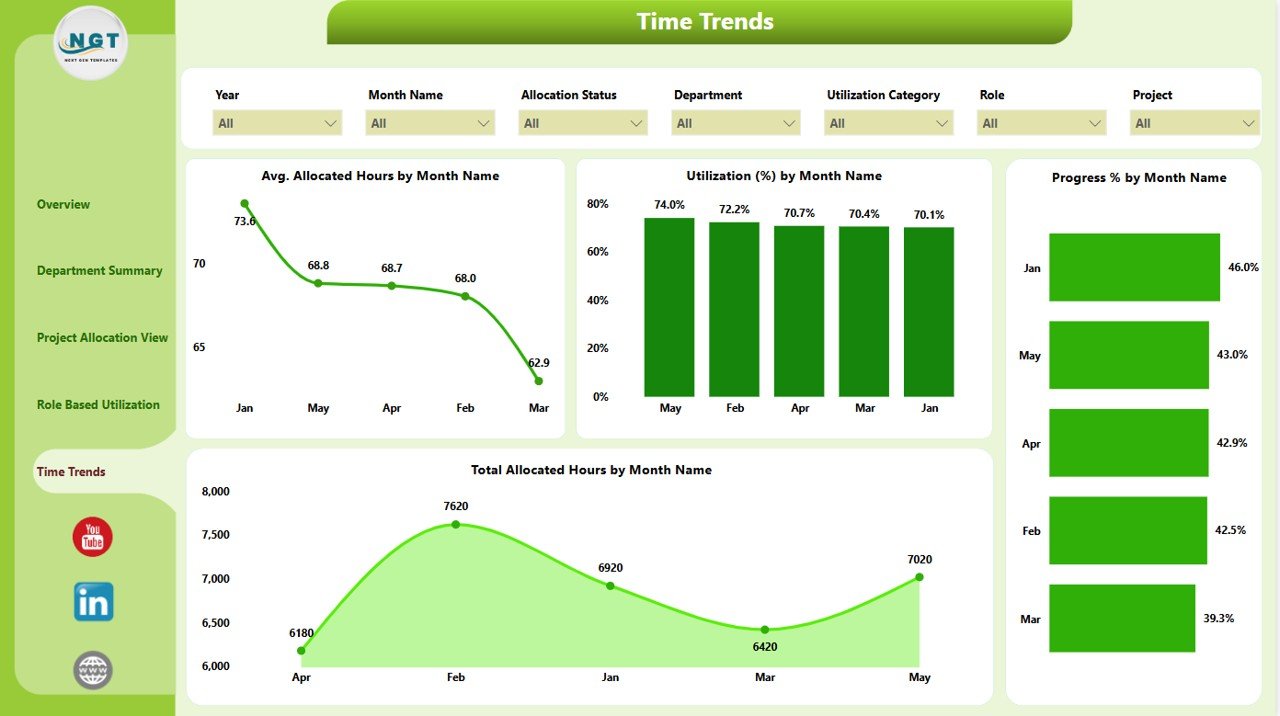
  4. Time Trends

    • Spot seasonal patterns in resource use

    • Visualize Monthly Allocated Hours, Utilization %, and Progress %


📂 What’s Inside the Dashboard

Here’s what’s included in your download:

✅ A fully functional Power BI (.pbix) file
✅ 5 linked dashboard pages with dynamic filters
✅ Prebuilt charts, KPI cards, and slicers
✅ Sample data for learning and testing
✅ Clean layout and customizable design
✅ Support for Excel, SQL, and other data source connections
✅ Ready for publishing to Power BI Service or sharing internally


🛠️ How to Use the Resource Allocation Dashboard

🧾 Step 1: Connect Your Data
Import Excel or database files with fields like Resource Name, Project, Hours, Role, Department, and Utilization %.

🧮 Step 2: Review Metrics
Check KPIs like Total Allocated Hours, Utilization %, and Progress in the Overview tab.

📅 Step 3: Use Slicers
Filter views by role, time period, department, project, and more using 7 slicers per page.

📉 Step 4: Spot Bottlenecks
Identify overloaded teams or idle resources. Reassign or balance workloads accordingly.

🎨 Step 5: Customize as Needed
Add visuals, tweak colors, or modify formulas to align with your business KPIs.

📤 Step 6: Share with Teams
Publish to Power BI Service for team-wide access with role-level security.


👥 Who Can Benefit from This Dashboard?

This tool is perfect for:

👷 Project Managers – Allocate team members efficiently
💼 HR Professionals – Track talent utilization and identify gaps
🧠 Operations Leaders – Make strategic staffing decisions
💻 IT Departments – Manage sprints and technical resource planning
🧾 Consulting Firms – Monitor billable vs non-billable hours

Whether you run a small agile team or a global enterprise, this dashboard delivers clarity and control over your most valuable asset—your people.


✅ Click here to read the Detailed blog post

🔗 Visit our YouTube channel to learn step-by-step video tutorials


Watch the step-by-step video tutorial:

Compatibility and Requirements

  • Opens in Power BI Desktop, which is free to download from Microsoft.
  • The download is a .pbix file with sample data. Connect Excel, SQL or other data sources, and publish to the Power BI Service if you want to share it.
  • Get it from Microsoft: Get Power BI Desktop.

Frequently Asked Questions

What pages does the dashboard include?

Five pages: Overview, Department Summary, Project Allocation View, Role-Based Utilization and Time Trends.

Which KPIs does it show?

Total resources, average utilization %, total allocated hours and progress %.

How many slicers are there?

Seven slicers on each page filter by role, time period, department, project and more.

Which data fields do I need?

Fields such as Resource Name, Project, Hours, Role, Department and Utilization %.

Related Resource Planning Templates

Browse all Power BI dashboards or the Excel project management templates.

Frequently asked questions

What do I need to open it?
Power BI Desktop, which is free from Microsoft (Windows). No Power BI Pro licence is needed to open, edit or refresh the file.
Does it work on Mac?
Power BI Desktop runs on Windows only. On a Mac you can use a Windows virtual machine, or publish the report to the Power BI Service and view it in a browser.
What is in the download?
The .pbix report and the Excel data file that feeds it (newer products also include a PDF user manual).
How do I use my own data?
Paste your data over the sample rows in the Excel file (keep the column headers), then click Home > Refresh in Power BI Desktop. To use a different file, use Transform data to point the source to it.
Do I need Power BI Pro?
Only if you want to publish the report to the Power BI Service and share it online with colleagues. Opening and editing on your PC is free.
Can I edit the visuals?
Yes - every page, visual, measure and colour is editable in Power BI Desktop.
Is it a one-time payment or a subscription?
One-time payment. No subscription, no per-user fees and nothing to renew - the file is yours to keep.
How do I get the file after payment?
Instantly. The download link appears on screen after checkout, is emailed to you, and stays under My Account > Downloads on our website. If the email does not arrive within a few minutes, check your spam or promotions folder.
Is a user manual included?
Most of our newer products include a PDF user manual in the download. If yours does not have one, message us with your order number and we will send it.
Do I get free updates?
Bug fixes are always free - if something does not work as described, we fix it and send you the corrected file. New versions with new features are not included in the price, unless this product's description says otherwise.
Can you customise it for me?
Yes. Small changes to this template (your columns, categories, logo, colours, minor layout) cost the template price plus $40-80 (Rs 3,000-6,000 + GST), quoted once you send your list. A fully custom build is usually $100-200 (Rs 8,000-18,000 + GST) with two revision rounds. Email your requirements to [email protected] or message us on WhatsApp.
Can I use it for my business or my clients?
Yes, for your own personal or internal business use, for as long as you like. Reselling or redistributing the template is not allowed.
What is your refund policy?
Because these are digital downloads, they are non-refundable once delivered - except when the product does not match its description (report it within 48 hours of purchase) or there is a technical problem our team cannot fix within 72 hours. Email [email protected] with your order number.
How do I get help?
Email [email protected] (Mon-Fri, 10 AM-7 PM IST) or message us on WhatsApp +91 80770 90260 (chat only, no calls). Please include your order number.

Still have a question? Click Need help? at the bottom-left to ask our assistant, or message us on WhatsApp.

Application

Power BI

Template Type

Dashboard

Price

Paid

Business Or Department

HR and Payroll

Reviews

There are no reviews yet.

Only logged in customers who have purchased this product may leave a review.

You may also like…

Resource Allocation Dashboard in Power BIResource Allocation Dashboard in Power BI
Original price was: ₹2,499.00.Current price is: ₹1,799.00.
- +
Have your own data? Build a dashboard from your Excel, CSV or Google Sheets file free in Dashboard Studio →
Scroll to Top