

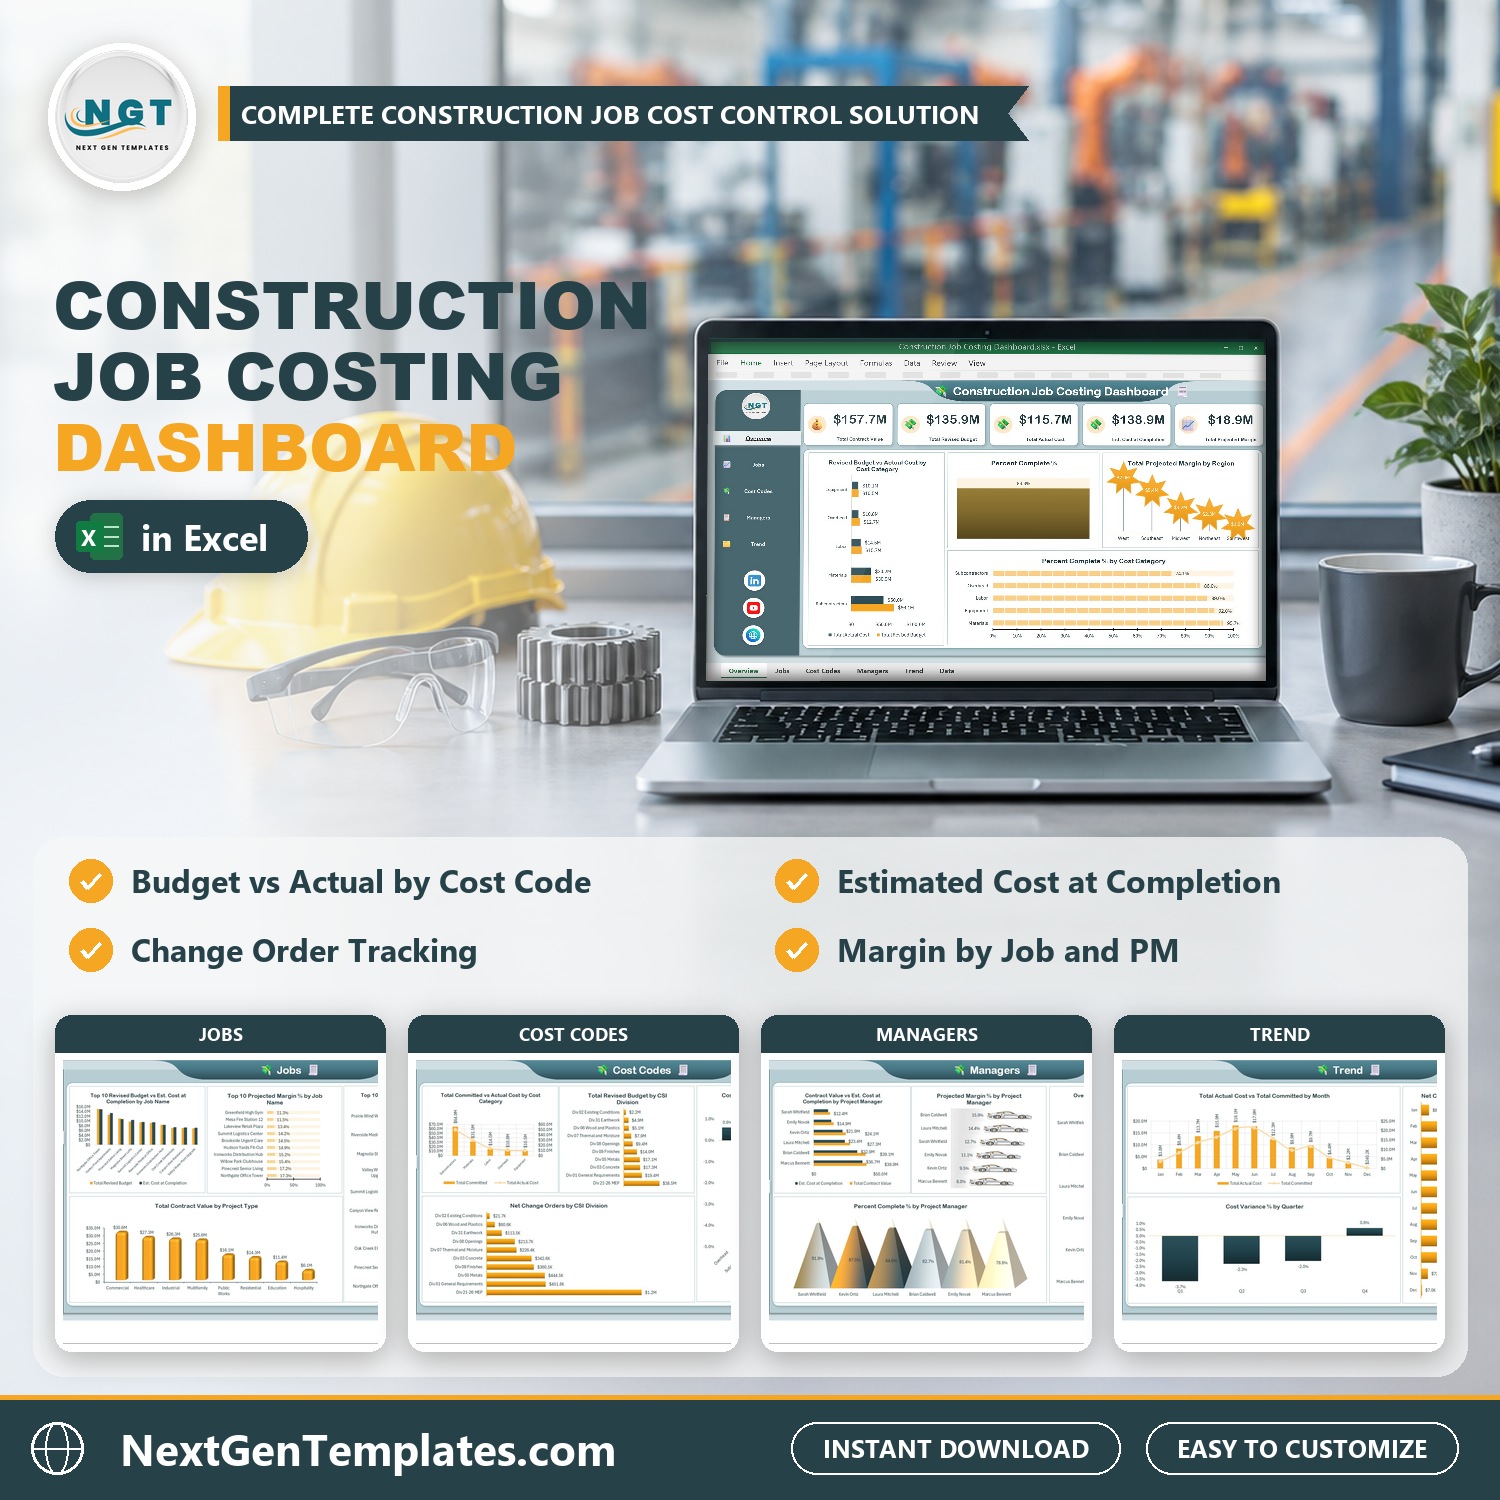

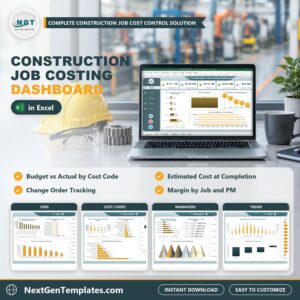
Know whether every job is making money before the job closes. The Construction Job Costing Dashboard in Excel turns a list of work packages into five clickable pages that show, job by job and cost code by cost code, what you budgeted, what you have committed, what you have actually spent, what each job will cost at completion and how much margin you will keep. Add your work packages on the Data tab, click Refresh All, and every card and chart updates. It uses no macros and no add-ins.
🌍 Join 10,000+ customers in 180+ countries using NextGenTemplates to replace paid SaaS tools with one-time-purchase Excel, Google Sheets, Power BI and HTML templates.
✅ Instant download · One-time payment · No subscription · No per-user fees · Lifetime access
Watch the Construction Job Costing Dashboard in Excel walkthrough
Good to know: this is an add-data-and-refresh workbook, not a live connector to your accounting or ERP software. It is built for desktop Excel on Windows (Excel 2016 or later, or Microsoft 365). The sample data is fictional.
🔑 Key Features of the Construction Job Costing Dashboard
📌 A construction job costing dashboard in one workbook. If your job costing template Excel file is a pile of tabs that only one person understands, this replaces it with five pages that anyone on the team can read.
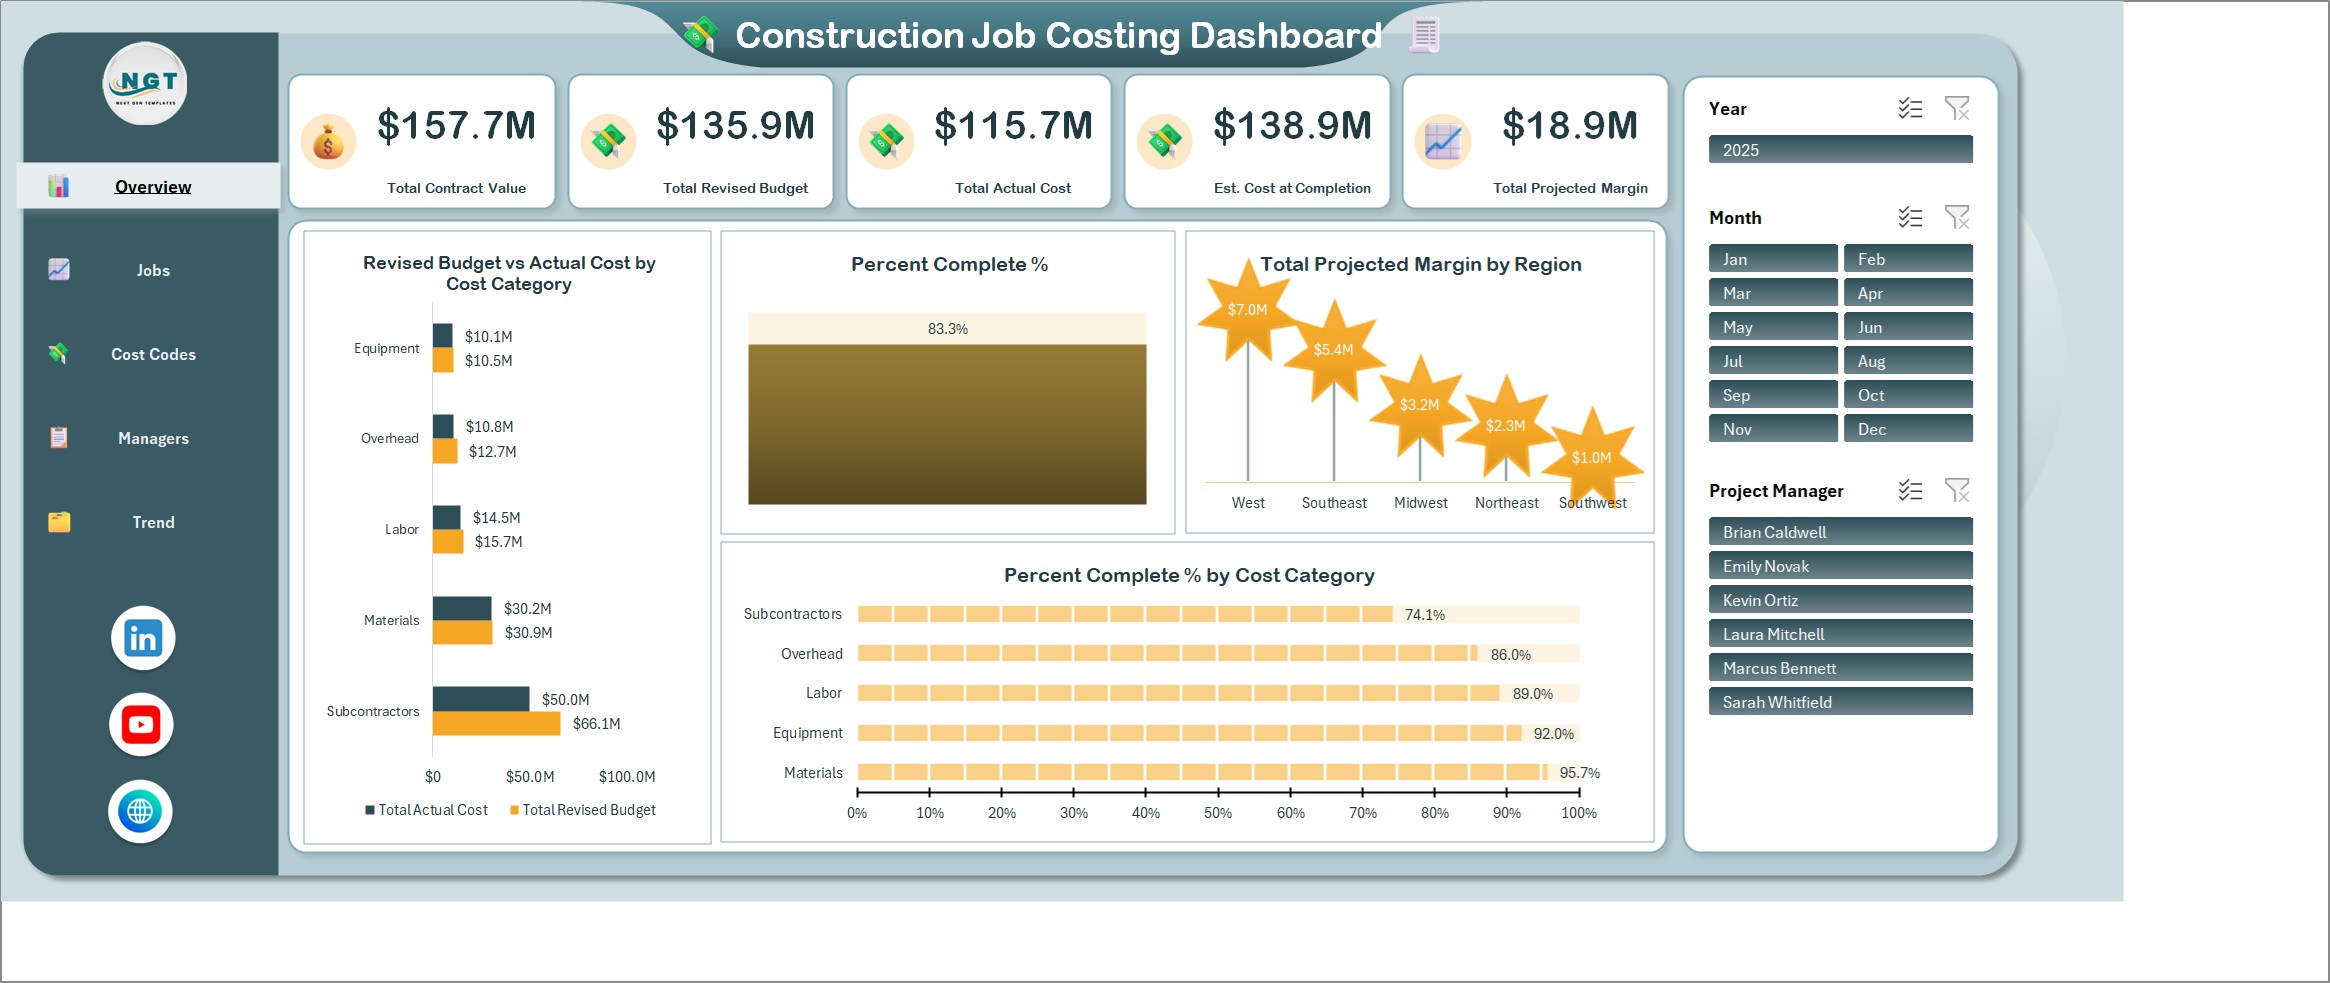
📌 Five KPI cards. Total Contract Value, Total Revised Budget, Total Actual Cost, Est. Cost at Completion and Total Projected Margin, plus a Percent Complete (cost-to-cost method) gauge.
📌 Construction budget vs actual by cost category. Revised budget against actual cost for labor, materials, equipment, subcontractors and overhead, and committed against actual cost, so you see money that is spoken for before it is spent.
📌 Estimated cost at completion. The Data tab works out the cost at completion for every work package, and the Jobs and Managers pages compare it with the revised budget and the contract value.
📌 Change order tracking. Net change orders appear by job, by CSI division and by month, so a growing scope never hides inside the budget.
📌 Projected margin. Projected margin and margin % by job, region and project manager show which jobs will keep their margin and which will not.
📌 Three slicers. Year, Month and Project Manager filter all five pages at once, so one click gives you one manager’s jobs for one month.
📌 Formulas, not hard-coding. The Data tab holds 500 sample work packages with formula columns for revised budget, cost at completion, cost variance, projected margin, month, year and quarter. A Support tab holds the pivot tables.
📦 What’s Inside the Construction Job Costing Dashboard
Five dashboard pages, a Data tab, a Support tab and an illustrated user manual PDF in the ZIP.
Overview Page
Five KPI cards sit across the top: Total Contract Value, Total Revised Budget, Total Actual Cost, Est. Cost at Completion and Total Projected Margin. Below them are Revised Budget vs Actual Cost by Cost Category, a Percent Complete % gauge, Total Projected Margin by Region and Percent Complete % by Cost Category.
Jobs Page
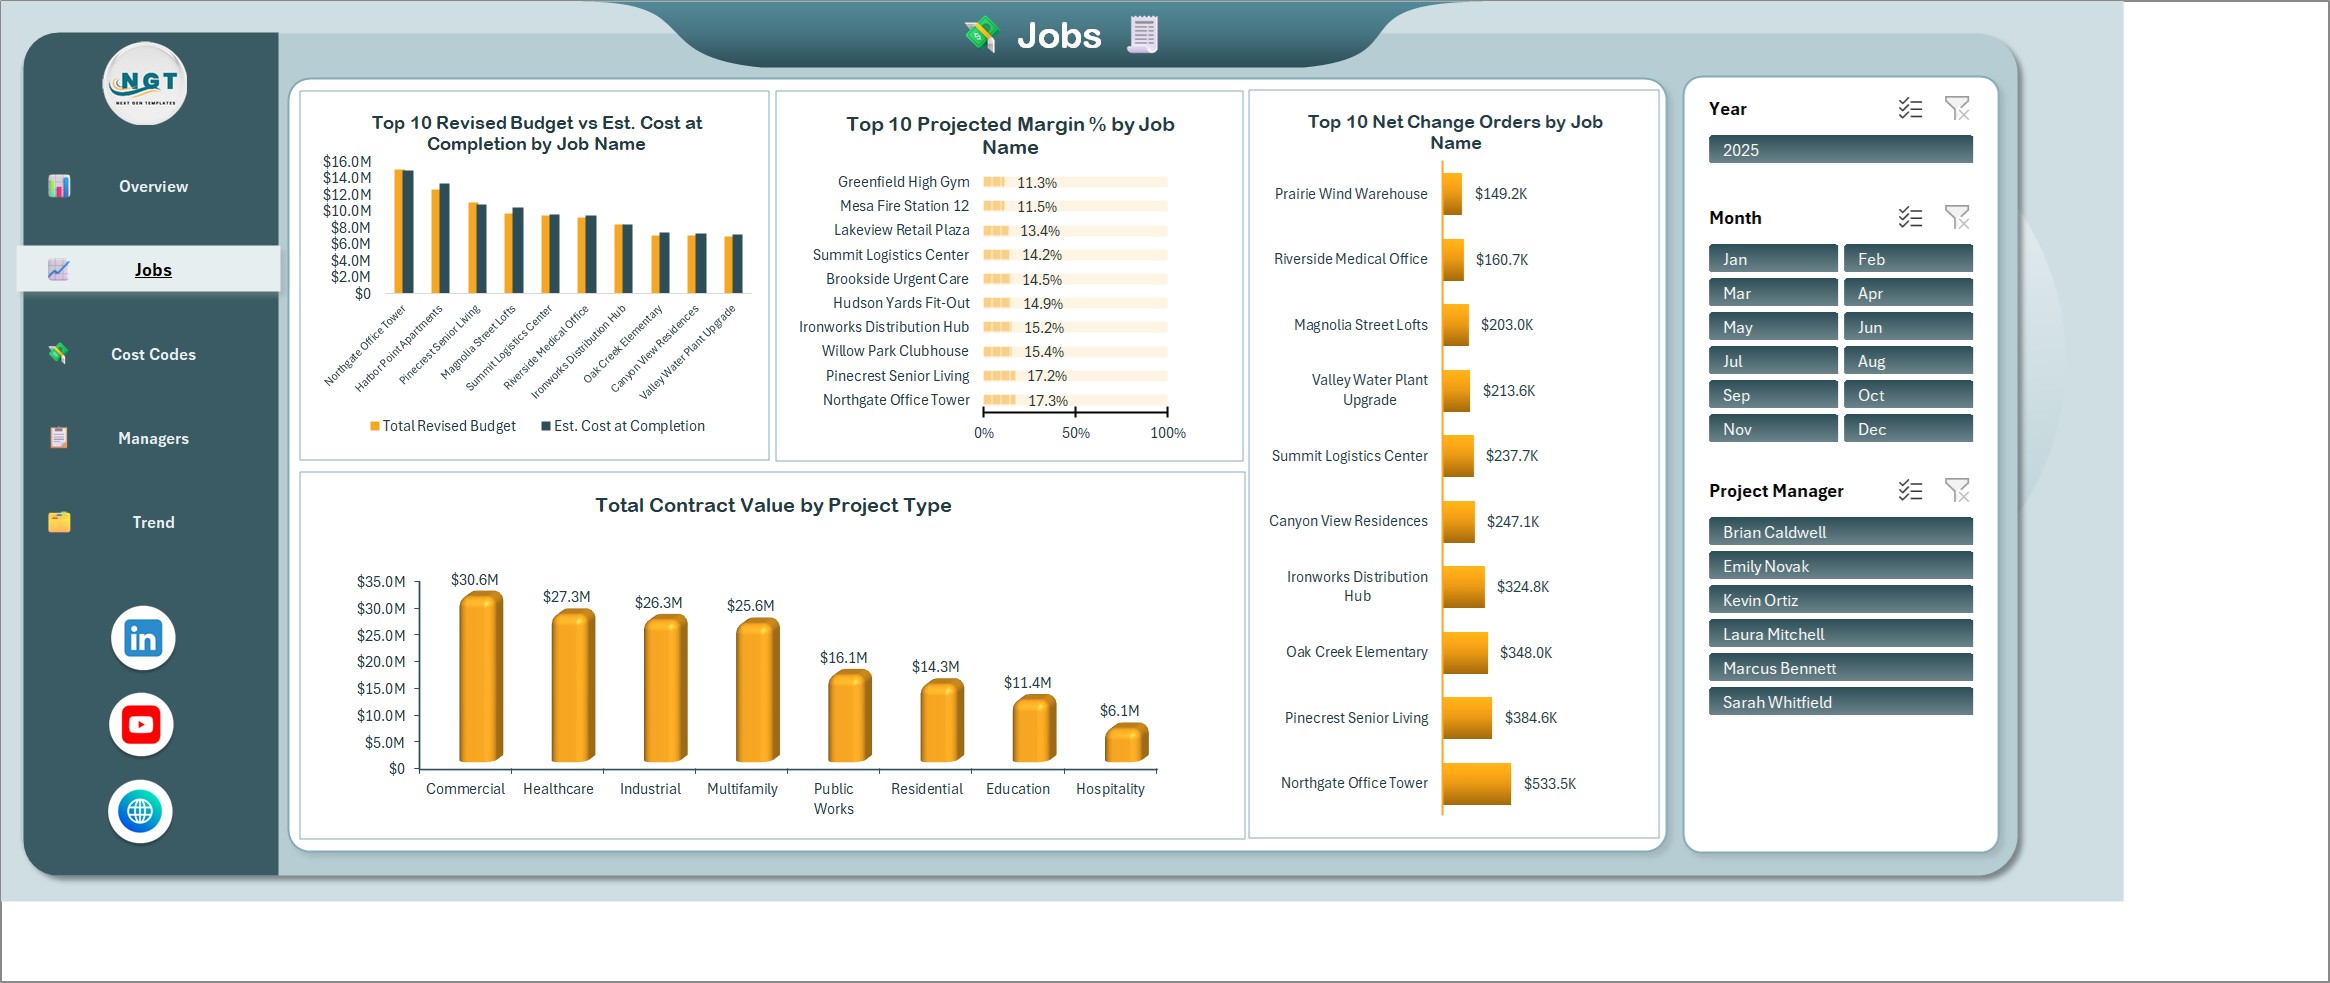
The top 10 jobs by revised budget against estimated cost at completion, the top 10 jobs by projected margin %, net change orders by job and total contract value by project type. This is where you spot the jobs that are drifting.
Cost Codes Page
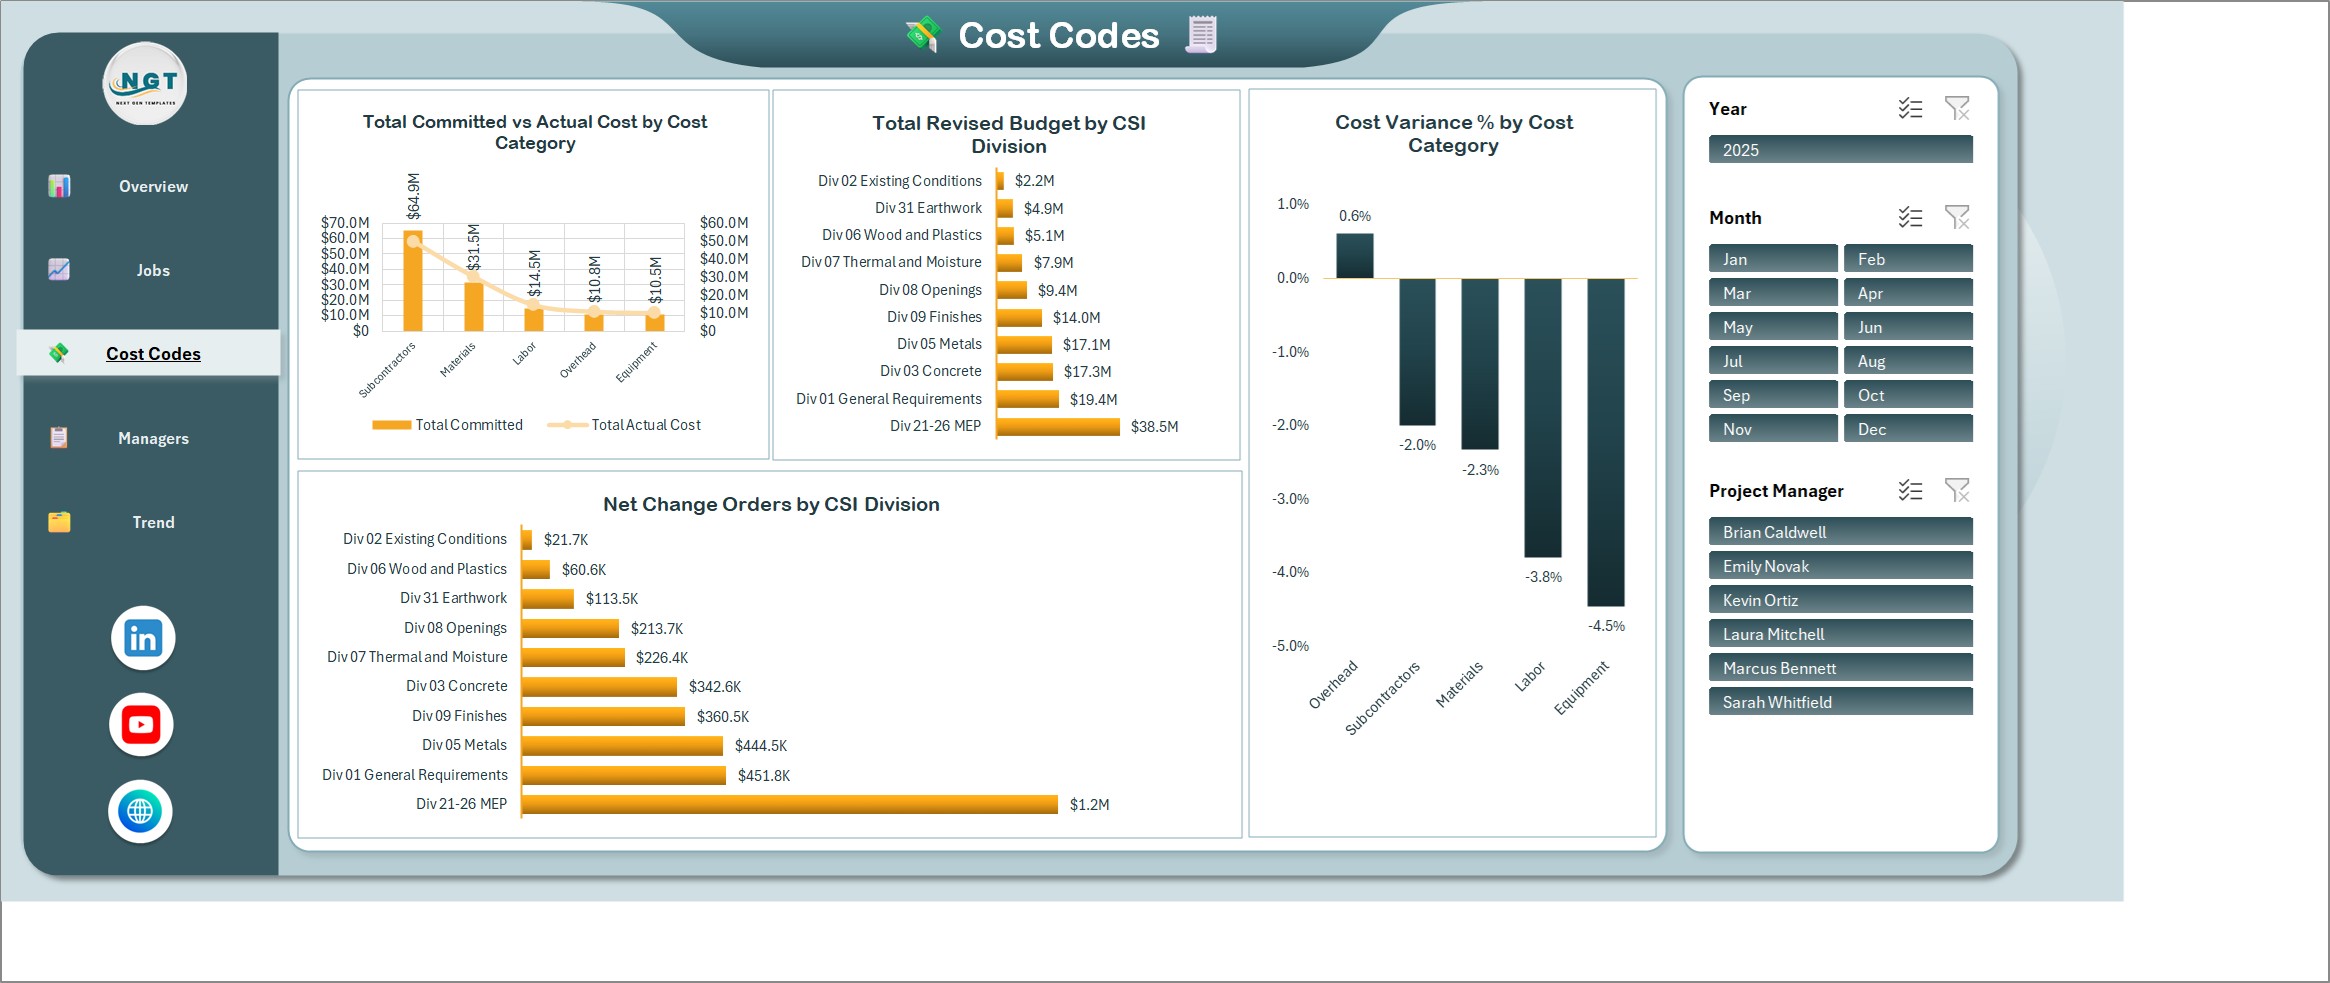
Total committed vs actual cost by cost category, total revised budget by CSI division, net change orders by CSI division and cost variance % by cost category, so you can see which cost codes are over budget and by how much.
Managers Page
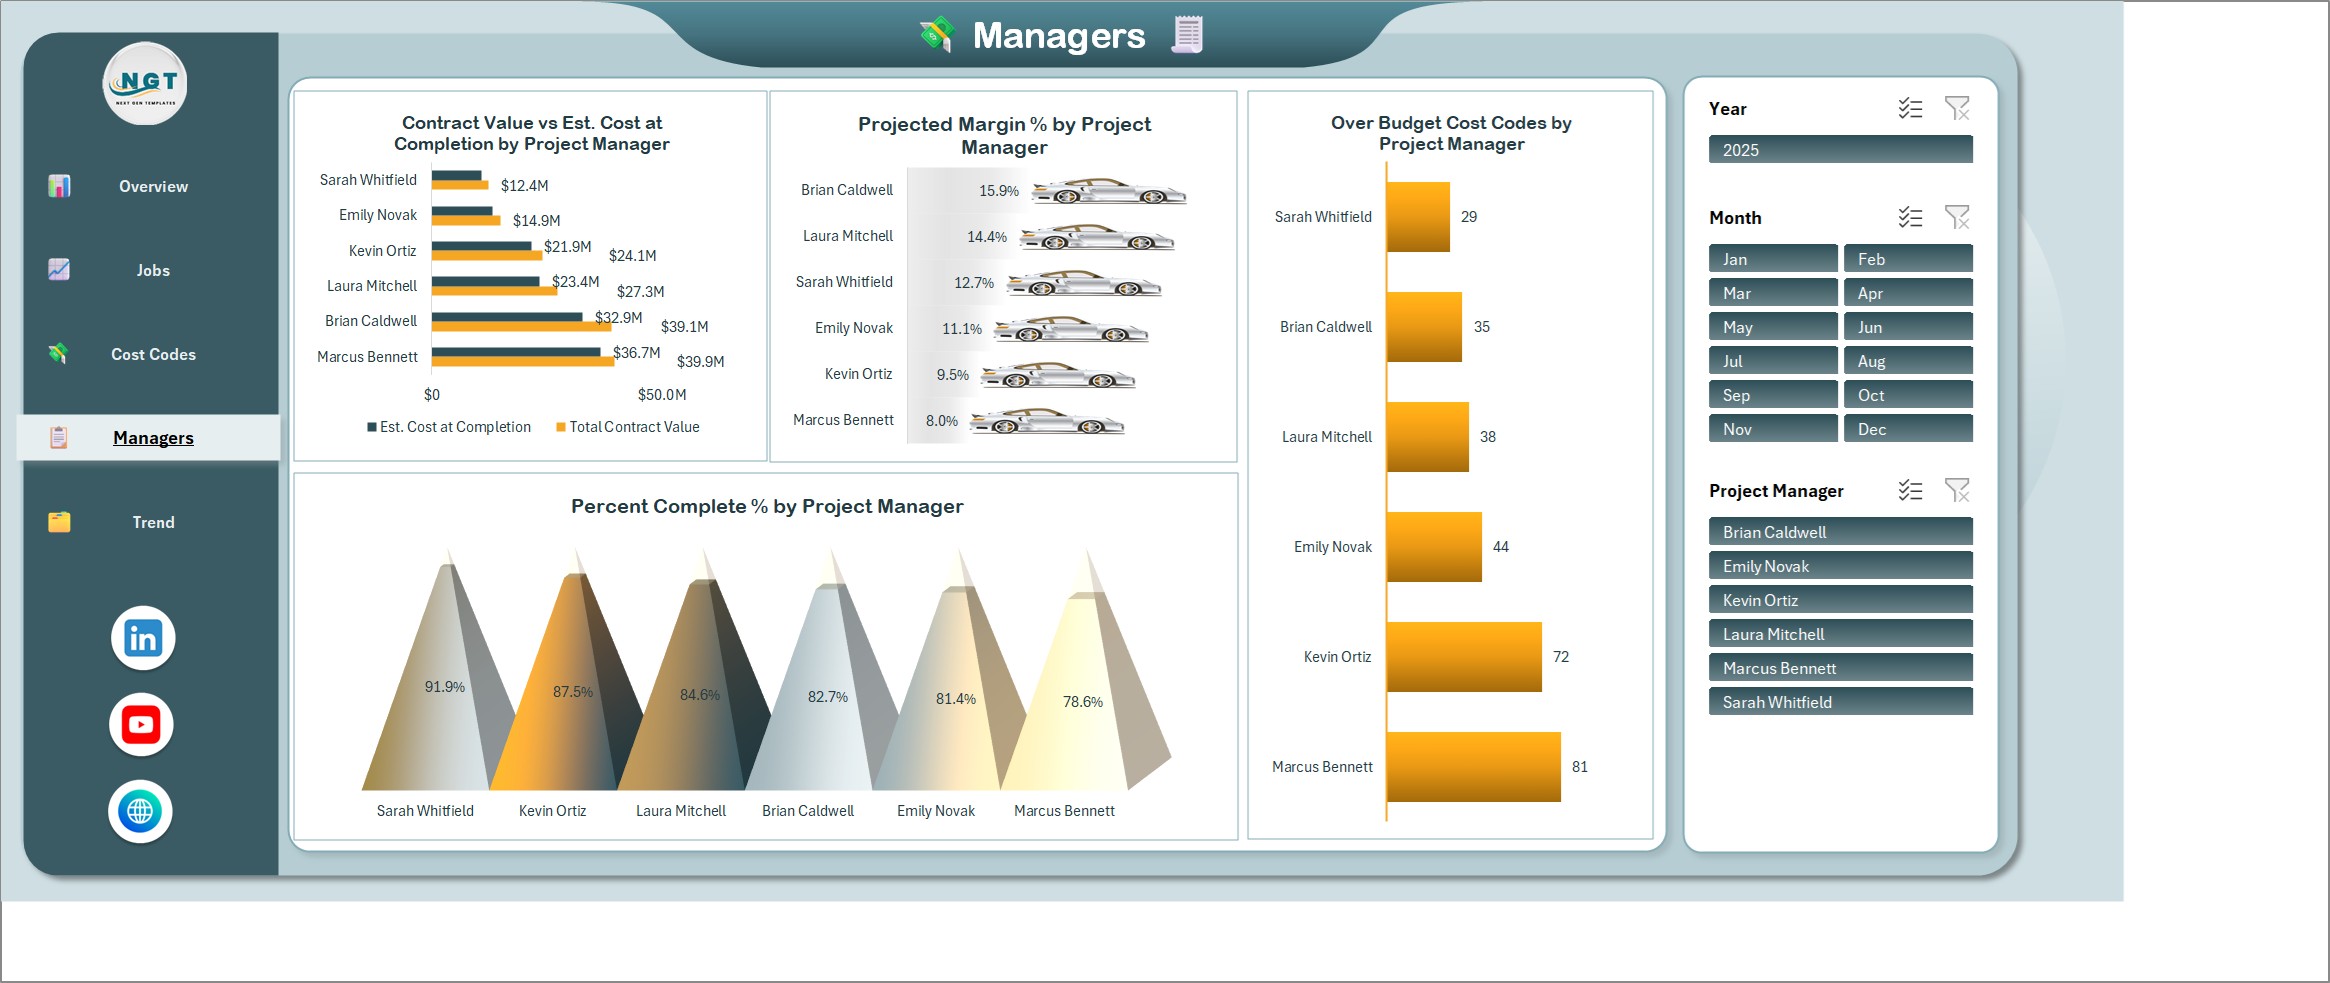
Contract value against estimated cost at completion for each project manager, projected margin % by project manager, over-budget cost codes and percent complete by project manager. Handy for a monthly review with each manager.
Trend Page
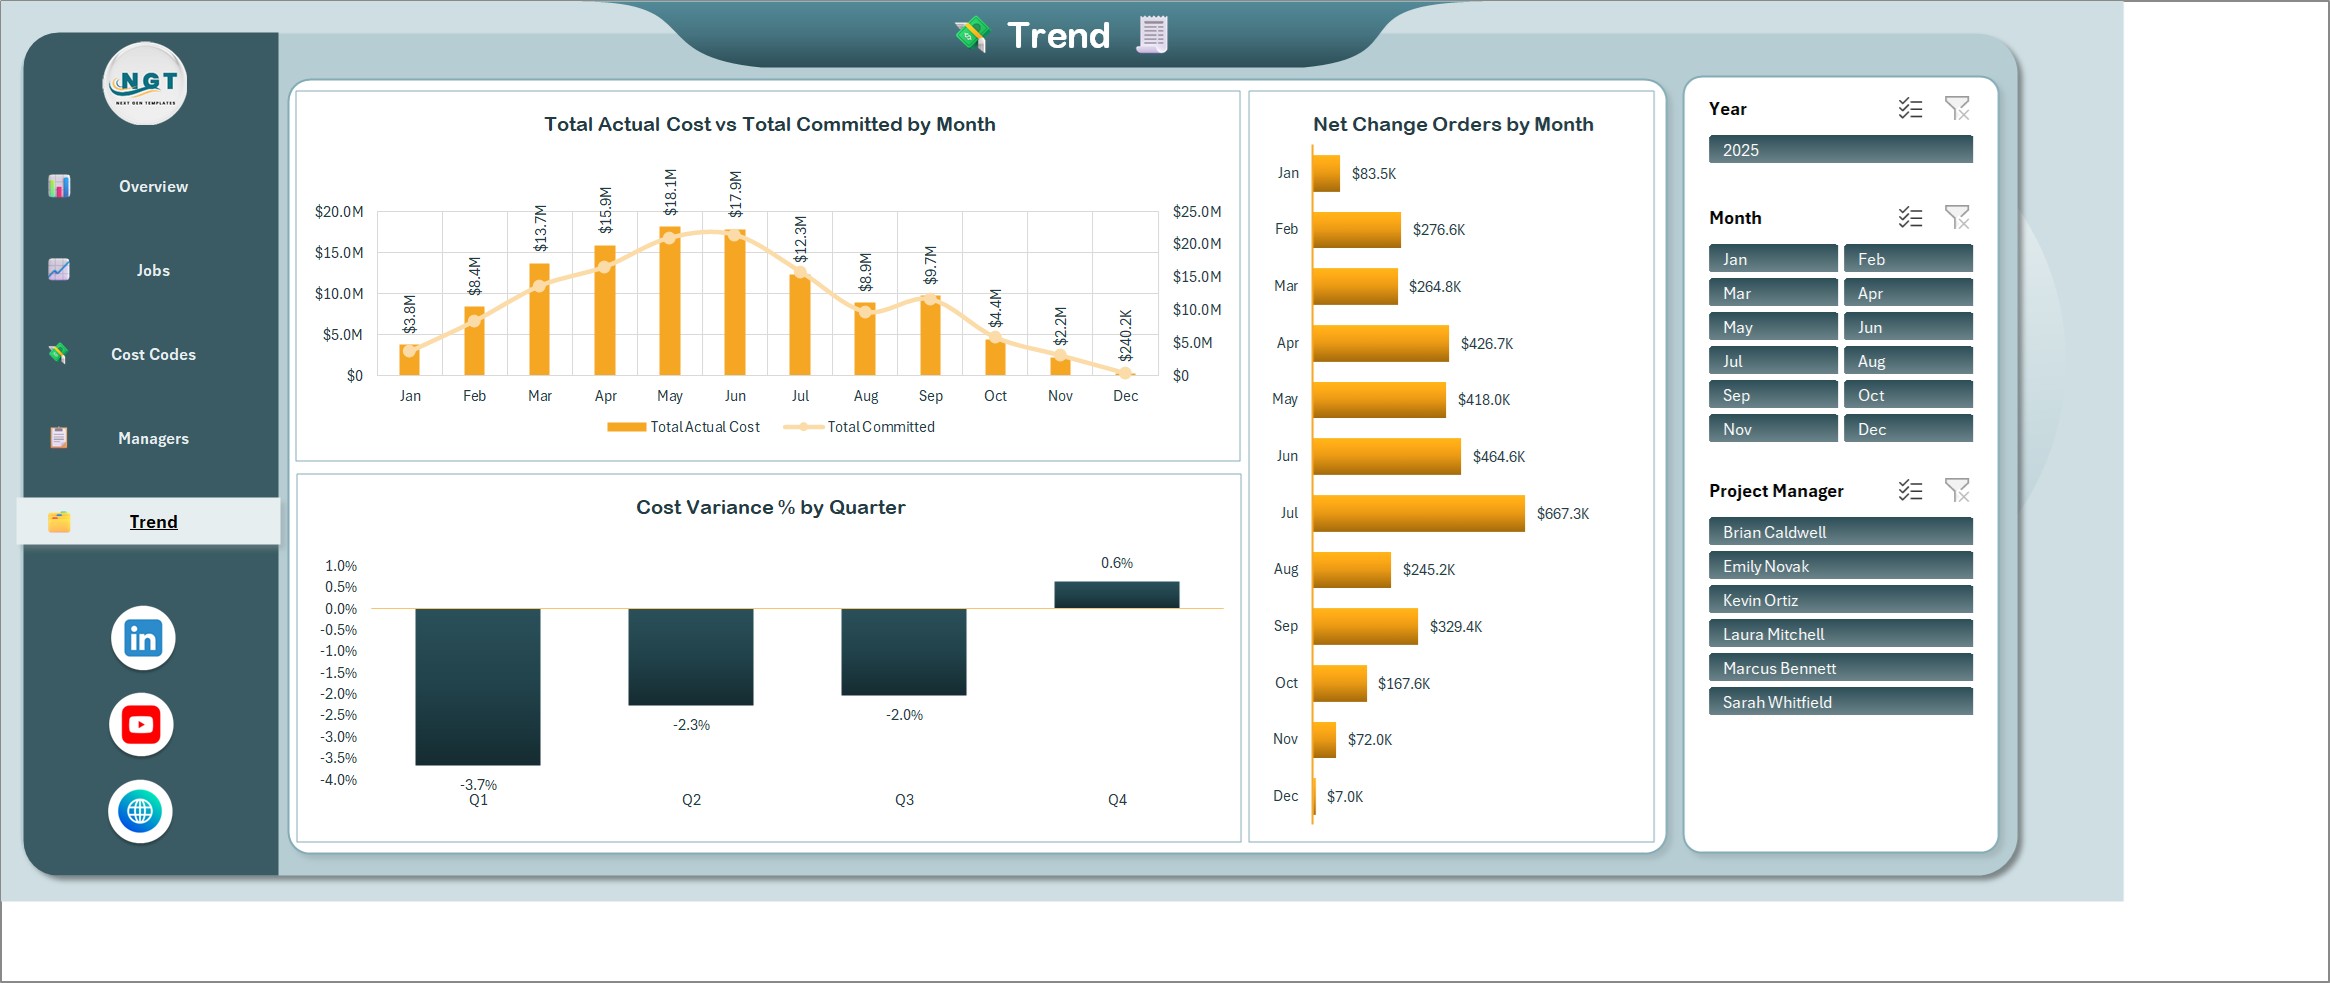
Total actual cost vs total committed cost by month, net change orders by month and cost variance % by quarter, so you can see whether cost control is getting better or worse through the year.
📊 Construction Job Costing Dashboard vs. a Job Cost Spreadsheet vs. Construction Software: Where This Fits
| Feature | This Excel dashboard | Plain job cost spreadsheet | Construction accounting software |
|---|---|---|---|
| Cost | $17.99 one-time ✅ | Free, but you build it | Monthly subscription, often per user |
| Budget vs actual and committed cost | Charts and cards ✅ | Manual formulas | Yes ✅ |
| Estimated cost at completion and projected margin | Yes, by job and manager ✅ | Build it yourself | Yes ✅ |
| Net change orders by job, division and month | Yes ✅ | Filter and sum by hand | Yes ✅ |
| Slicers for year, month and project manager | Yes ✅ | No | Varies |
| Live link to your accounting system | No | No | Yes ✅ |
| Macros required | No | No | Not applicable |
For a small or mid-size contractor who wants a clear job cost picture without a monthly subscription, this construction cost tracking Excel dashboard sits in the sweet spot. If you need a live feed from your accounting system, payroll or purchase orders, use dedicated construction software.
👥 Who This Template Is For, and Who It’s Not For
✅ This template is built for:
- General contractors and specialty trade contractors who want to see job costs against budget each month
- Project managers and estimators who report budget vs actual construction figures to owners
- Controllers and bookkeepers who prepare work in progress and cost to complete reviews
- Owners who want to know which jobs will keep their margin before the job closes
❌ This template is NOT for:
- Teams that need a live connection to accounting, payroll or purchasing systems, because the data is pasted or typed in
- Mac or Excel-for-web users, because the pivot tables and slicers need desktop Excel for Windows
- Anyone looking for percent-complete billing, retainage or certified payroll reporting, which this dashboard does not include
⚙️ How to Use the Construction Job Costing Dashboard
- Download the ZIP, extract it and open the Excel file.
- Go to the Data tab and replace the 500 sample work packages with your own jobs, cost codes, budgets, committed and actual costs.
- Click Refresh All on the Data tab.
- Use the Year, Month and Project Manager slicers to filter every page.
- Move through Overview, Jobs, Cost Codes, Managers and Trend from the navigation bar on the left.
💼 Real-World Use Cases
The monthly owner meeting. A project manager filters to one month, opens the Jobs page and shows the owner the revised budget against the estimated cost at completion for the biggest jobs.
The over-budget hunt. A controller opens the Cost Codes page, finds the cost category with the worst cost variance % and drills into the CSI division behind it.
The manager review. An owner selects one project manager on the slicer and compares their projected margin % and percent complete with the rest of the company.
❓ Frequently Asked Questions
What does the Construction Job Costing Dashboard in Excel show?
For every job and cost code it shows what you budgeted, what you have committed, what you have actually spent, what the job will cost at completion and how much margin you will keep. Five pages (Overview, Jobs, Cost Codes, Managers and Trend) show the same data from different angles.
Does it need macros or add-ins?
No. It uses formulas, pivot tables, charts and slicers only, so there is nothing to enable beyond opening the file.
Does it connect to my accounting or ERP software?
No. It is an add-data-and-refresh workbook. Paste or type your work packages on the Data tab, click Refresh All, and every card and chart updates. There is no live link to your accounting software.
How is percent complete worked out?
It uses the cost-to-cost method: actual cost divided by the estimated cost at completion. The Percent Complete % card and chart react to the Year, Month and Project Manager slicers.
Which Excel version do I need?
Desktop Excel for Windows, Excel 2016 or later, or Microsoft 365. The slicers and pivot tables do not work fully in Excel for the web.
Is the sample data real?
No. The 500 work packages on the Data tab are fictional. Replace them with your own and refresh.
Can I add my own jobs, project managers and cost categories?
Yes. Add rows on the Data tab with your own job names, project managers, cost categories and CSI divisions, click Refresh All, and the pages and slicers pick them up.
Can I change the colours or add a chart?
Yes. It is a normal Excel workbook with no macros and no protection that blocks editing, so you can restyle the charts or add your own pivot tables on the Support tab.
👤 About the Author
Built by PK, Microsoft Certified Professional with 15+ years of Excel, Google Sheets and Power BI experience. Founder of NextGenTemplates. Every template is hand-built and tested before release. Watch the walkthroughs on @PKAnExcelExpert and @NextGenTemplates.
🔗 Explore Related Templates
- Interior Fit-Out Project Management System Web App: a browser-based system for running fit-out projects, if you also need to manage the work itself.
- Profitability Analysis Pack in Excel: look at margins across the whole business, beyond a single job.
- Irrigation Installation KPI Dashboard in Excel: another dashboard built for a field-service contractor.
- Free Automatic Gantt Chart in Excel: plan the schedule next to your costs.
Browse all Excel templates.
🎥 Visit our YouTube channel for step-by-step video tutorials
👉 YouTube.com/@NextGenTemplates
📅 Last updated: November 2026
Compatibility and Requirements
- Runs in Microsoft Excel desktop on Windows (Excel 2016 or later, or Microsoft 365). No macros and no add-ins are needed.
- Uses pivot tables and slicers, so Excel for the web, Excel for Mac and mobile apps may not show every page correctly.























Reviews
There are no reviews yet.