

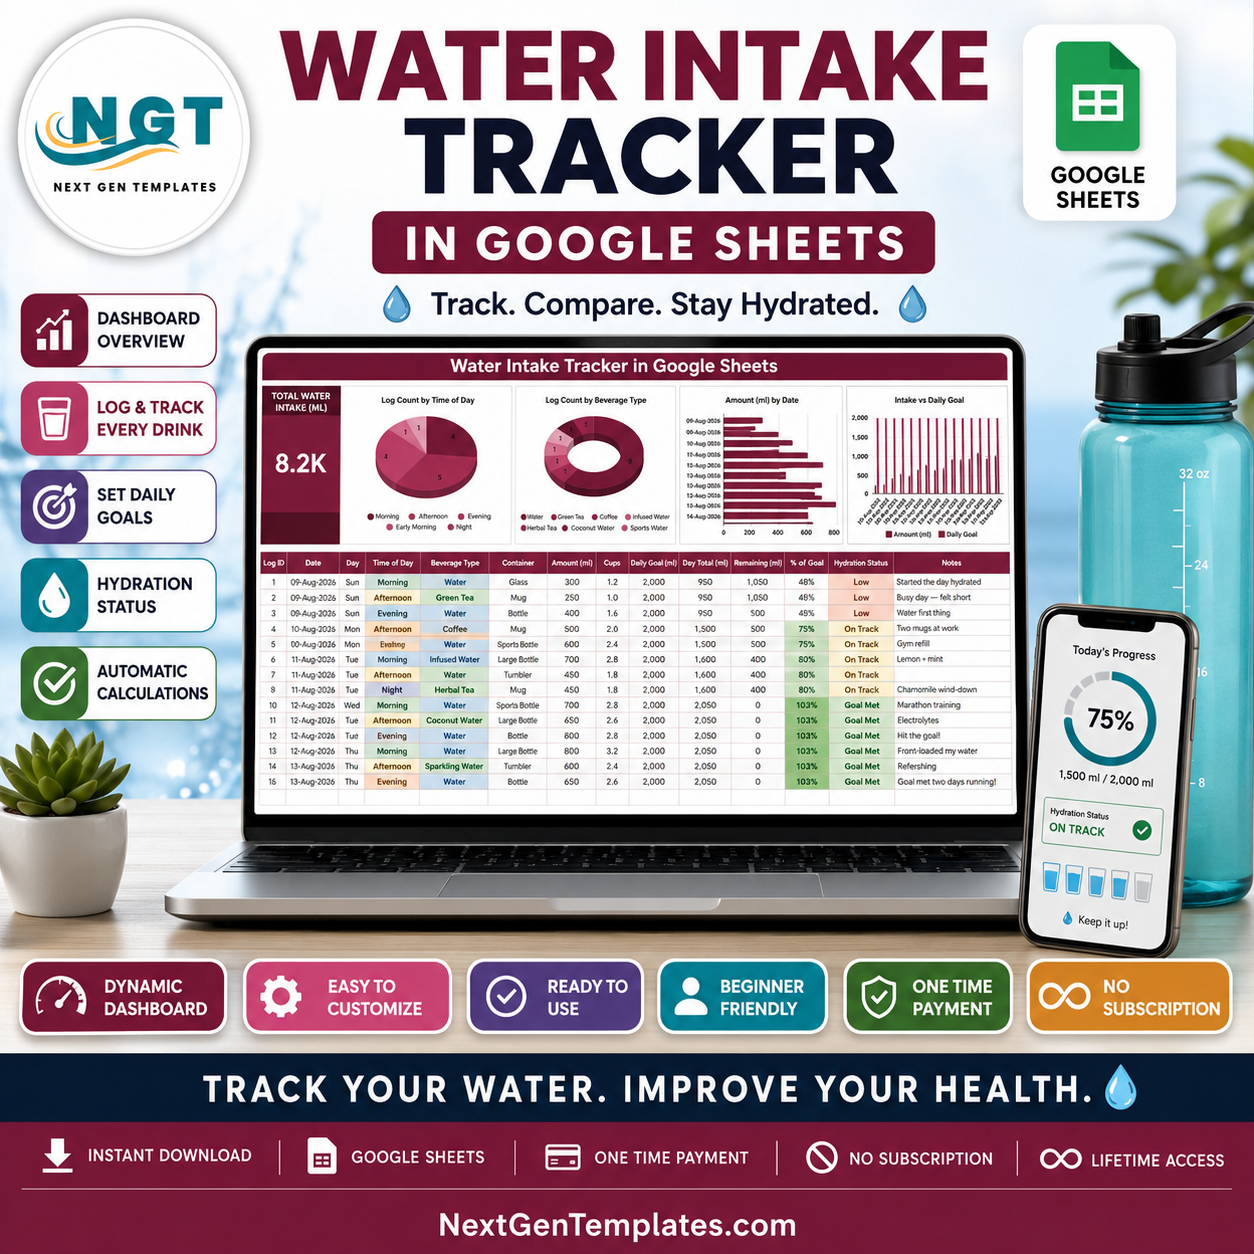
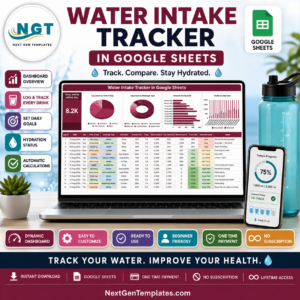
The Water Intake Tracker in Google Sheets turns something you already do into a record you can read at a glance. Log each drink and the sheet handles the arithmetic: 14 columns, 7 beverage types, 6 container sizes and 5 times of day, with millilitres converted to cups, every entry sharing a date rolled into a single day total, the remainder measured against the goal you set, and each day labelled Goal Met, On Track or Low. Four charts and one KPI card sit above the table and redraw as you type. One page, one file, one-time $6.99 instead of a monthly app fee – and the log stays in your own Google Drive.
Please note: this is a logging and charting template. It is not medical advice and it does not tell you how much to drink – you enter your own Daily Goal.
Key Features of the Water Intake Tracker in Google Sheets
- One page, nothing hidden. The KPI card, the four charts and the log table share a single sheet. There is no support tab and no helper table to break.
- Total Water Intake (ML) card sums every drink logged across every date in the file.
- Log Count by Time of Day – a pie chart splitting entries across Early Morning, Morning, Afternoon, Evening and Night, so you can see whether you front-load or back-load the day.
- Log Count by Beverage Type – a donut chart separating plain Water from Green Tea, Coffee, Infused Water, Herbal Tea, Coconut Water and Sparkling Water.
- Amount (ml) by Date – a horizontal bar chart showing every individual entry against its date.
- Intake vs Daily Goal – a column chart placing the amount you logged beside the goal you typed, day by day.
- Seven columns calculate themselves. Log ID, Day, Cups, Day Total (ml), Remaining (ml), % of Goal and Hydration Status are all formulas. You never type them.
- Colour-coded Hydration Status – green on Goal Met, amber on On Track, red on Low, driven by % of Goal.
- Auto-expanding dropdowns. Time of Day, Beverage Type and Container read the List tab (rows 2-500), so a value you add there shows up in the dropdown straight away.
- Charts already cover rows 16 to 1000 using the built-in Aggregate option, so new rows appear in every chart without you editing a single range.
- Millilitres or fluid ounces. Amounts default to ml; enter oz values and rename the headers and the calculations still hold.
What’s Inside the Water Intake Tracker in Google Sheets
Three visible tabs, plus a List tab that feeds every dropdown.
Page 1 – Water Intake Tracker
The working page. The Total Water Intake (ML) card sits on the left, the four charts run across the top, and the log table fills the rest with one row per drink.
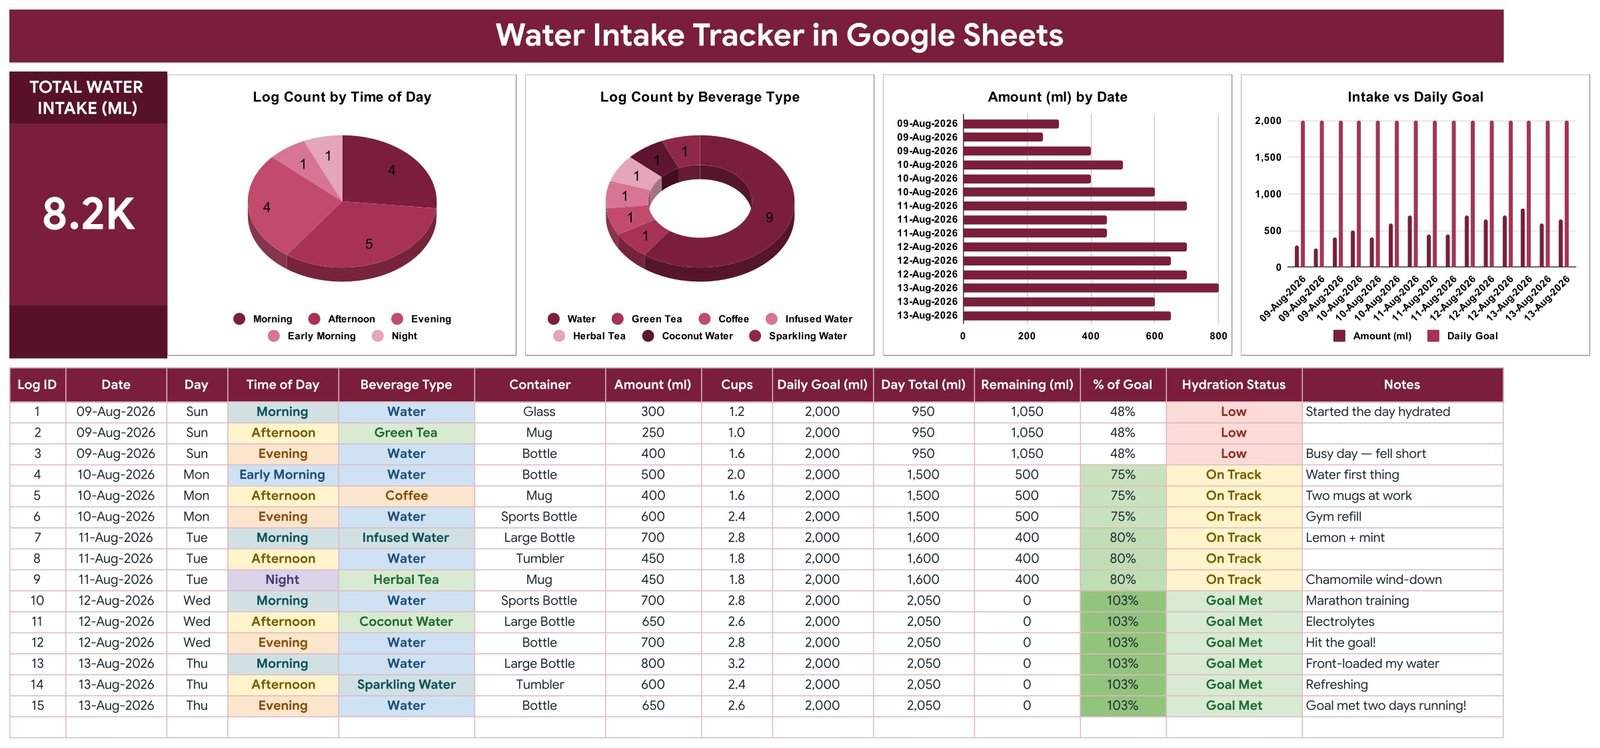
The columns run Log ID, Date, Day, Time of Day, Beverage Type, Container, Amount (ml), Cups, Daily Goal (ml), Day Total (ml), Remaining (ml), % of Goal, Hydration Status and Notes. Cups is Amount divided by 250. Day Total adds up every row that shares the same Date, so three drinks on a Tuesday roll into one Tuesday figure. Notes is free text – the sample rows use it for context like Gym refill or Lemon + mint.
Page 2 – How to Use
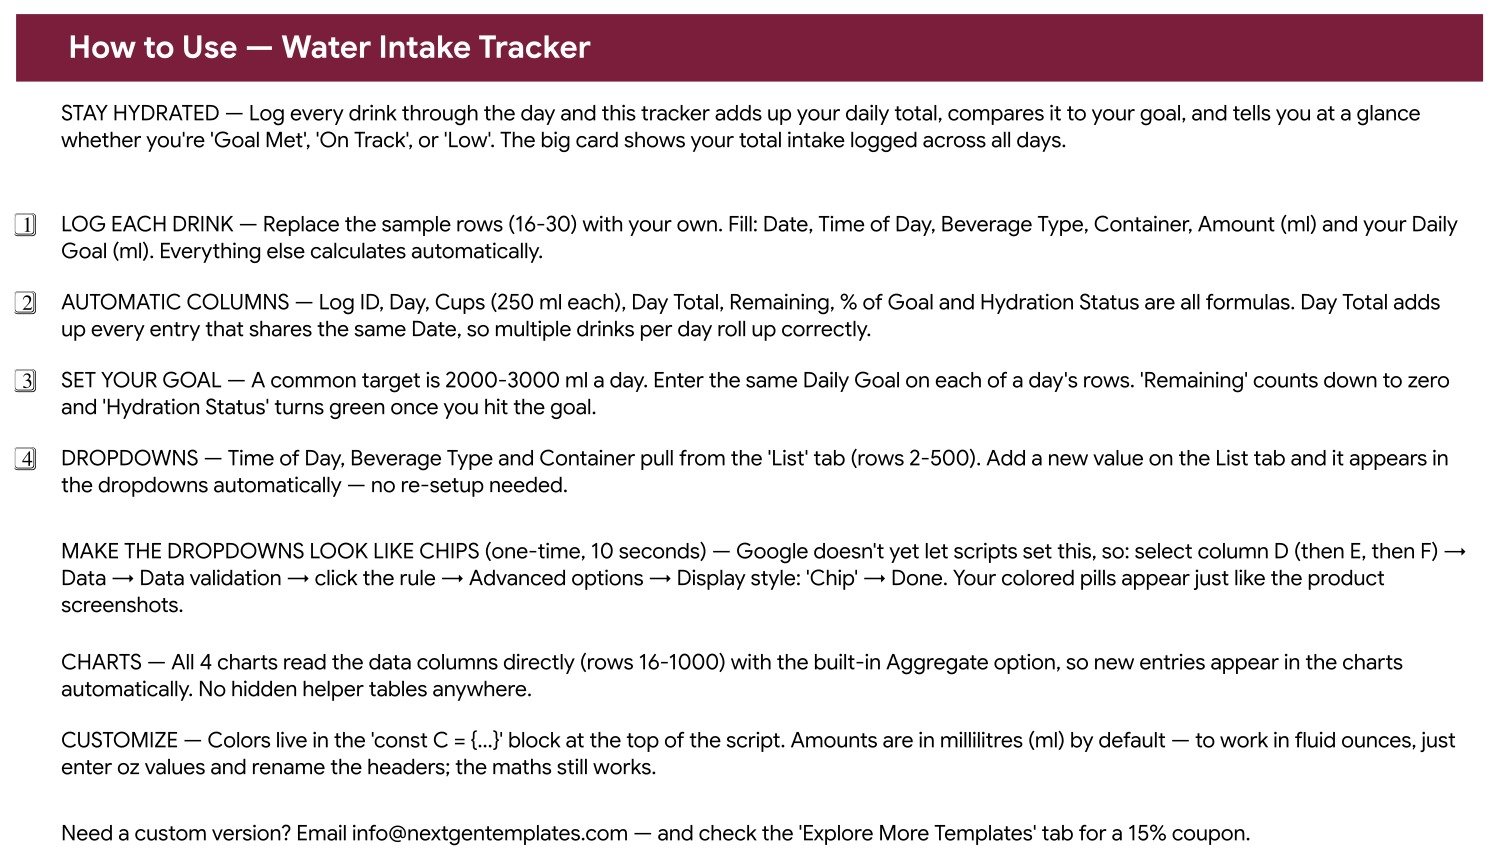
The setup page, written into the file so you are not hunting through a separate document. It covers which rows to replace, which columns calculate themselves, how the Daily Goal column works, how to extend the dropdowns, and the one manual step Google does not let a script do – switching the dropdown display style to Chip so you get the coloured pills you see in the screenshots.
Page 3 – Explore More Templates
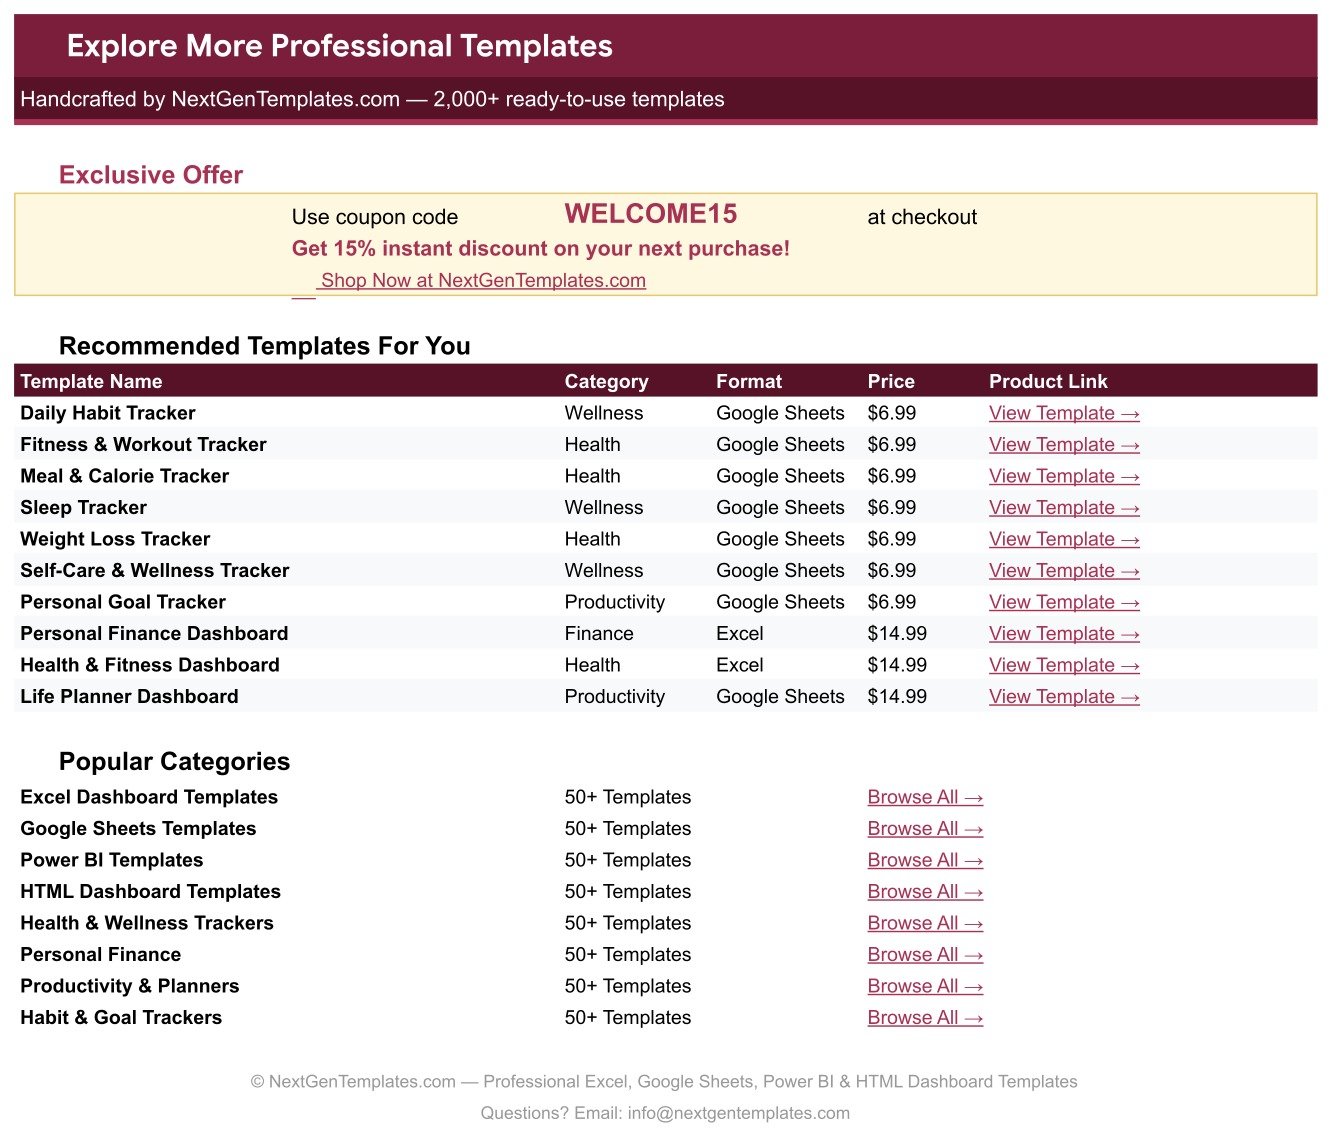
A short in-file index of related NextGenTemplates trackers and dashboards, with a WELCOME15 coupon code for your next purchase.
Google Sheets vs. Excel vs. a Paid Hydration App – Where This Fits
| This Google Sheets tracker | Excel hydration spreadsheet | Paid hydration app | |
|---|---|---|---|
| Cost | $6.99 one time | $7-$15 one time, plus Microsoft 365 if you do not own Excel | $3-$10 per month, per person |
| Platform | Google Sheets, any browser | Microsoft Excel, desktop first | The vendor’s iOS or Android app |
| Setup time | Under 5 minutes – open the PDF, click the copy link | Download, open, enable editing | Install, create an account, accept terms |
| Real-time collaboration | Yes, native Google Sheets sharing | Only through OneDrive co-authoring | Usually single-user unless you buy a family plan |
| Mobile access | Yes, free Google Sheets app | Excel mobile, with limited chart editing | Yes – that is the whole product |
| Customizable fields | Yes – add beverage types and containers on the List tab | Yes, if you rebuild the formulas | Rarely – you use the vendor’s fields |
| Share with a link | Yes | Needs a cloud upload first | Export only |
| Year-1 cost at 5 users | $6.99 total | $7-$15 plus licences | $180-$600 |
| Beverage-type breakdown | Built in – donut chart and a Beverage Type column | Build it yourself | Often behind a premium tier |
| Where the log lives | Your own Google Drive | Your own disk | The vendor’s servers |
Who This Template Is For – and Who It’s Not For
A good fit if you want a written record rather than a notification; already live in Google Sheets; drink more than plain water and want the split visible; are training and want intake sitting next to your workout log; or simply refuse to pay a subscription for a counter.
Not a good fit if you want automatic logging from a smart bottle or wearable – this template has no integrations and every row is typed. It is also the wrong tool if you need a clinical fluid-balance chart with intake and output for a care setting: this tracks intake only. And if you want one file covering food, weight and water together, the Calorie & Macro Tracker in Google Sheets and the Weight Loss Tracker in Google Sheets cover those separately and read better than one overloaded sheet.
How to Use the Water Intake Tracker in Google Sheets
- Make your copy. Open the PDF in your download and click the copy link. The tracker lands in your own Google Drive, sample data and all.
- Set your Daily Goal. Type your own target into the Daily Goal (ml) column, on each row for that day. The template ships with a sample figure – replace it with whatever you have decided on.
- Replace the sample rows. Rows 16 to 30 hold demonstration data. Overwrite them with your first real entries and keep going down the sheet.
- Fill six fields per drink. Date, Time of Day, Beverage Type, Container, Amount (ml) and Daily Goal (ml). Everything else – Log ID, Day, Cups, Day Total, Remaining, % of Goal, Hydration Status – fills itself in.
- Turn the dropdowns into chips. Select column D, then E, then F: Data, Data validation, click the rule, Advanced options, Display style: Chip. Ten seconds, once, and you get the coloured pills from the screenshots.
- Extend the lists. Add a beverage or a container on the List tab and it appears in the dropdown immediately – no re-setup.
- Read the charts. Watch Intake vs Daily Goal for the day-to-day pattern and Log Count by Time of Day for when your drinking actually happens.
Real-World Use Cases
Priya, marathon training. She logs three to five entries a day across Sports Bottle and Large Bottle, and uses Notes to mark long-run days. The Amount (ml) by Date chart shows her which training days she under-drank, and Log Count by Time of Day confirmed she was doing almost nothing before noon – which is exactly what she wanted to change.
Daniel, desk-bound developer. Coffee dominated his donut chart in the first week. He kept the log running, added Infused Water and Sparkling Water rows, and now uses the Beverage Type split as the whole point of the sheet rather than the totals.
The Okafor household. One shared copy, one tab, and each person keeps their own date range. Because it is a Google Sheet, all four of them edit it from their phones at once – something a single-seat app licence would not allow.
Frequently Asked Questions
Does this tell me how much water I should drink?
No. The tracker is deliberately neutral – you type your own Daily Goal and it measures your logged intake against that number. It offers no recommendation and is not medical advice. If you want a target set for you, ask a qualified professional.
Can I use fluid ounces instead of millilitres?
Yes. Enter your amounts in oz and rename the headers. The only fixed conversion is the Cups column, which divides by 250, so adjust that one formula if you switch units.
Do drinks other than water count?
That is your call, and the template supports both answers. Every entry carries a Beverage Type, so you can total everything, or filter the log to plain Water only and read that figure instead.
Will the charts pick up my new rows automatically?
Yes. All four charts read the data columns directly from row 16 to row 1000 with the built-in Aggregate option. There are no hidden helper tables and no ranges to extend.
How do I add a beverage or a container that isn’t listed?
Type it on the List tab. The dropdowns pull from rows 2 to 500 of that tab, so anything you add there appears in the validation list at once.
Can I change the colours?
Yes. The palette lives in the const C = { ... } block at the top of the build script, and the sheet itself can be recoloured like any Google Sheet.
What exactly do I get after purchase?
A PDF containing the Make a Copy link. Click it and the full tracker – all three tabs, the List tab, the formulas and the four charts – is created in your Google Drive as your own file. There is no subscription and no account to create.
About the Author
Built by PK – Microsoft Certified Professional with 15+ years of Excel, Google Sheets, and Power BI experience. Founder of NextGenTemplates, reaching 300K+ subscribers across YouTube channels. Every template is hand-built and tested before release.
Explore Related Templates
- Body Measurements Tracker in Google Sheets – the same one-page format for tape-measure numbers.
- Calorie & Macro Tracker in Google Sheets – food logging with the same dropdown-and-chart approach.
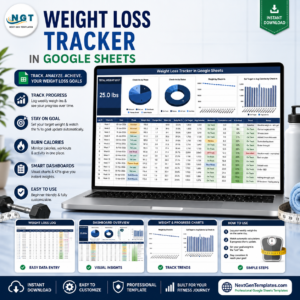
- Weight Loss Tracker in Google Sheets – weigh-ins charted over time.
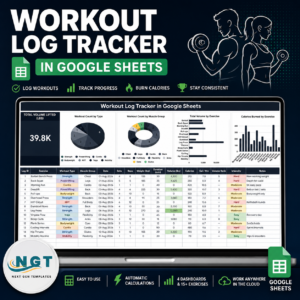
- Workout Log Tracker in Google Sheets – sets, reps and session volume.
- Gym Membership Tracker in Google Sheets – for anyone running the gym rather than attending it.
- Browse the full Google Sheets Trackers category, or all Google Sheets templates.
Ready to start logging? Add the Water Intake Tracker in Google Sheets to your cart for a one-time $6.99, open the PDF, click the copy link, and you are recording your first drink inside five minutes. Prefer to read the full walkthrough first? See our detailed guide to the Water Intake Tracker in Google Sheets.
Watch the step-by-step video Demo:
Last updated: 14 August 2026. Logging and charting template only – not medical advice.








Reviews
There are no reviews yet.