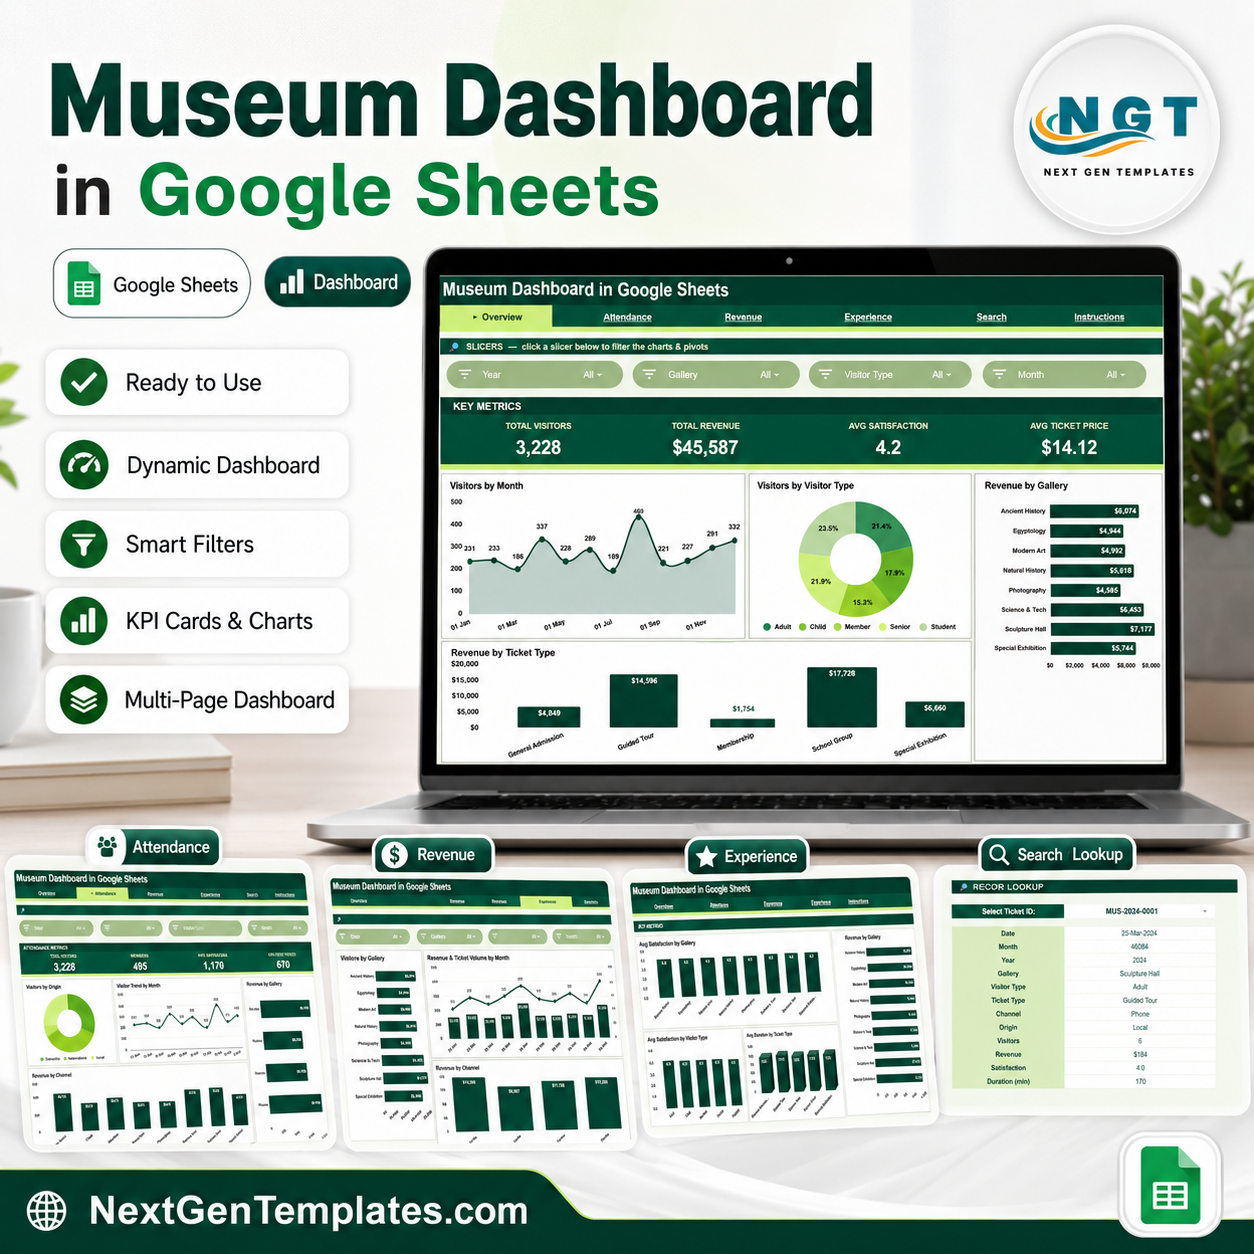

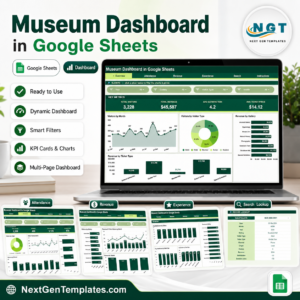
Museum Dashboard in Google Sheets tracks Total Visitors, Total Revenue, Avg Satisfaction, and Avg Ticket Price across 6 sheet tabs, 4 KPI cards, and 18 focused analysis views. Museum teams can review attendance, revenue, visitor origin, gallery performance, satisfaction, duration, ticket type, channel, and individual ticket records without building charts from scratch. It is a one-time purchase, works in Google Sheets, and is designed for quick review meetings, board packs, exhibition planning, and front-office reporting.
Built by PK – Microsoft Certified Professional with 15+ years of Excel, Google Sheets, and Power BI experience and 300K+ subscribers across YouTube channels. Every template is hand-built and tested before release.
Key Features of Museum Dashboard in Google Sheets
- 6 Google Sheets tabs: Overview, Attendance, Revenue, Experience, Search, and Data Sheet.
- 4 executive KPI cards: Total Visitors, Total Revenue, Avg Satisfaction, and Avg Ticket Price.
- 18 analysis views: Track visitors, revenue, gallery performance, ticket type, channel, origin, duration, and satisfaction.
- Slicer-driven dashboard: Apply filters quickly and review segmented results without rebuilding formulas.
- Ticket lookup sheet: Search by Ticket ID and return the selected ticket details instantly.
- Editable data tab: Add museum records in the same format and refresh the reporting views.
What’s Inside the Museum Dashboard in Google Sheets
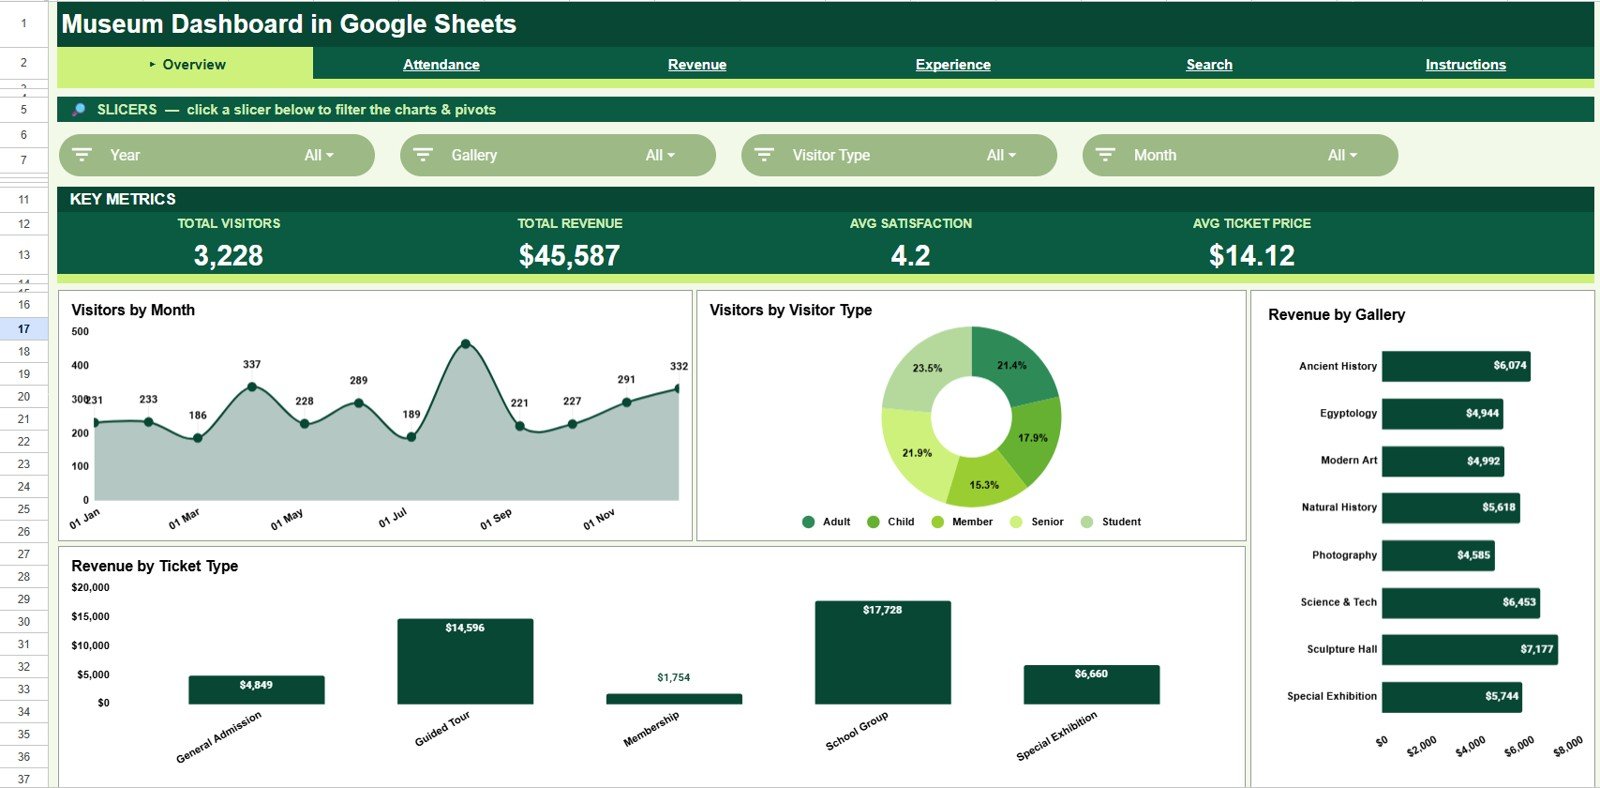
1 – Overview Page
The Overview page gives leadership a high-level view of museum performance. The cards summarize Total Visitors, Total Revenue, Avg Satisfaction, and Avg Ticket Price, while slicers help filter the dashboard quickly.
Visitors by Month: This trend shows seasonal attendance patterns across the year.
Use it to plan staffing, exhibition calendars, school visits, and marketing pushes.
Visitors by Visitor Type: This chart separates members, students, adults, seniors, families, or other visitor groups.
Use it to understand audience mix and adjust programs or pricing.
Revenue by Gallery: This view compares revenue contribution by gallery or exhibit area.
Use it to identify spaces that drive ticket value and deserve deeper programming attention.
Revenue by Ticket Type: This chart explains revenue by general, member, student, group, or premium ticket types.
Use it to review ticket strategy and understand which offers generate the most value.
Museum Dashboard in Google Sheets
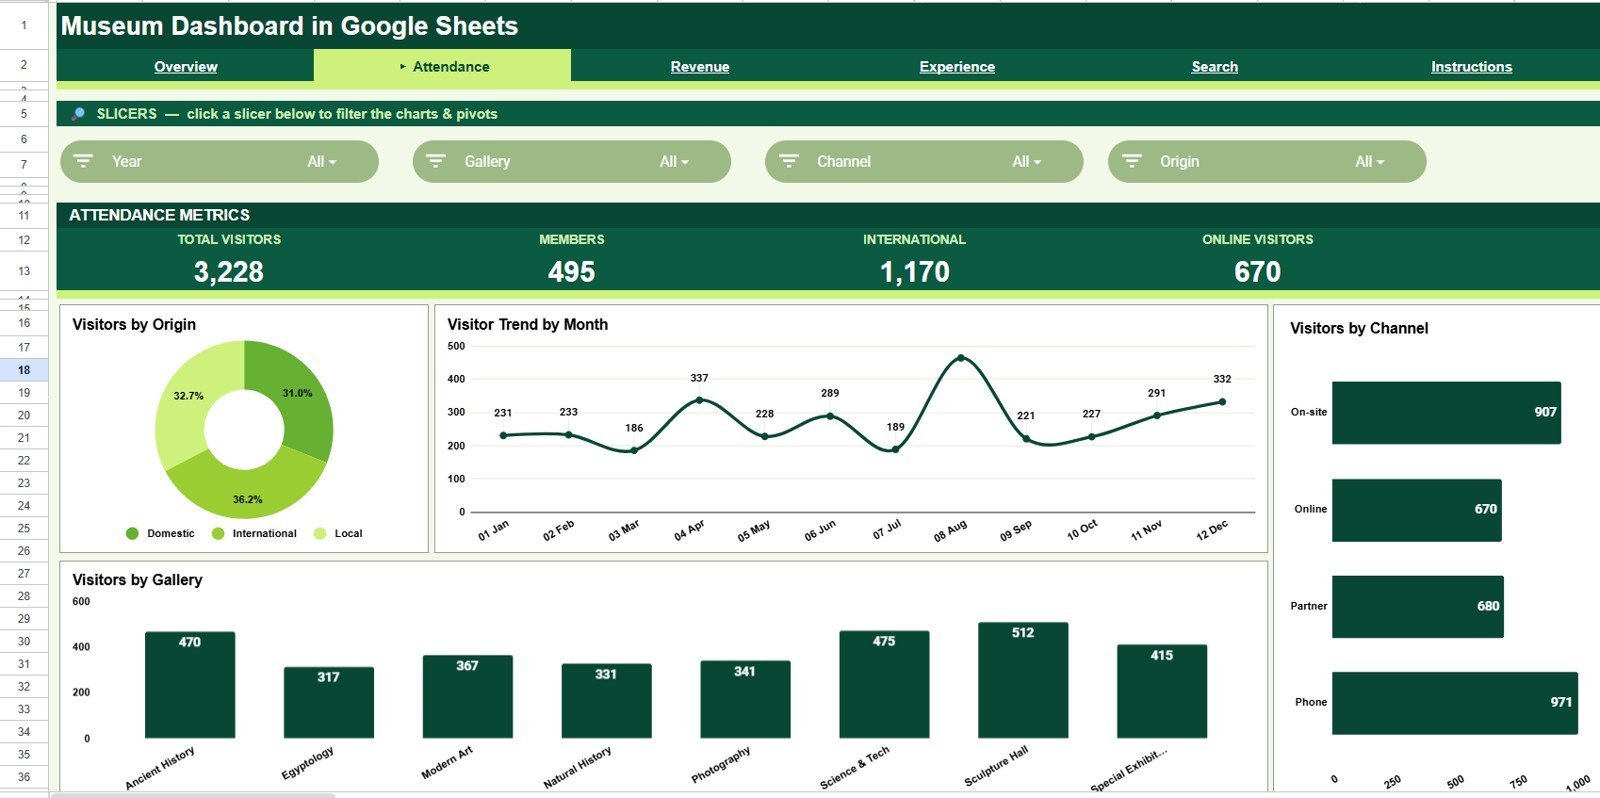
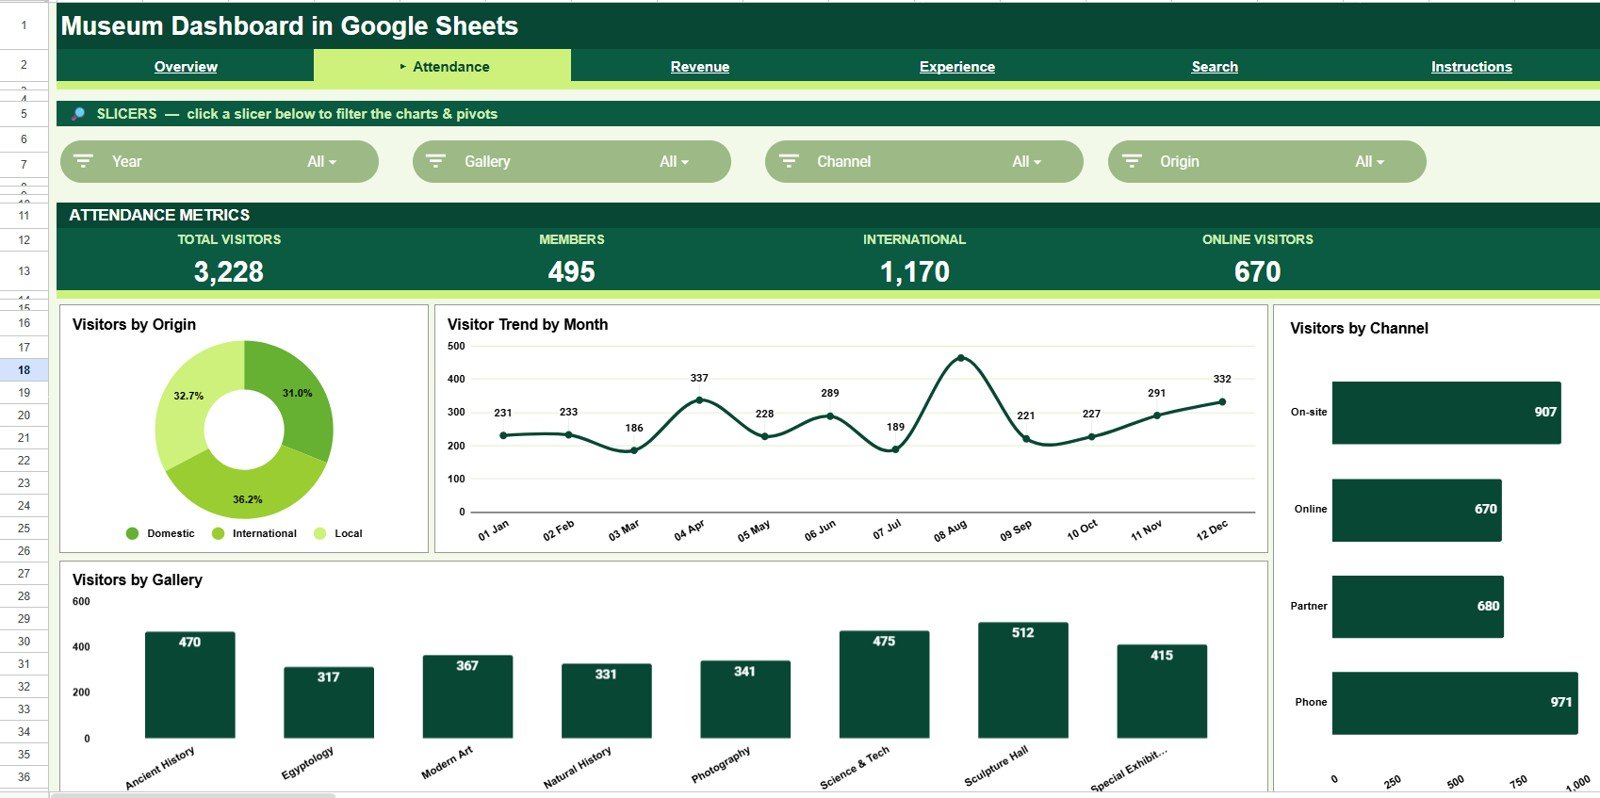
2 – Attendance
The Attendance tab focuses on visitor movement and source patterns.
Visitors by Origin: This chart shows whether attendance comes from local, domestic, international, school, or other origin groups.
Use it to support tourism, outreach, and partnership decisions.
Visitors by Month: This monthly view highlights busy and slow periods.
Use it to plan exhibit openings, promotions, guides, and front-desk coverage.
Visitors by Channel: This chart compares attendance by booking or marketing channel.
Use it to see whether online, walk-in, partner, school, or campaign channels are working.
Visitors by Gallery: This view compares visitor volume across galleries.
Use it to understand crowd distribution and identify high-interest exhibition areas.
Attendance
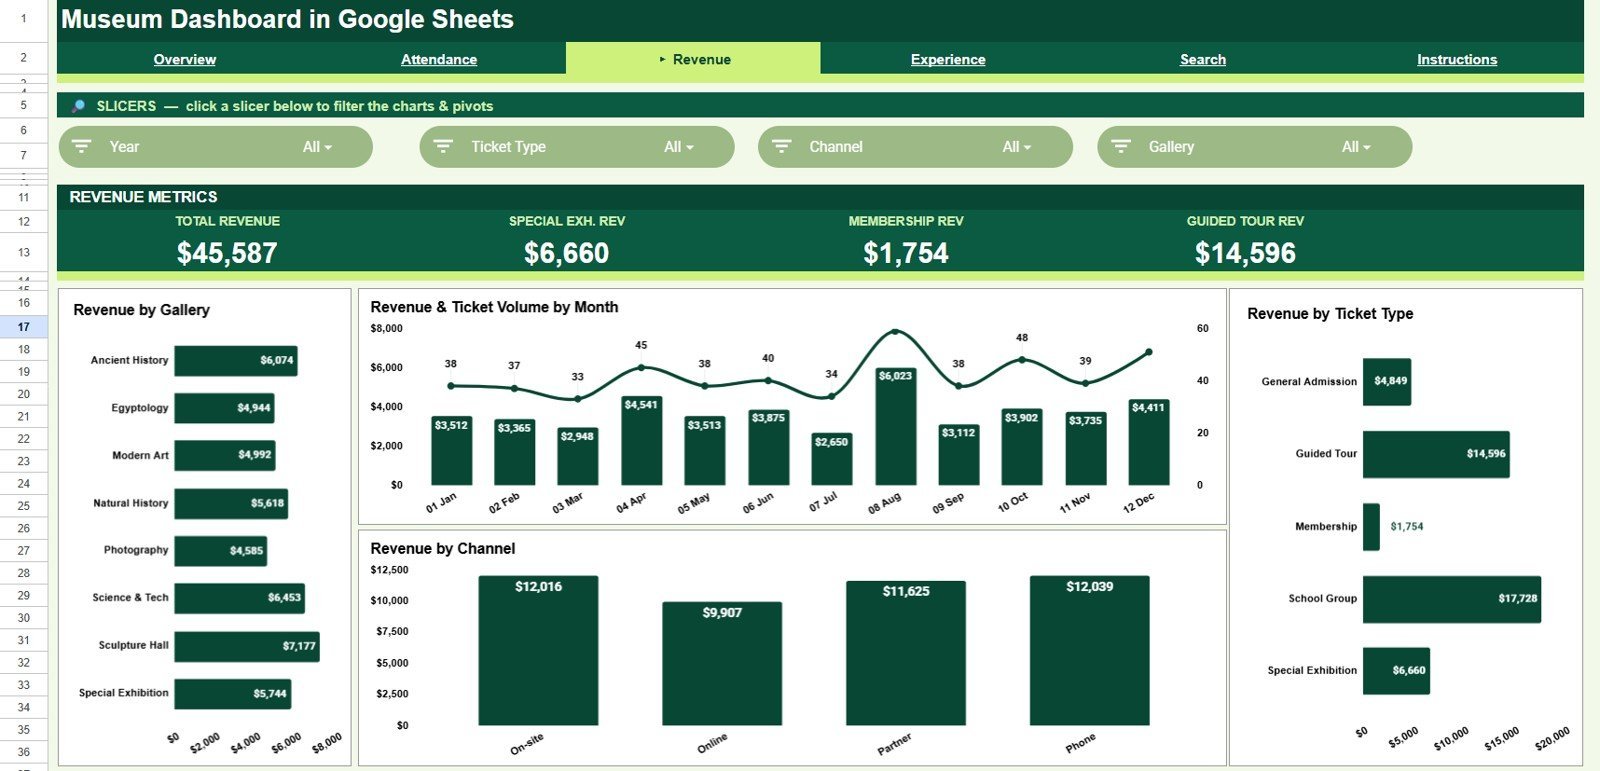
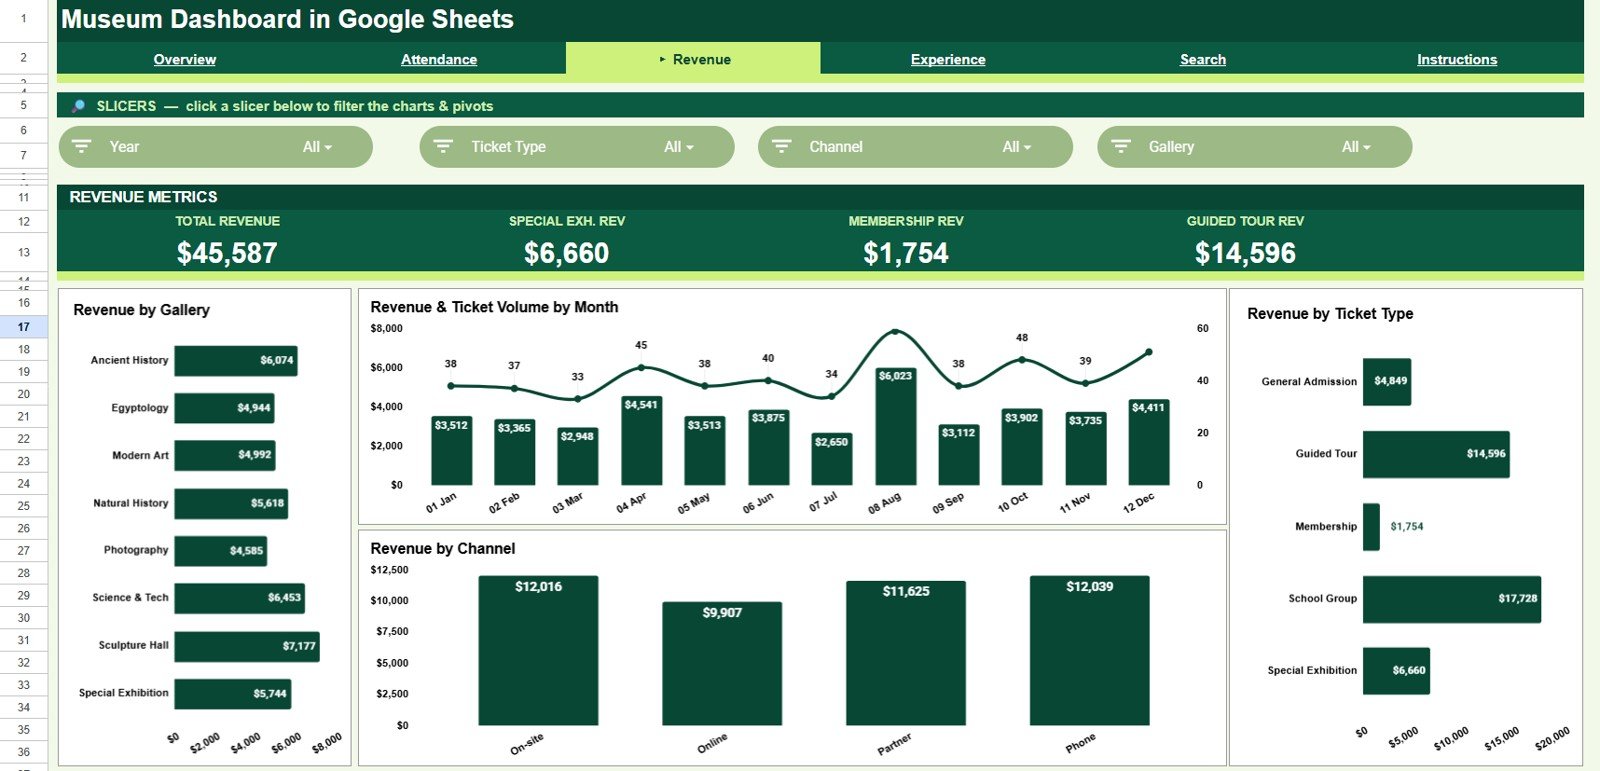
3 – Revenue
The Revenue tab explains where museum income is coming from and how it changes over time.
Revenue by Gallery: This chart compares sales by gallery or exhibit area.
Use it to connect visitor interest with financial contribution.
Revenue and Ticket Volume by Month: This combo view shows money and ticket counts together.
Use it to spot whether revenue growth is driven by higher attendance or higher average price.
Revenue by Ticket Type: This chart breaks down income by ticket category.
Use it to evaluate pricing, concessions, memberships, and group ticket performance.
Revenue by Channel: This view compares revenue by sales channel.
Use it to review direct booking, walk-in, partner, and campaign effectiveness.
Revenue
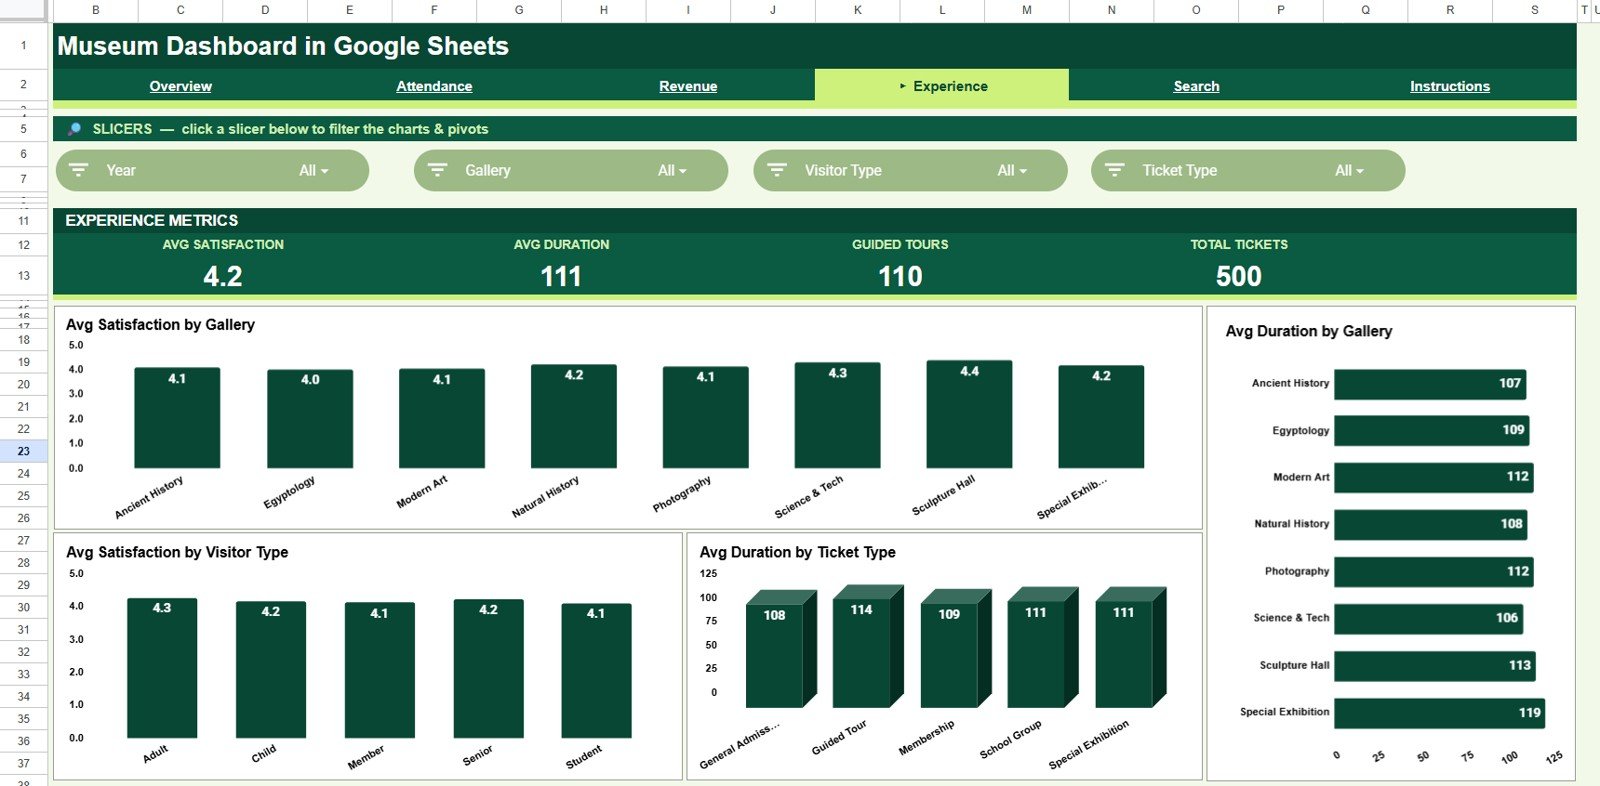
4 – Experience
The Experience tab tracks satisfaction and visit duration so teams can connect visitor quality with gallery performance.
Avg Satisfaction by Gallery: This chart compares visitor satisfaction across galleries.
Use it to find exhibits that delight visitors and areas that may need better interpretation.
Avg Duration by Gallery: This view shows how long visitors spend in each gallery.
Use it to evaluate exhibit engagement, layout, and dwell time.
Avg Satisfaction by Visitor Type: This chart compares satisfaction across audience groups.
Use it to understand whether members, families, students, or tourists need different experiences.
Avg Duration by Ticket Type: This view connects ticket categories with visit length.
Use it to see whether premium, member, group, or general admission visitors behave differently.
Experience
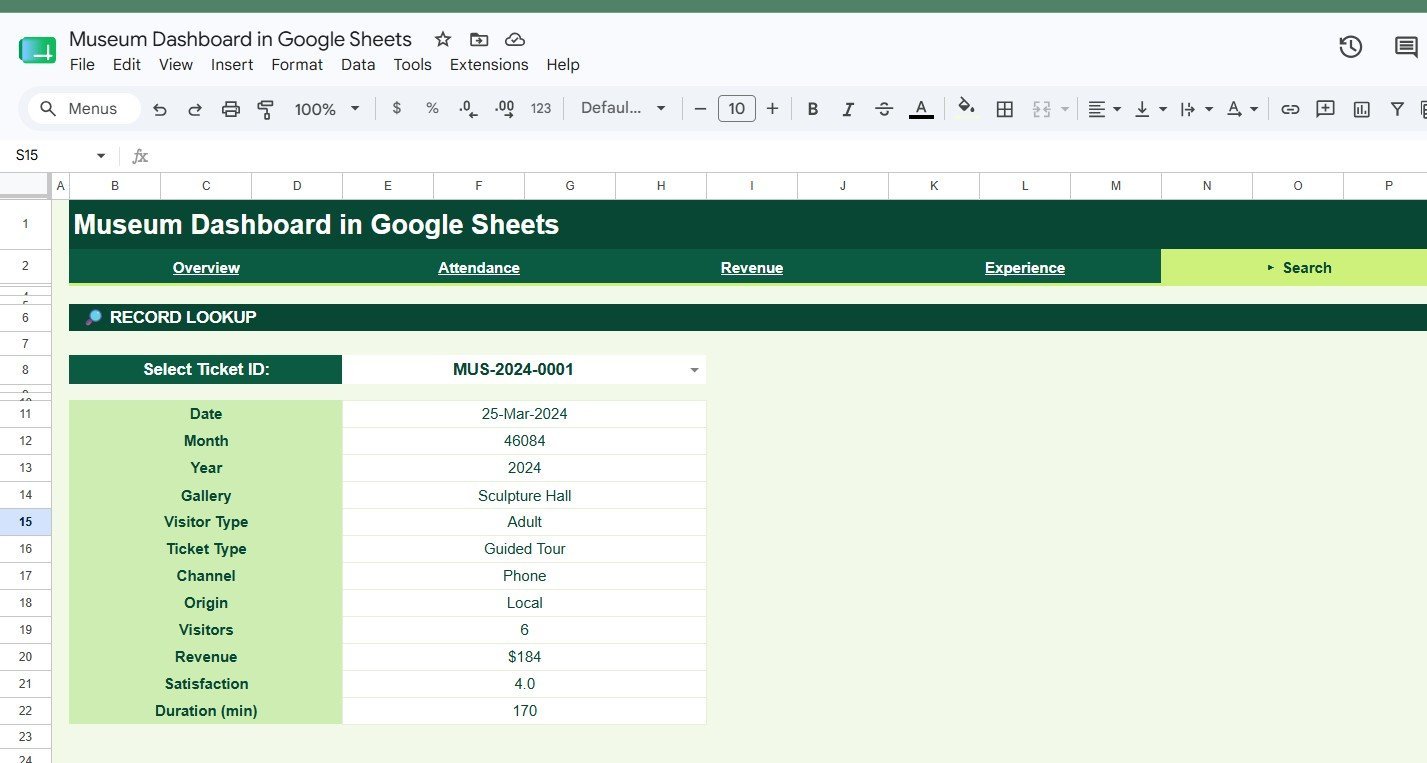
5 – Search
The Search tab helps teams look up a single record without scrolling the data sheet.
Record Lookup by Ticket ID: Select or enter a Ticket ID to locate one transaction quickly.
This is useful during guest service questions, audit checks, or reconciliation work.
Ticket Details by Selected Ticket ID: The selected record returns ticket information in a readable panel.
Use it to review visitor type, gallery, revenue, channel, satisfaction, and other fields tied to that ticket.

Search
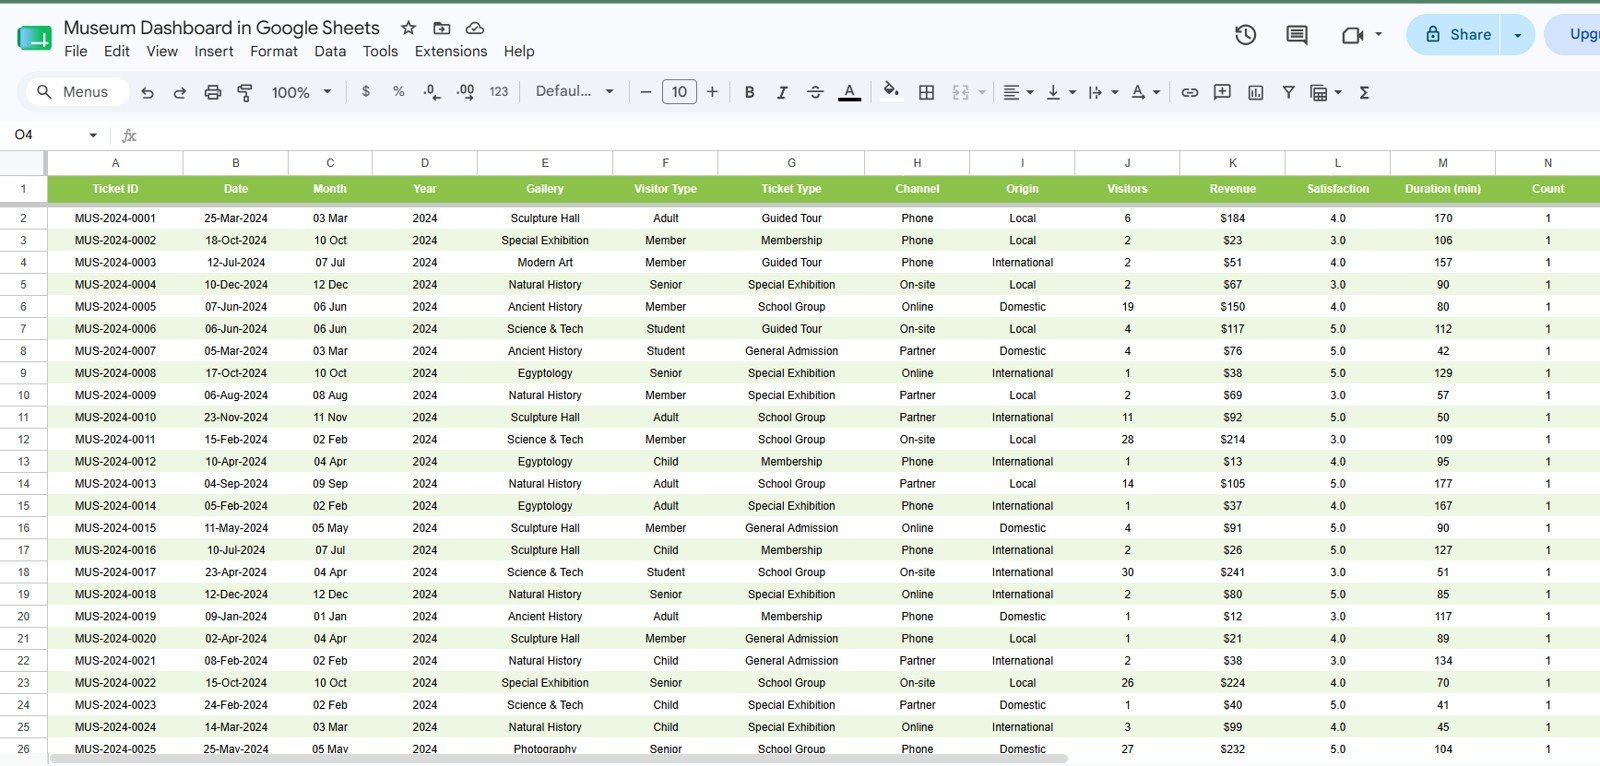
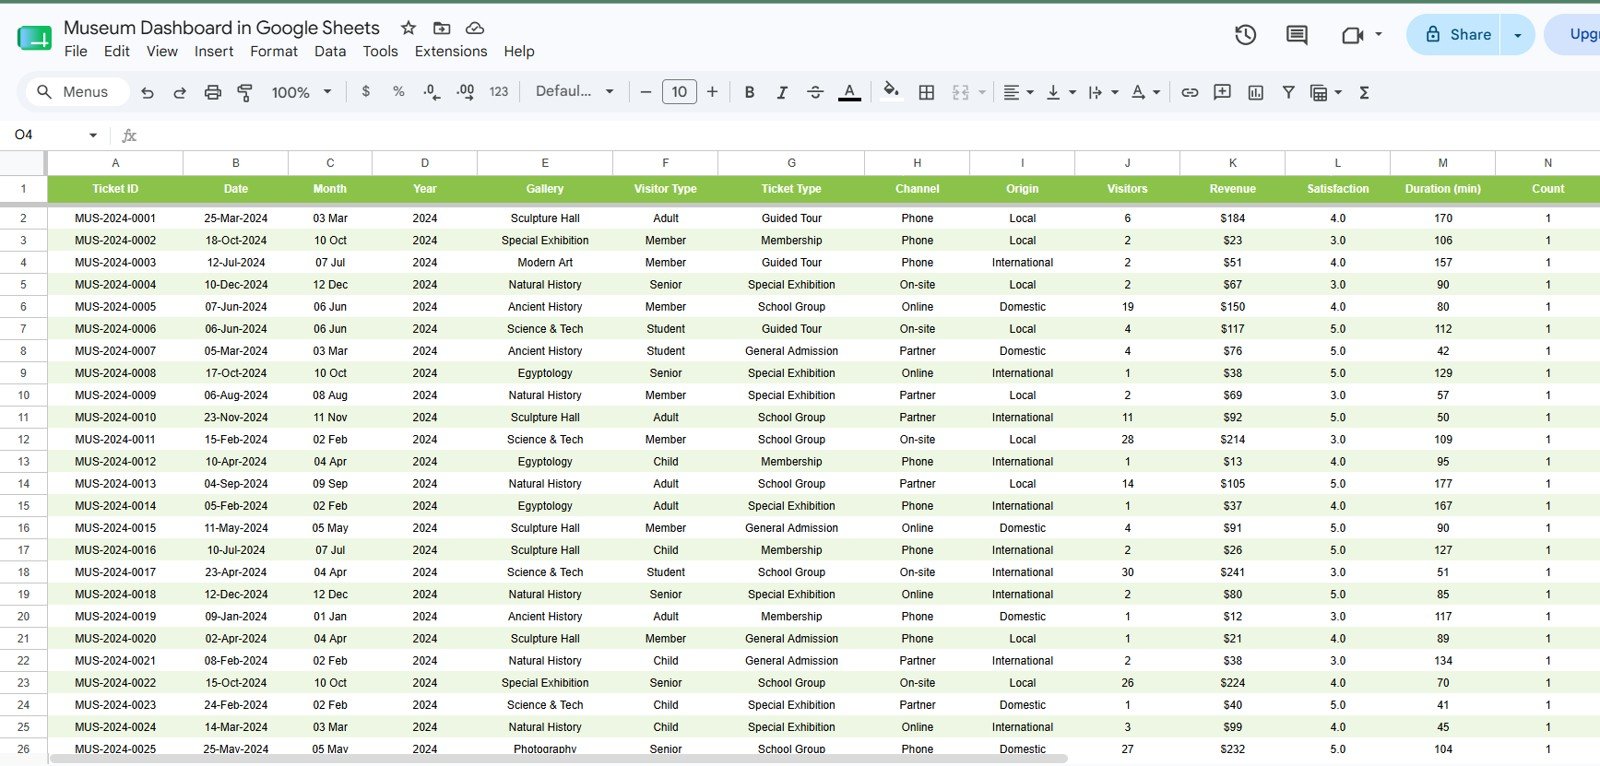
6 – Data Sheet Tab
The Data Sheet tab is the source table. Add your museum records in the same column format so cards, charts, slicers, and lookup outputs keep working.
Data Sheet tab
Museum Dashboard in Google Sheets vs. Microsoft Excel Dashboard vs. Paid CRM/SaaS – Where This Fits
| Feature | This Google Sheets template | Microsoft Excel dashboard | Paid museum SaaS |
|---|---|---|---|
| Cost | $9.99 one-time | One-time template or Microsoft license | Monthly or annual subscription |
| Platform | Google Sheets in the browser | Excel desktop or web | Vendor-hosted system |
| Setup time | Copy the sheet, add data, review charts | Open workbook and refresh | Implementation and onboarding |
| Team collaboration | Real-time sharing through Google Drive | File sharing or Microsoft 365 | Usually included |
| Mobile access | Google Sheets app or browser | Limited by workbook layout | Usually included |
| Custom fields | Editable sheet columns and formulas | Editable workbook fields | Depends on vendor permissions |
| Year-1 cost at 5 users | $9.99 plus Google account access | Template cost plus any Microsoft licensing | Often hundreds or thousands |
| Museum analysis | Visitors, revenue, galleries, tickets, satisfaction, duration, and lookup | Strong offline option | Best when you need ticketing, CRM, donor, and entry operations |
Who This Template Is For – and Who It’s Not For
This template is for museum directors, gallery managers, visitor-experience teams, education and outreach coordinators, finance staff, and cultural institution analysts who need a collaborative Google Sheets reporting tool.
It is not a ticketing system, donor CRM, access-control tool, POS system, or live entry scanner. Use it as a reporting dashboard after your visitor and ticket data is available in a structured table.
How to Use the Museum Dashboard in Google Sheets
- Open the PDF guide in your download and click the Google Sheets copy link.
- Create your own editable copy in Google Drive.
- Go to the Data Sheet tab and replace sample rows with your museum records.
- Keep the same column structure so charts and lookups continue to work.
- Use slicers and page tabs to review attendance, revenue, experience, and ticket details.
Real-World Use Cases
Marina, museum operations director: reviews monthly visitors, revenue, and gallery performance before trustee meetings.
Daniel, visitor-experience manager: checks satisfaction and duration by gallery to improve signage, guided tours, and exhibit flow.
Priya, finance and ticketing lead: uses Revenue by Ticket Type and the Ticket ID lookup for reconciliation and pricing review.
Frequently Asked Questions
What software do I need?
You need a Google account and access to Google Sheets. No Excel license or add-in is required.
How many tabs are included?
The template includes 6 tabs: Overview, Attendance, Revenue, Experience, Search, and Data Sheet.
Can I customize the dashboard?
Yes. You can edit formulas, labels, charts, colors, slicers, and source fields after making your own copy.
Does it replace museum ticketing software?
No. This is a reporting dashboard, not a ticket sales, CRM, donor, or access-control system.
Can multiple team members use it?
Yes. Because it runs in Google Sheets, you can share the file with team members through Google Drive permissions.
What happens if I add new rows?
Add new rows in the same format on the Data Sheet tab, then review the updated dashboard outputs.
About the Author
Built by PK – Microsoft Certified Professional with 15+ years of Excel, Google Sheets, and Power BI experience. Founder of NextGenTemplates, reaching 300K+ subscribers across YouTube channels. Every template is hand-built and tested before release.
Explore Related Templates
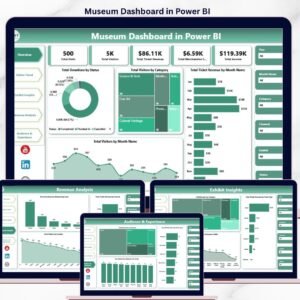
Browse more Google Sheets templates and Google Sheets dashboard templates. Related options include Museum Dashboard in Excel, Museum Dashboard in Power BI, Museums & Cultural Centres KPI Dashboard in Power BI, and Heritage Tourism KPI Dashboard in Power BI.
Watch the step-by-step video Demo:
Download the Museum Dashboard in Google Sheets today and start reviewing museum attendance, revenue, gallery performance, ticket mix, and visitor experience in one collaborative spreadsheet.
Last updated: July 5, 2026


Reviews
There are no reviews yet.