


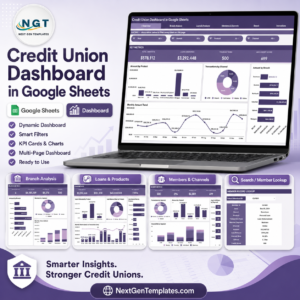
Credit Union Dashboard in Google Sheets gives credit union teams 6 worksheet tabs, 4 high-level KPI cards, 16 analysis charts, slicers, a member lookup sheet, and a structured data sheet for recurring portfolio review. Built for deposits, loan disbursements, transactions, member segments, branch performance, channel mix, product mix, loan balances, interest rates, officers, and credit scores, it helps teams replace manual spreadsheet reporting with one editable dashboard. More than 8,400 teams in 40+ countries use NextGenTemplates for spreadsheet and BI templates. Your purchase is backed by a 7-day file-match review if the delivered template does not match this description.
Key Features of Credit Union Dashboard in Google Sheets
- 6 Google Sheets tabs covering Overview, Branch Analysis, Loans & Products, Members & Channels, Search Sheet, and Data Sheet.
- 4 executive KPI cards for Total Deposits, Loans Disbursed, Transactions, and Avg Credit Score.
- 16 dashboard charts for product, channel, branch, month, member segment, loan balance, interest rate, and credit score analysis.
- Interactive slicers to filter the dashboard quickly and review focused credit union performance.
- Branch-level analysis for amount, member segment, monthly volume, and product mix by branch.
- Loan and product views to compare disbursed loans, loan balance share, average interest rate, and monthly activity.
- Member lookup sheet for fast record search by Member ID with date, branch, product, channel, amount, officer, and credit score details.
- Editable data sheet so your team can replace the sample rows while keeping the same field structure.
What’s Inside the Credit Union Dashboard in Google Sheets
Overview Page
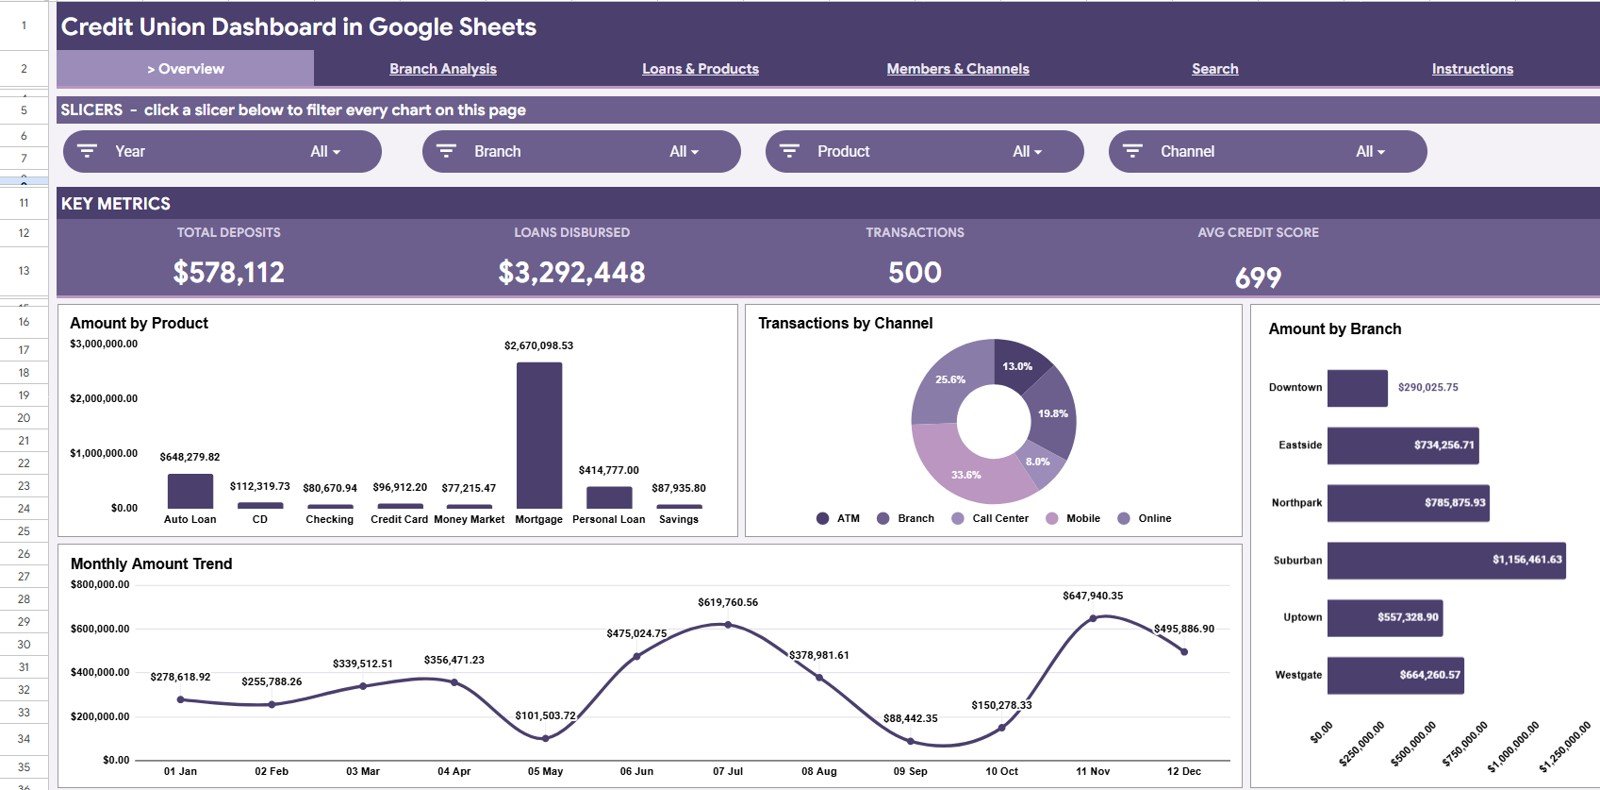
The Overview page gives leadership a fast credit union snapshot. The top cards show Total Deposits, Loans Disbursed, Transactions, and Avg Credit Score so managers can review liquidity, lending, member activity, and portfolio quality in one view.
Amount by Product: This chart compares total amount across deposit, loan, card, and other product categories. It helps teams see which offerings drive the most financial activity.
Transactions by Channel: This chart shows transaction volume across channels such as branch, online, mobile, ATM, or call center. It helps digital and branch teams understand how members prefer to interact.
Amount by Branch: This chart ranks branch contribution by total amount. It helps regional leaders identify strong branches and locations that may need coaching or member outreach.
Monthly Amount by Month: This chart shows monthly movement in total amount. It helps managers spot seasonal changes, campaign impact, and unusual activity trends.
Credit Union Dashboard in Google Sheets
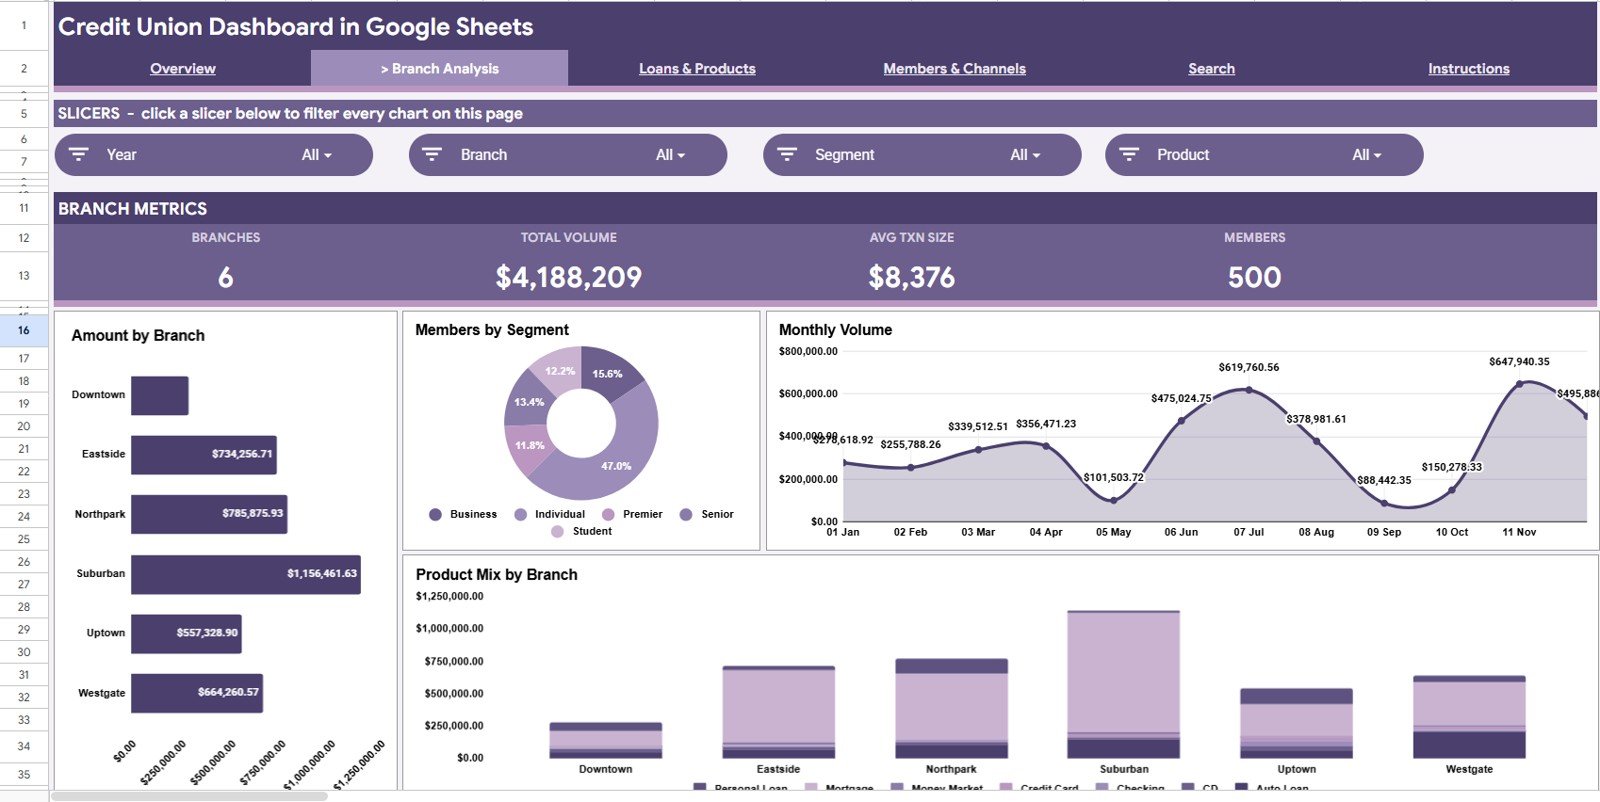
Branch Analysis
The Branch Analysis tab is built for branch managers and regional leaders who need a clear comparison across locations. It focuses on branch amount, member mix, volume trends, and product distribution.
Amount by Branch: This chart compares financial activity by branch. It helps managers quickly identify high-volume and low-volume locations.
Members by Segment: This chart breaks members into segments such as retail, business, youth, premium, or other available groups. It helps teams align offers and outreach to the right member base.
Monthly Volume by Month: This chart tracks monthly transaction or activity volume. It helps branch teams see whether activity is rising, falling, or staying stable.
Product Mix by Branch: This chart shows which products are most active in each branch. It helps identify cross-sell opportunities and branch-specific product demand.
Branch Analysis
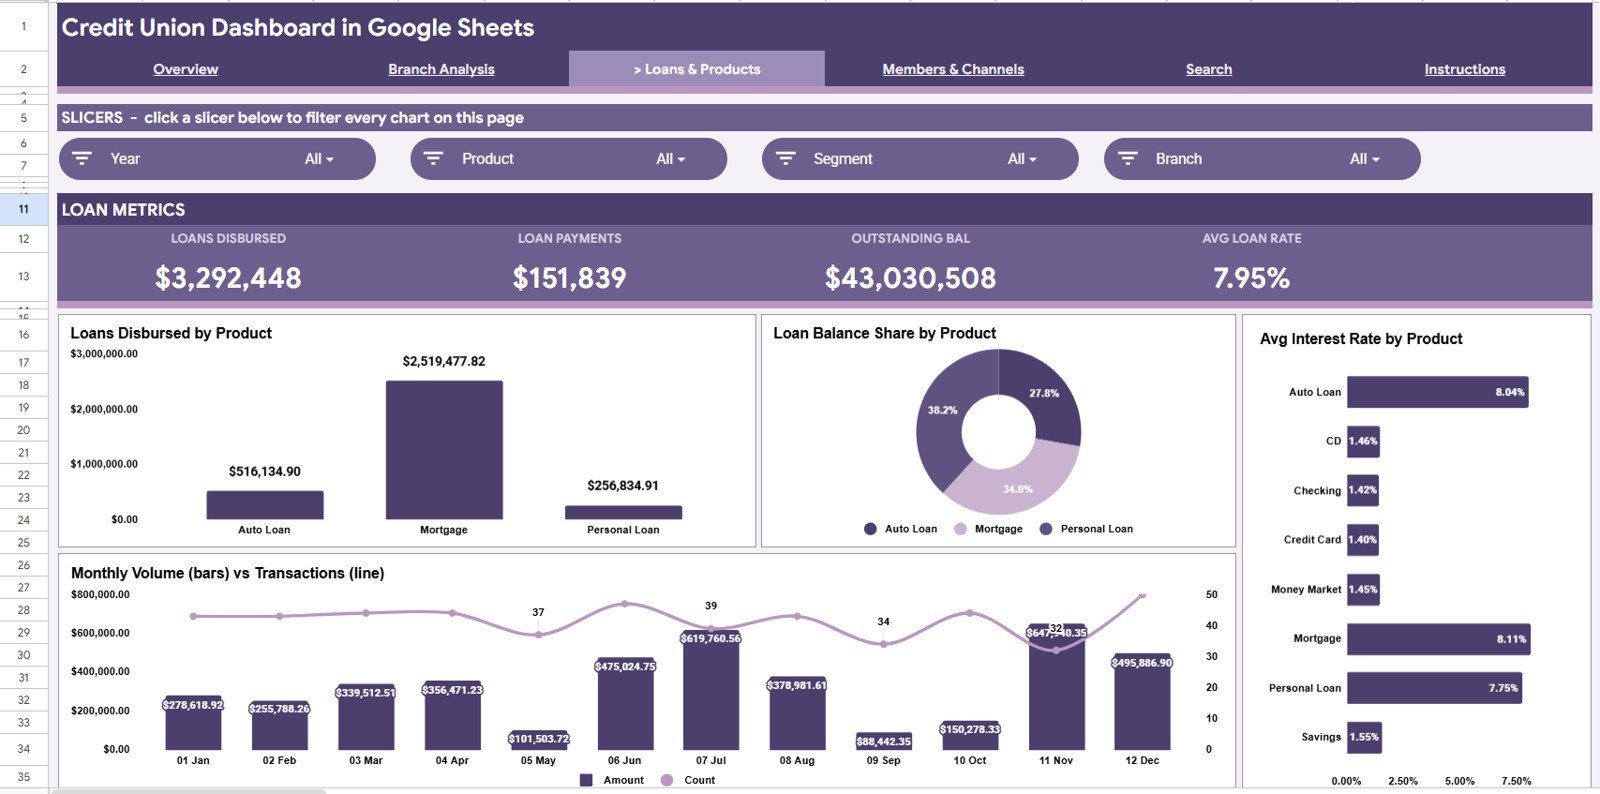
Loans & Products
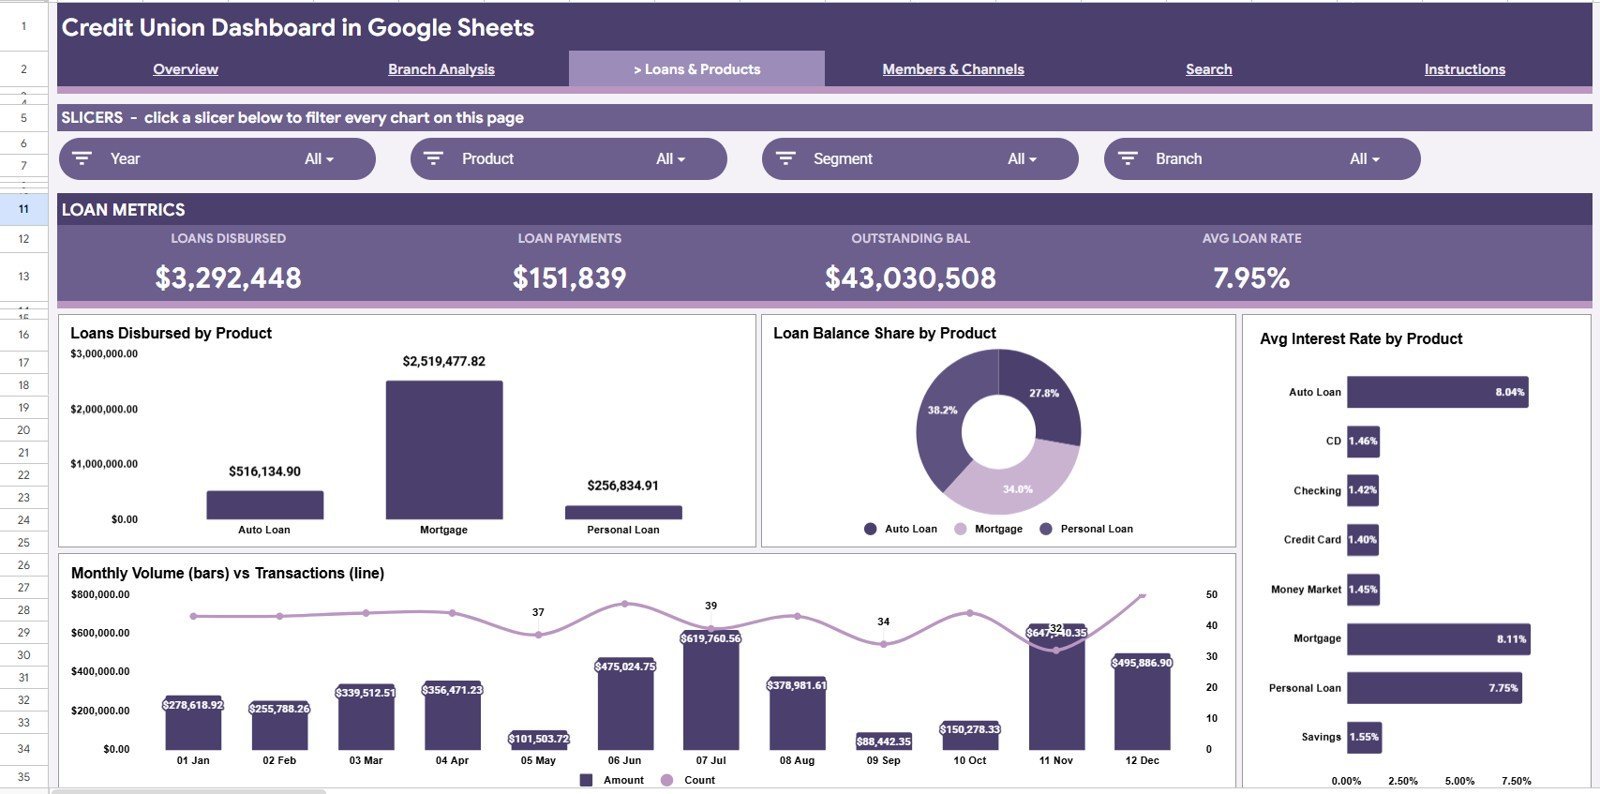
The Loans & Products tab helps lending, finance, and product teams review loan funding and product performance. It connects disbursement, balance, rate, and monthly activity into one page.
Loans Disbursed by Product: This chart compares loan disbursement across product types. It helps teams see which loan products are driving funded activity.
Loan Balance Share by Product: This chart shows how the outstanding balance is distributed by product. It helps credit teams understand portfolio concentration.
Avg Interest Rate by Product: This chart compares average interest rate across products. It supports pricing review and product-level margin discussions.
Monthly Volume and Transactions by Month: This chart connects monthly activity volume with transaction count. It helps managers understand whether growth is coming from larger amounts, more transactions, or both.
Loans & Products
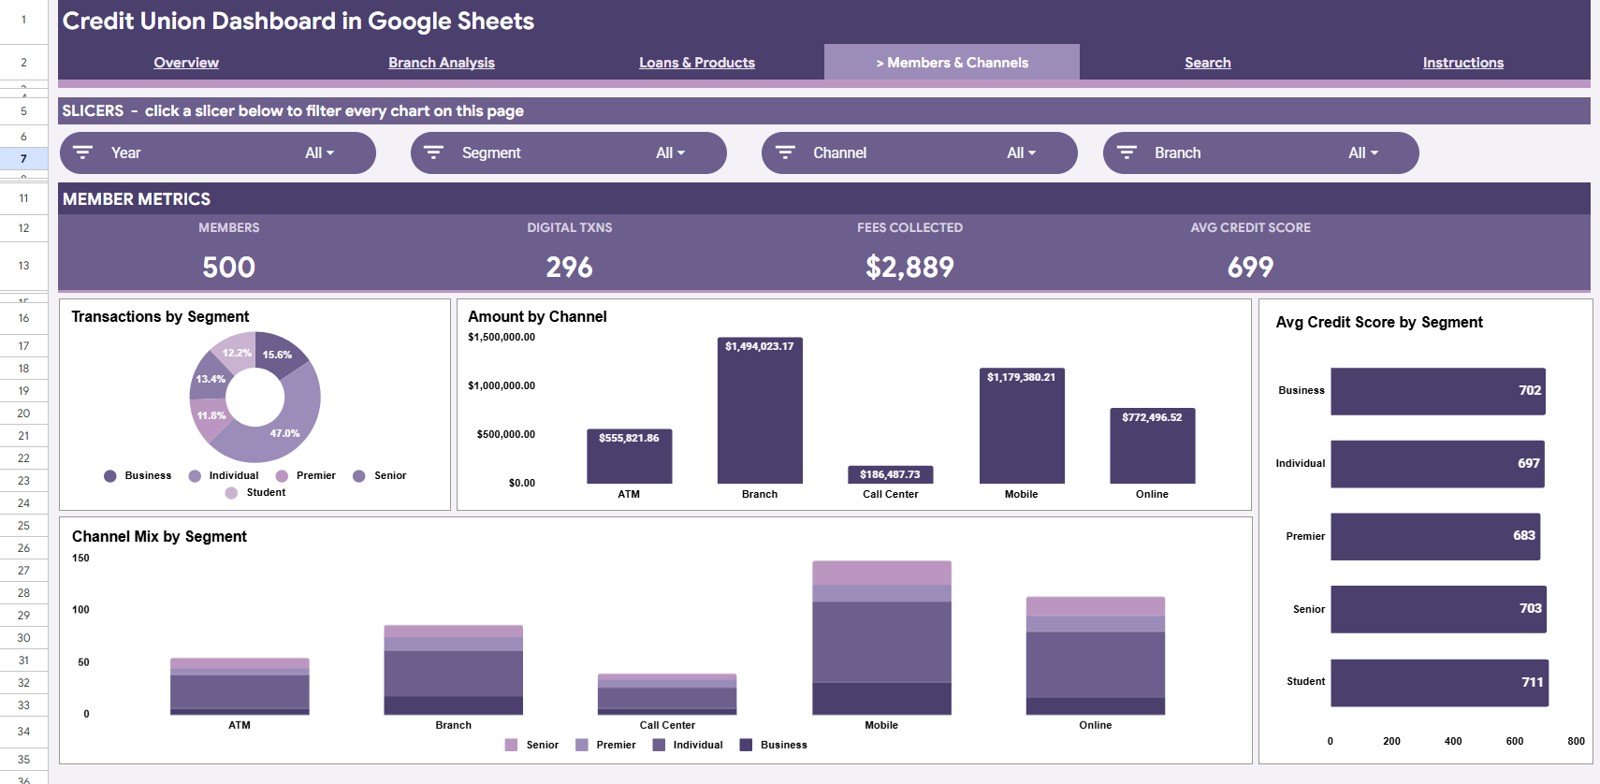
Members & Channels
The Members & Channels tab focuses on member behavior, channel usage, and credit quality by segment. It is useful for member services, marketing, branch operations, and digital banking teams.
Transactions by Segment: This chart compares transaction volume by member segment. It helps teams understand which groups are most active.
Amount by Channel: This chart shows amount by channel. It helps managers compare branch, mobile, online, ATM, and other member touchpoints.
Avg Credit Score by Segment: This chart compares average credit score across member groups. It helps lending and risk teams review credit quality by segment.
Channel Mix by Segment: This chart shows how each member segment uses available channels. It helps teams target digital adoption, branch service, or call center support more precisely.
Members & Channels
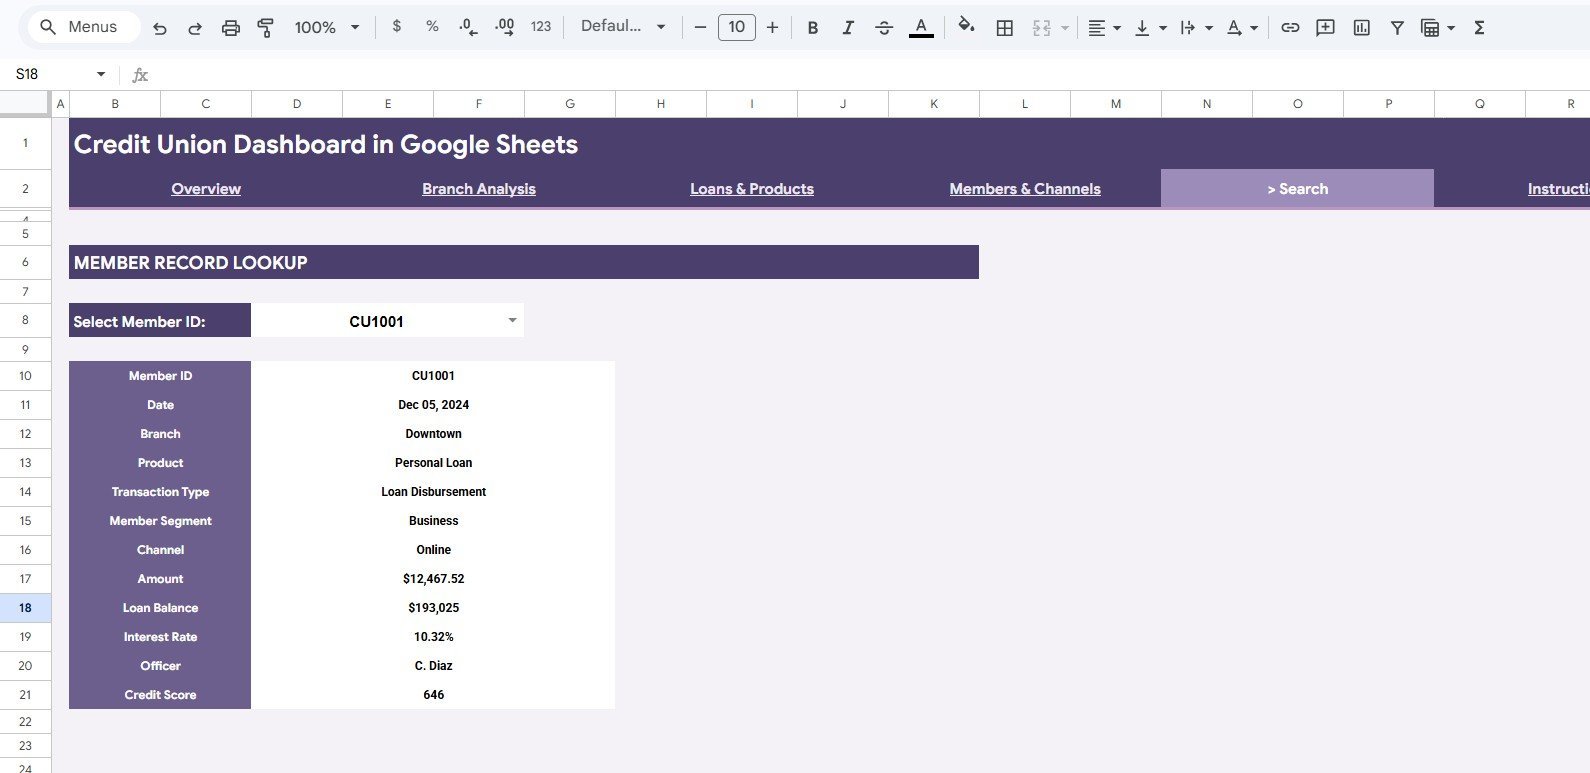
Search Sheet Tab
The Search Sheet tab gives users a member record lookup. Select a Member ID and quickly view the matching Date, Branch, Product, Transaction Type, Member Segment, Channel, Amount, Loan Balance, Interest Rate, Officer, and Credit Score.

Search Sheet tab
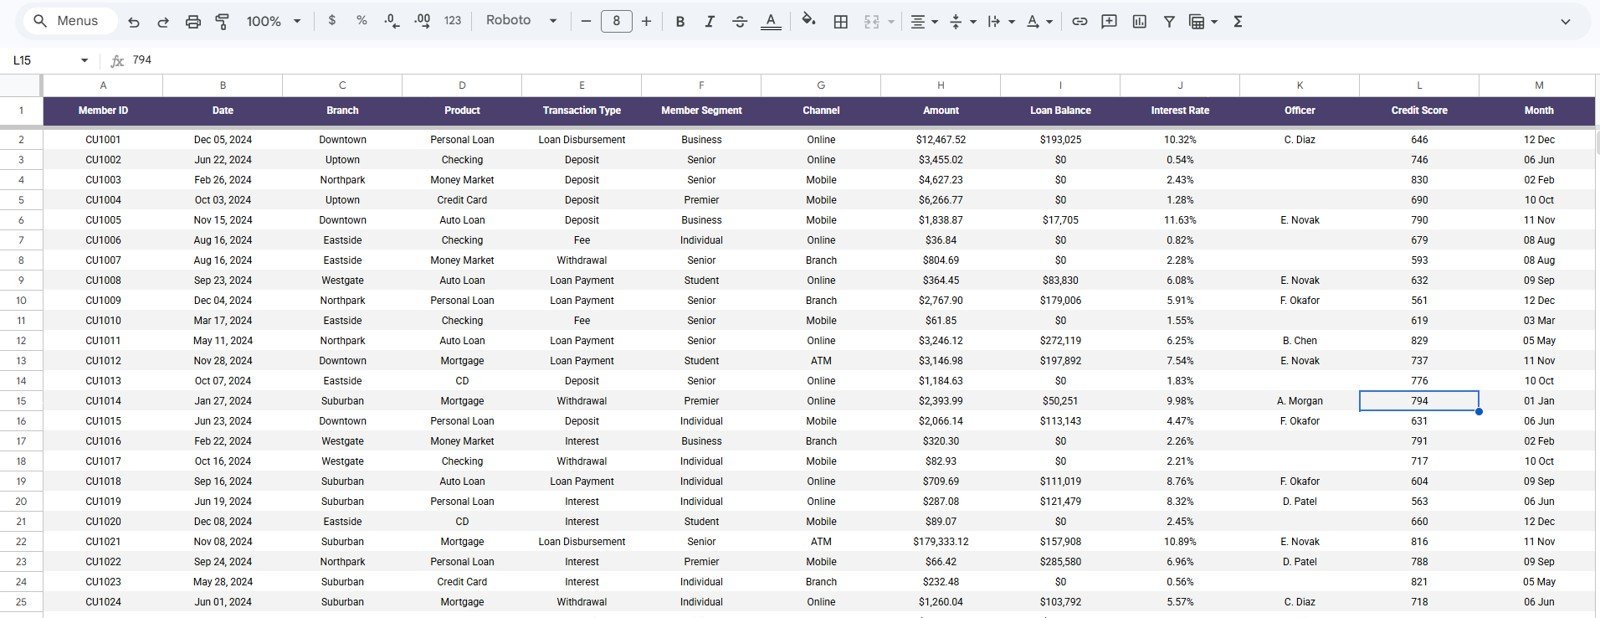
Data Sheet Tab
The Data Sheet is where you add your credit union records in the same format as the sample data. Keep the column structure consistent so the dashboard charts, slicers, cards, and lookup fields continue to update correctly.

Data Sheet tab
Credit Union Dashboard in Google Sheets vs. Microsoft Excel Dashboard vs. Paid Banking SaaS – Where This Fits
| Feature | This Google Sheets dashboard | Microsoft Excel dashboard | Paid banking SaaS |
|---|---|---|---|
| Cost | $9.99 sale price, one-time | Template or custom workbook cost | Monthly or annual subscription |
| Platform | Google Sheets in browser | Microsoft Excel desktop or web | Vendor-hosted system |
| Setup time | Copy sheet, replace sample data, use slicers | Open file, update data, refresh | Implementation and configuration |
| Real-time team collaboration | Built into Google Sheets sharing | Requires OneDrive or SharePoint | Usually included by plan |
| Mobile access | Google Sheets app or browser | Excel mobile with limitations | Vendor app or browser |
| Customizable fields | Editable sheet, formulas, charts, and fields | Editable workbook | Limited by vendor permissions |
| Share with link | Yes, using Google Drive permissions | Possible through Microsoft cloud | Role-based vendor sharing |
| Year-1 cost at 5 users | $9.99 plus Google Workspace if applicable | Template cost plus Microsoft licensing if applicable | Often hundreds or thousands |
| Credit union pages | Overview, branch, loans, members, search, and data | Depends on workbook design | Depends on module purchased |
Who This Template Is For – and Who It’s Not For
This template is for credit union managers, branch leaders, lending teams, finance analysts, member services teams, operations teams, and consultants who need a reusable Google Sheets reporting layer for deposits, loans, transactions, products, member segments, branch performance, channel usage, and credit scores.
It is not a core banking system, loan origination system, live fraud monitoring tool, payment processor, member CRM, or regulatory filing platform. Teams that need automatic core banking integration, real-time alerts, role-based enterprise controls, or audited production workflows should use this as an analysis layer after exporting approved data.
How to Use the Credit Union Dashboard in Google Sheets
- Open the PDF guide included with your purchase and use the Google Sheets copy link.
- Create your editable copy in Google Drive.
- Go to the Data Sheet and replace sample records with your own credit union data.
- Keep the same columns for Date, Branch, Product, Transaction Type, Member Segment, Channel, Amount, Loan Balance, Interest Rate, Officer, and Credit Score.
- Use slicers on the dashboard pages to filter by branch, product, member segment, channel, month, or other available fields.
- Use the Search Sheet to look up a member record by Member ID.
Real-World Use Cases
Maria, credit union CFO: reviews Total Deposits, Loans Disbursed, Transactions, and Avg Credit Score before the monthly management meeting, then filters by branch to explain growth drivers.
Devon, branch manager: uses Branch Analysis to compare amount by branch, members by segment, monthly volume, and product mix before coaching branch teams.
Priya, lending analyst: uses Loans & Products to monitor loan disbursement, loan balance share, average interest rate, and monthly transaction movement by product.
Frequently Asked Questions
What does the Credit Union Dashboard in Google Sheets track?
It tracks deposits, loans disbursed, transactions, average credit score, amount by product, transactions by channel, amount by branch, monthly amount, member segment, loan balance, interest rate, officer, and member record details.
How many tabs are included?
The template includes Overview, Branch Analysis, Loans & Products, Members & Channels, Search Sheet, and Data Sheet tabs.
Can I customize the dashboard?
Yes. You can edit source data, labels, charts, formulas, slicers, colors, and sheet names directly in Google Sheets.
Does it connect live to my core banking system?
No live connector is included. Add exported or approved data to the Data Sheet in the same column format.
Can multiple users work on it?
Yes. Because it runs in Google Sheets, you can share it with team members using Google Drive permissions.
Is this a subscription?
No. It is a one-time template purchase from NextGenTemplates. Google Workspace costs, if any, are separate.
About the Author
Built by PK – Microsoft Certified Professional with 15+ years of Excel, Google Sheets, and Power BI experience. Founder of NextGenTemplates, reaching 300K+ subscribers across YouTube channels. Every template is hand-built and tested before release.
Explore Related Templates
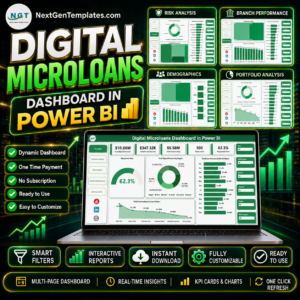
You may also like the Credit Union Dashboard in Power BI, Loan Portfolio KPI Dashboard in Google Sheets, Digital Microloans Dashboard in Excel, Digital Microloans Dashboard in Power BI, and Banking Report in Excel. Browse more Google Sheets templates and Google Sheets dashboard templates.
Watch the step-by-step video Demo:
Download the Credit Union Dashboard in Google Sheets to review deposits, loan disbursements, transactions, branches, products, members, channels, and credit scores in one editable dashboard.
Last updated: July 5, 2026.


Reviews
There are no reviews yet.