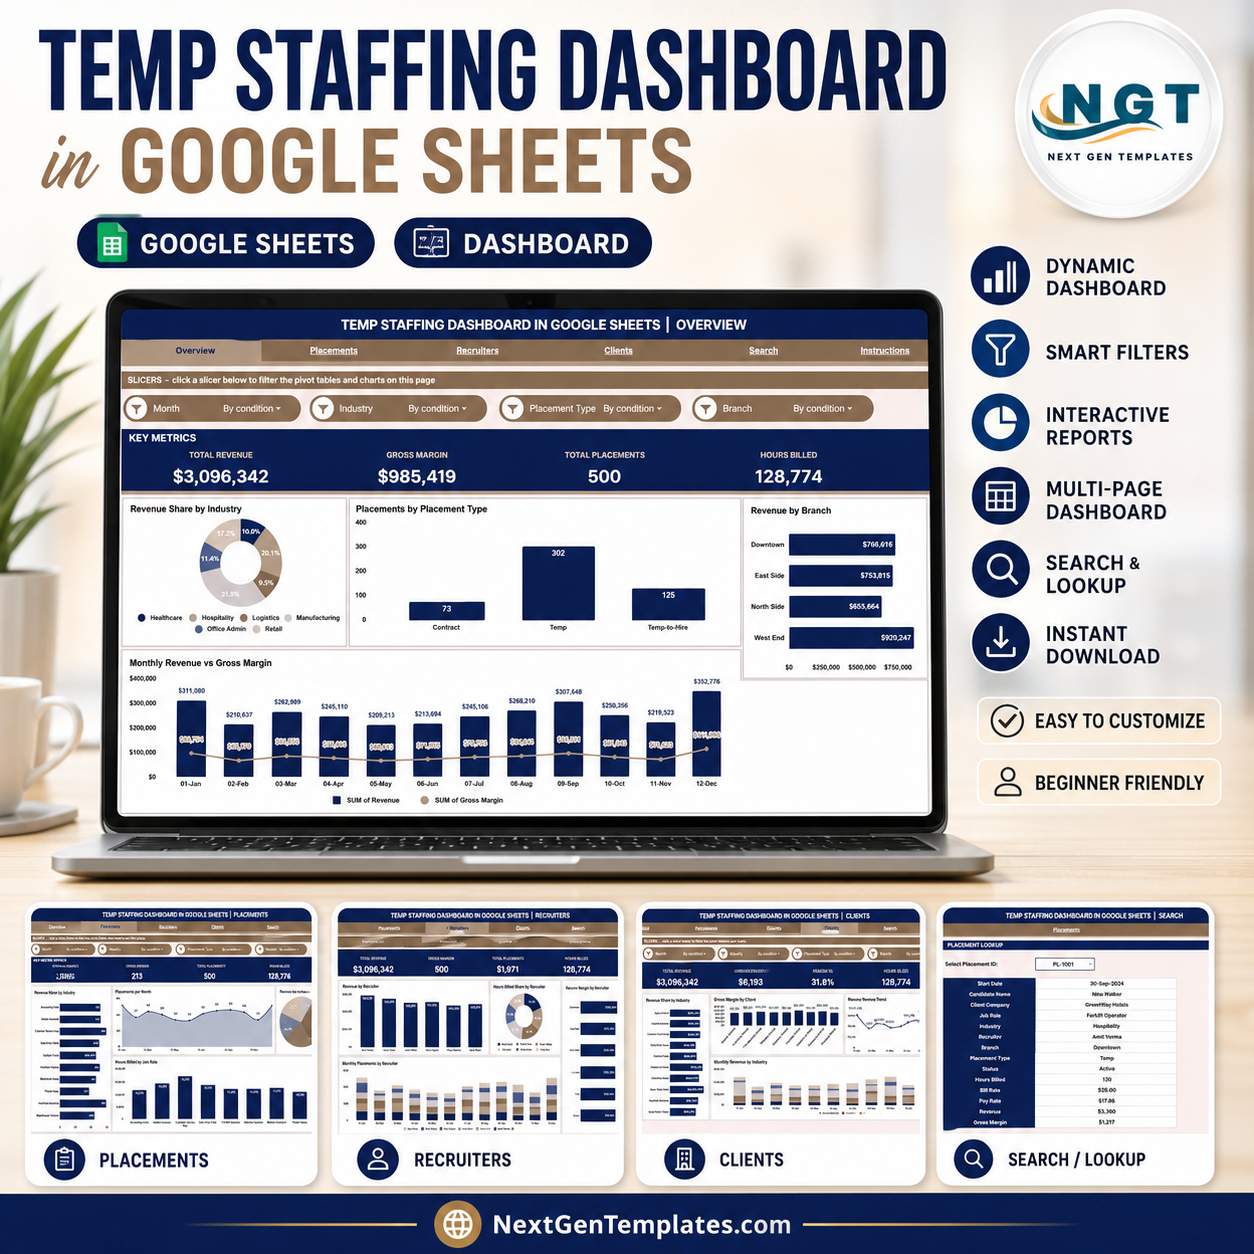


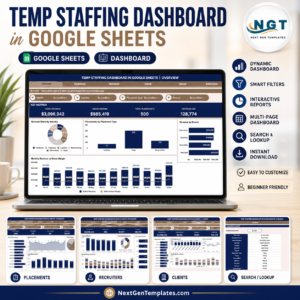
The Temp Staffing Dashboard in Google Sheets tracks 4 headline KPIs — Total Revenue, Gross Margin, Total Placements, and Hours Billed — across 6 interactive sheet tabs with 16 pre-built charts and one-click slicers. Setup takes under 10 minutes: replace the sample placement records and every chart, KPI card, and the Search sheet update automatically.
🌍 Join 8,400+ teams in 40+ countries using NextGenTemplates to replace paid SaaS tools with one-time-purchase Excel, Google Sheets, Power BI, and HTML templates.
✅ Instant download · One-time payment · No subscription · No per-user fees · Lifetime access
🔑 Key Features of the Temp Staffing Dashboard in Google Sheets
This Google Sheets temp staffing dashboard puts 4 KPI cards on the Overview page — Total Revenue, Gross Margin, Total Placements, and Hours Billed — all driven by native formulas that recalculate the moment you add a new placement row. No pivot tables to rebuild and no macros to enable.
The template contains 16 interactive charts across 4 analysis pages, covering revenue share by industry, placements by type and status, revenue by branch and recruiter, gross margin by recruiter and client, hours billed by job role, and revenue by month and industry. Native slicers on the Overview page filter the entire view by industry, branch, placement type, and date range in a single click.
A dedicated Search sheet returns the full record for any Placement ID — 13 fields including candidate name, client company, job role, industry, recruiter, branch, placement type, status, hours billed, bill rate, pay rate, revenue, and gross margin — making individual lookups instant during client calls, recruiter reviews, or margin audits.
📦 What’s Inside the Temp Staffing Dashboard in Google Sheets
1 — Overview Page
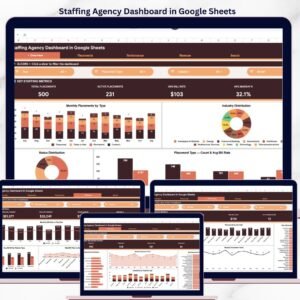
The Overview page opens with 4 KPI cards — Total Revenue, Gross Margin, Total Placements, and Hours Billed — above 4 charts and a row of slicers. Revenue Share by Industry shows which verticals drive your book of business. Placements by Placement Type splits volume across contract, temp, and temp-to-hire. Revenue by Branch compares office performance, and Revenue and Gross Margin by Month tracks the monthly trend of billings against margin.
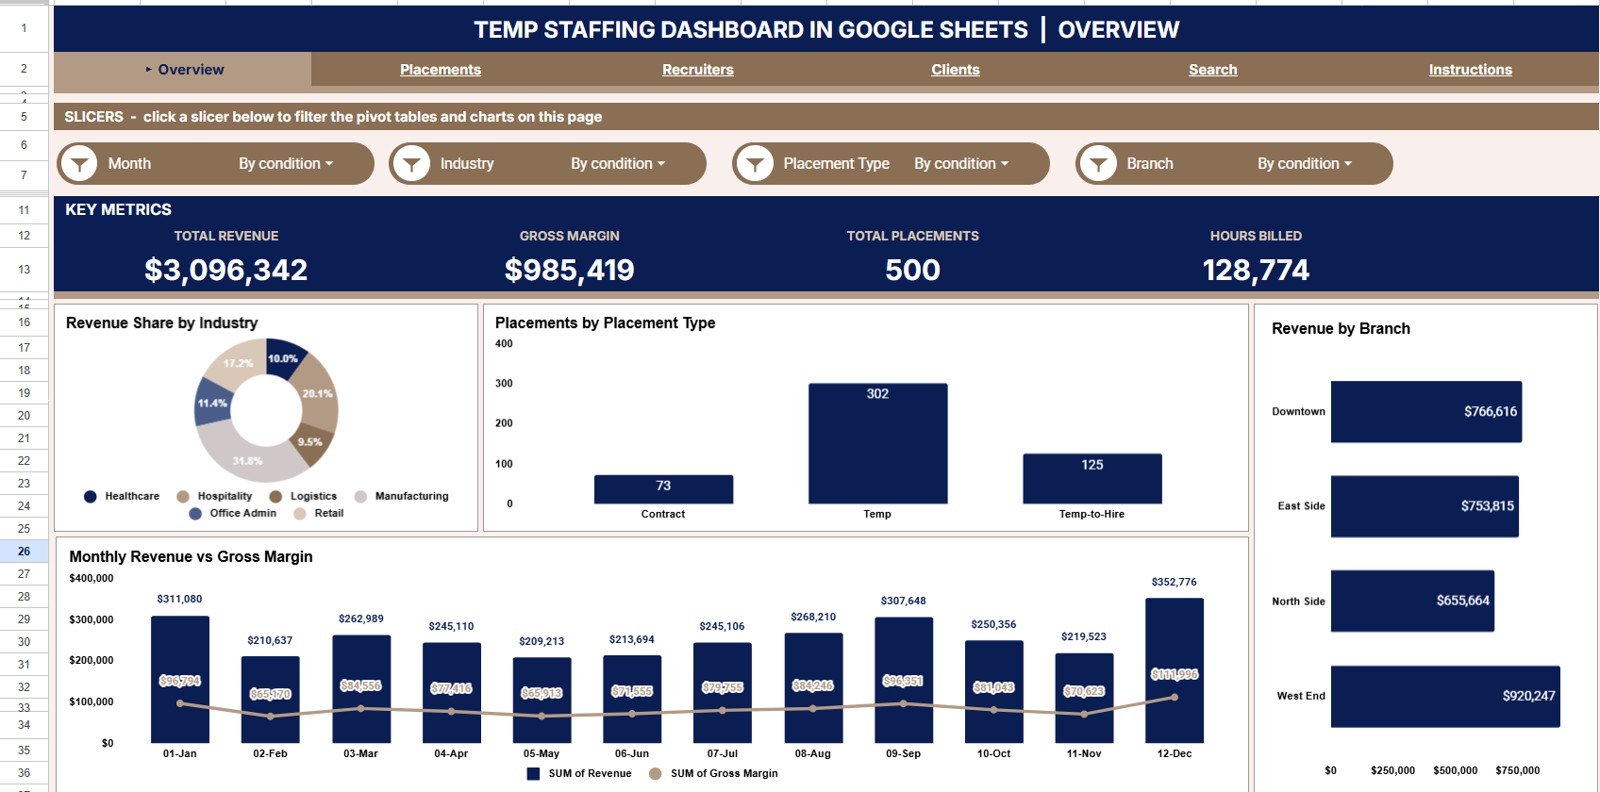
Temp Staffing Dashboard in Google Sheets — Overview Page
2 — Placements Page
The Placements page breaks down hiring activity with 4 charts. Placements by Job Role shows which titles you fill most often, Placements by Month reveals seasonal and growth patterns, Placements by Status separates active, completed, and cancelled placements, and Hours Billed by Job Role connects placement volume to billable output.
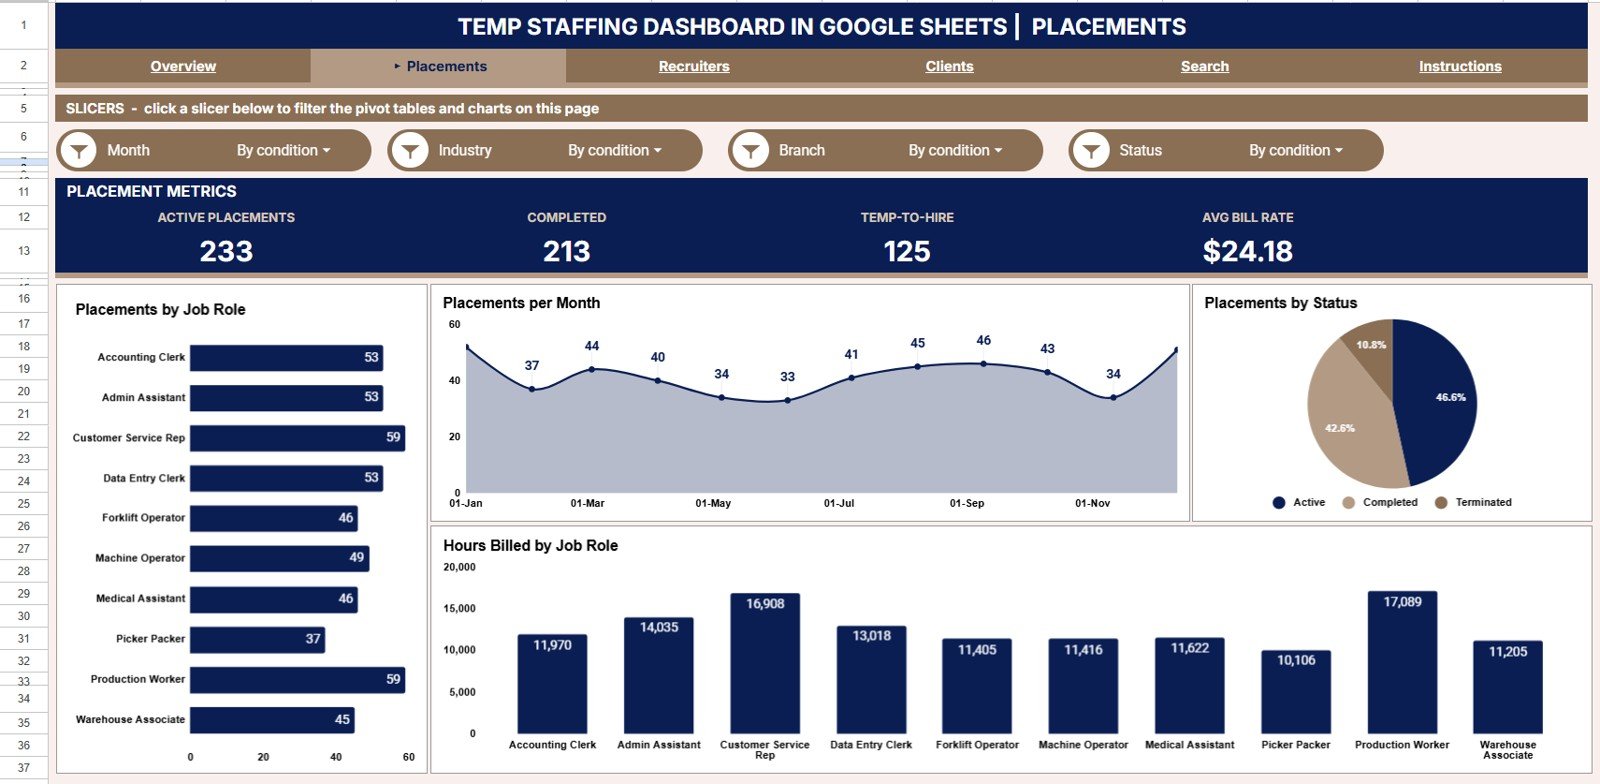
Placements Page
3 — Recruiters Page
The Recruiters page is a team scorecard. Revenue by Recruiter ranks who is billing the most, Hours Billed Share by Recruiter shows workload distribution, Gross Margin by Recruiter surfaces who protects profitability, and Placements by Month and Recruiter tracks each recruiter’s monthly output trend.
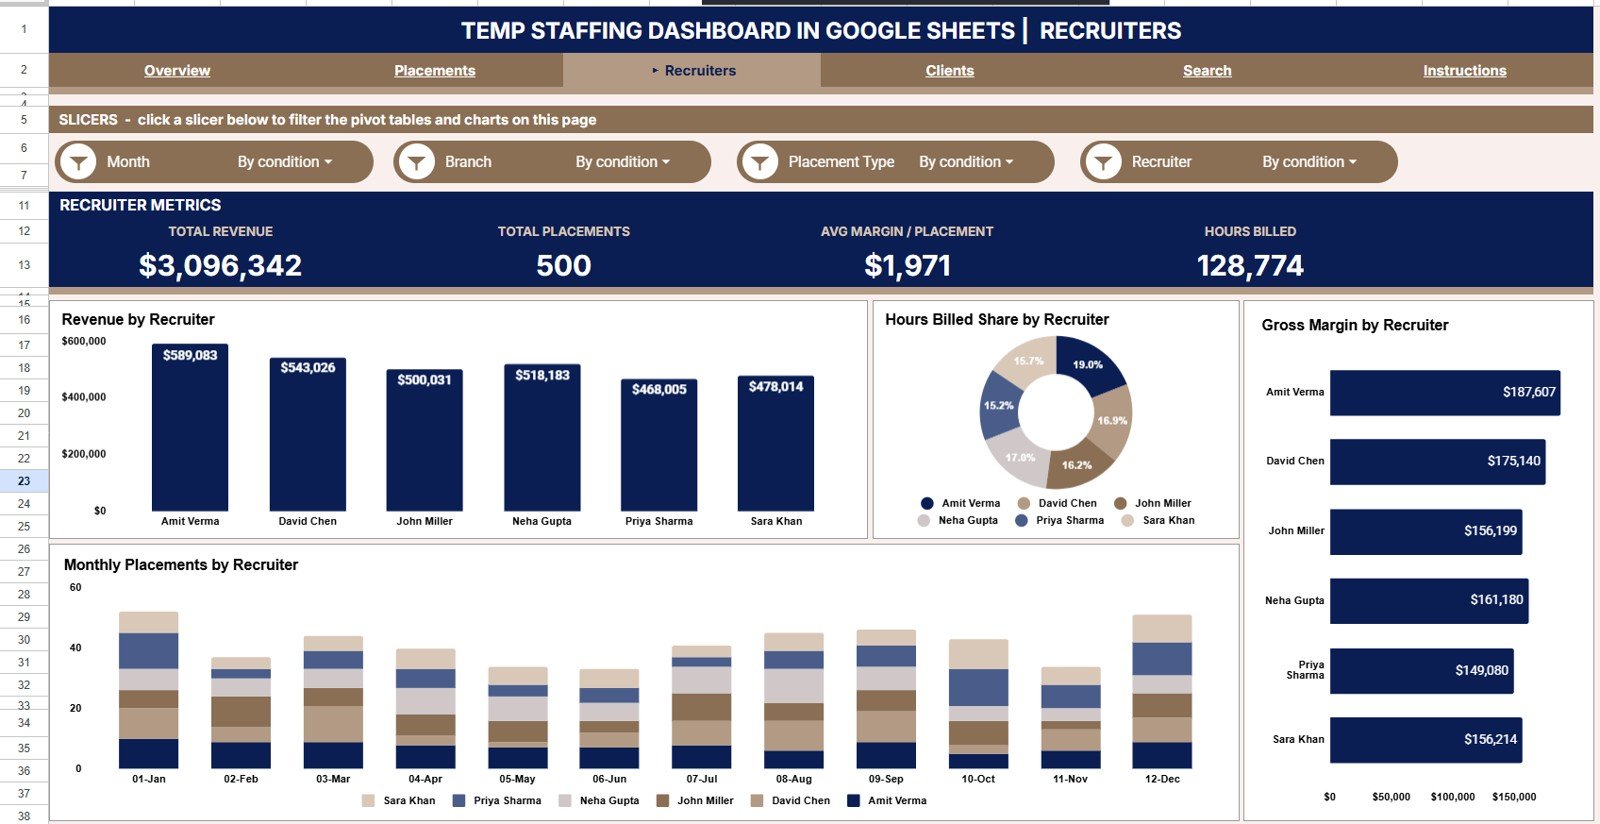
Recruiters Page
4 — Clients Page
The Clients page focuses on account profitability with 4 charts. Revenue by Client Company shows which accounts carry your revenue, Gross Margin by Client highlights the most profitable relationships, Revenue by Month tracks the trend, and Revenue by Month and Industry reveals how demand shifts across verticals over time.
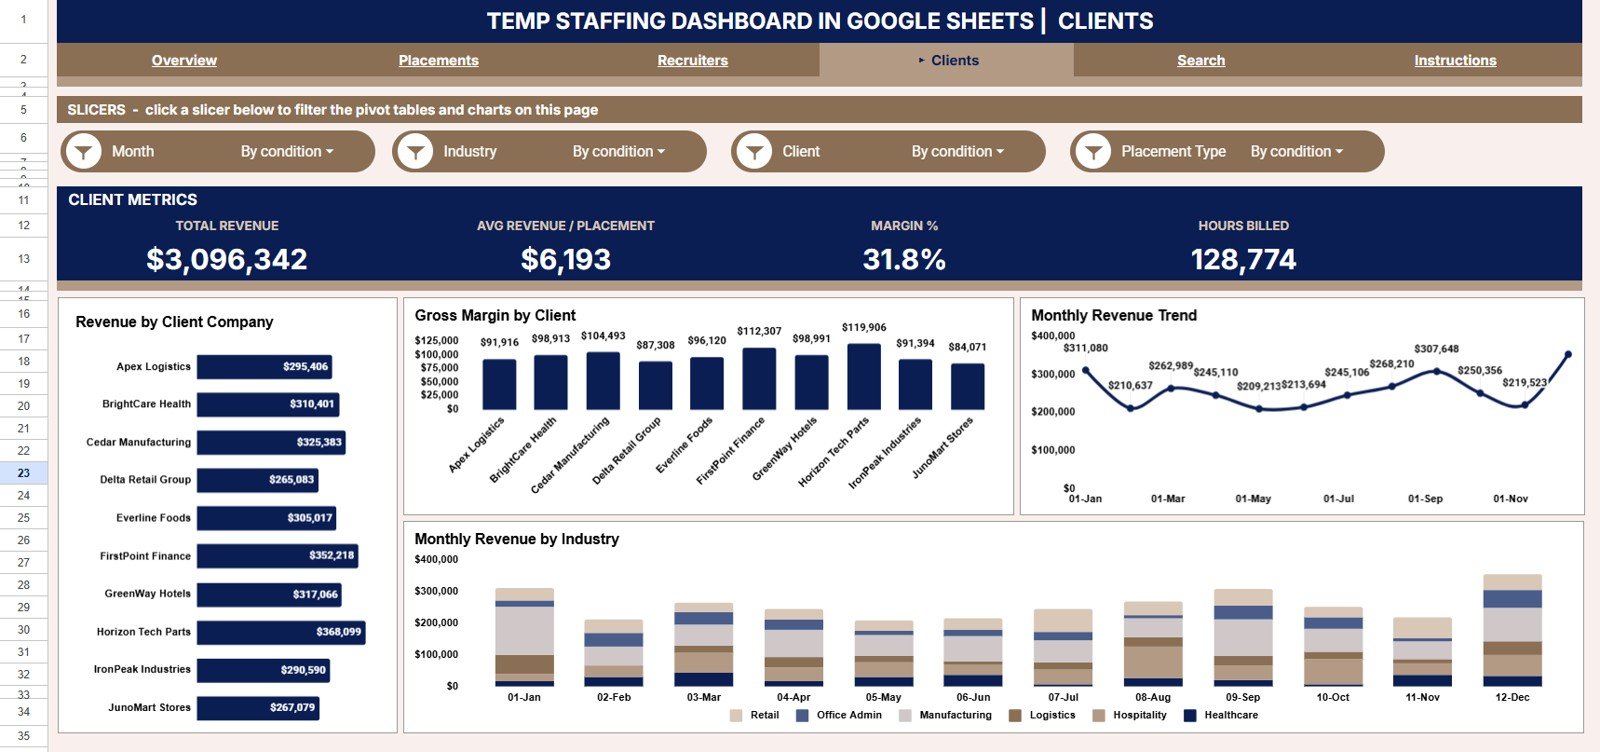
Clients Page
5 — Search Sheet
The Search sheet is a placement lookup tool. Select any Placement ID from the dropdown and instantly view every related detail — candidate name, client company, job role, industry, recruiter, branch, placement type, status, hours billed, bill rate, pay rate, revenue, and gross margin — without scrolling the raw data.
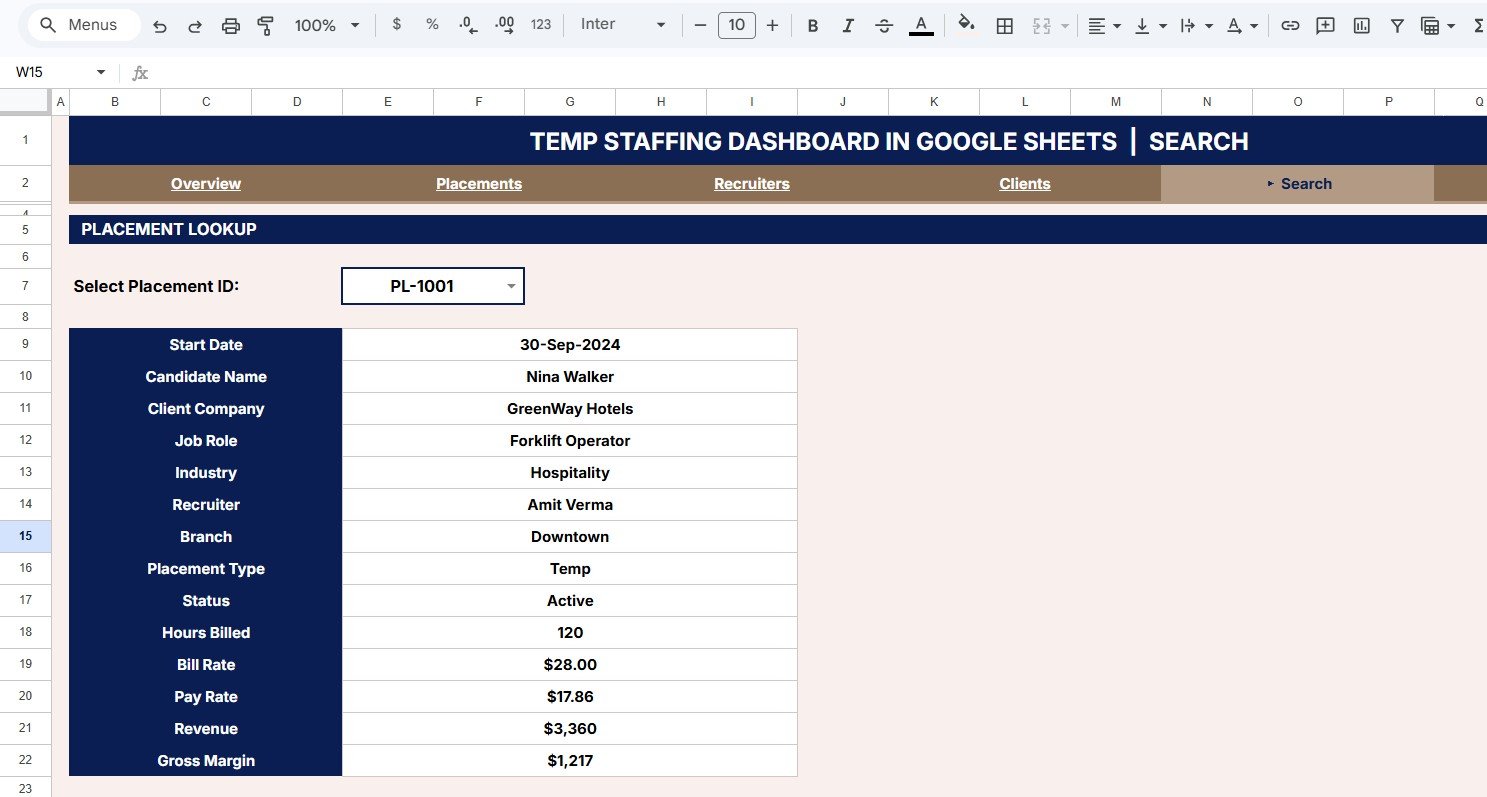
Search Sheet Tab
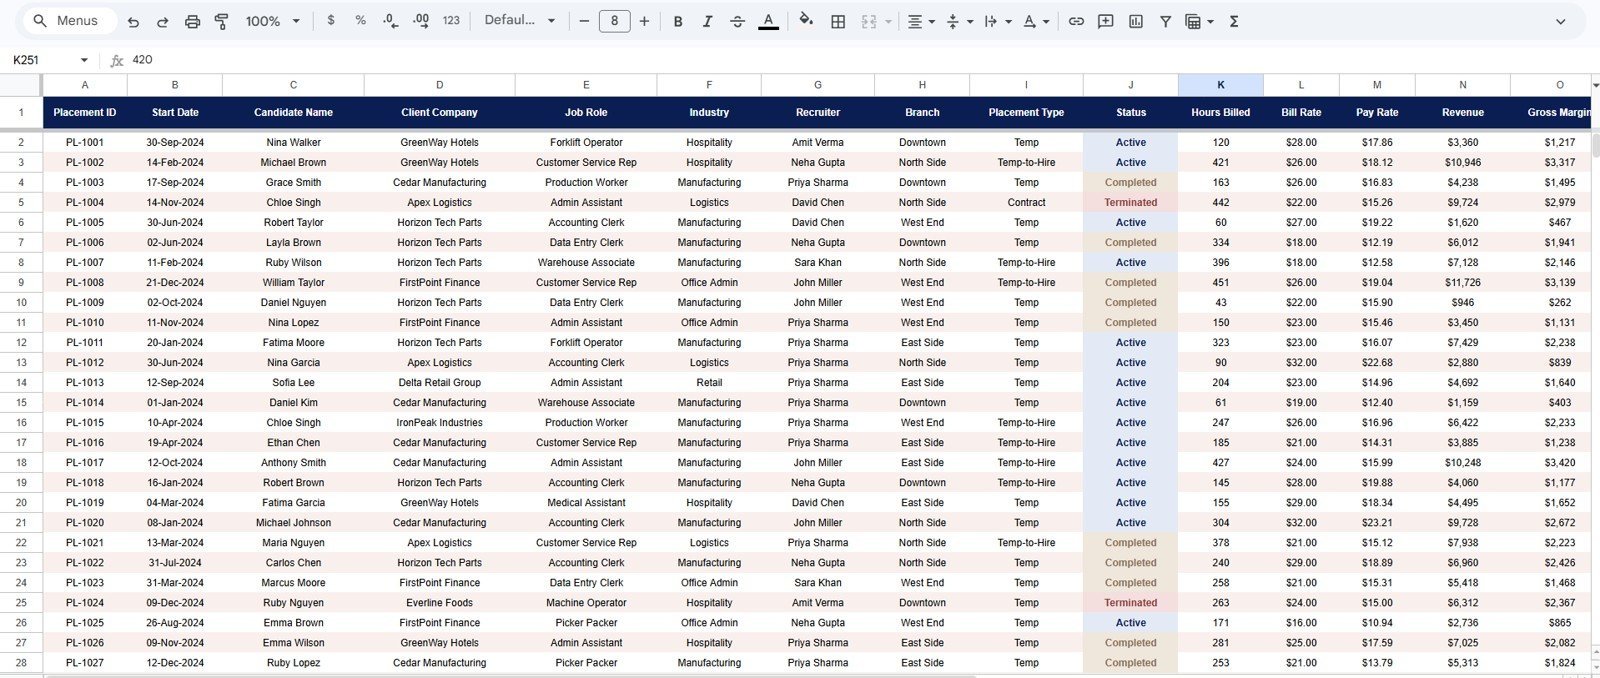
6 — Data Sheet
The Data sheet is the single source of truth. Add or paste your placement records here in the same column format and every page, chart, KPI card, and the Search sheet update automatically — no formulas to maintain.
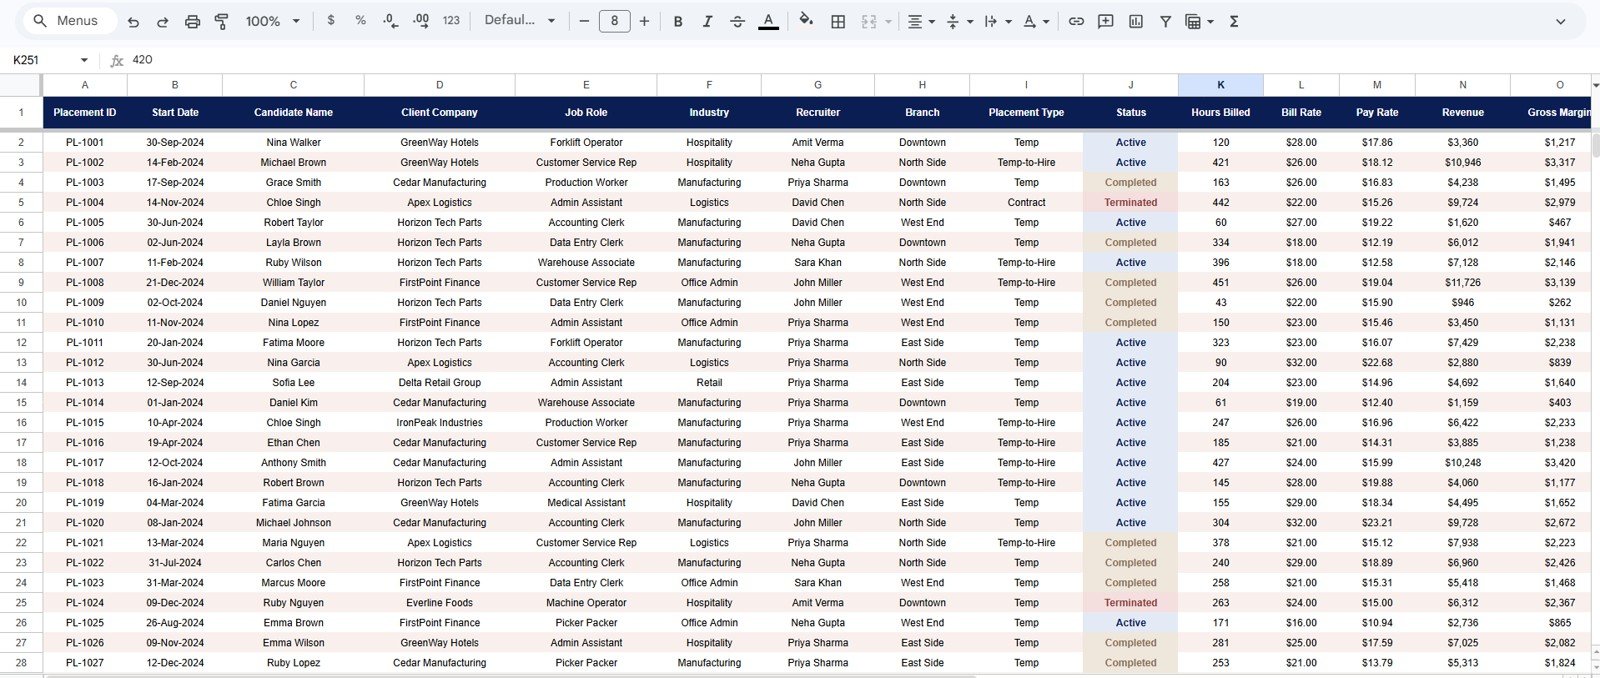
Data Sheet Tab
📊 Temp Staffing Dashboard in Google Sheets vs. Microsoft Excel Dashboard vs. Bullhorn / Zoho Recruit — Where This Fits
| Feature | Temp Staffing Dashboard in Google Sheets | Microsoft Excel Dashboard | Bullhorn / Zoho Recruit |
|---|---|---|---|
| Cost | $9.99 one-time | $17.99 one-time | $30–$99 / user / month |
| Platform | Google Sheets (free, browser-based) | Microsoft Excel (license needed) | Web-based ATS |
| Setup time | Under 10 minutes | Under 10 minutes | 2–4 weeks onboarding |
| Revenue & gross margin tracking | ✅ Built-in, by branch, recruiter & client | ✅ | ✅ Add-on / higher tier |
| Real-time team collaboration | ✅ Simultaneous editing | ❌ File-based | ✅ |
| Mobile access | ✅ Google Sheets app | ⚠️ Limited | ✅ |
| Placement ID lookup | ✅ Built-in Search sheet, 13 fields | Manual filtering | ✅ |
| Share with link | ✅ One-click sharing | ❌ File attachment | ✅ |
| Year-1 cost at 5 users | $9.99 | $17.99 | $1,800–$5,940 |
For temp-staffing firms that want Bullhorn-grade revenue and margin analytics with real-time collaboration and no monthly fees, the Temp Staffing Dashboard in Google Sheets sits in the sweet spot.
👥 Who This Template Is For — and Who It’s Not For
✅ This template is built for:
- Temp and contract staffing agency owners with 2–50 recruiters tracking revenue, margin, and hours billed
- Staffing operations managers who need branch, recruiter, and client profitability in one collaborative view
- Recruitment finance leads reporting gross margin and billings by month to the founder or CFO
- Solo and boutique recruiters who want revenue analytics without $30–$99/month ATS fees
❌ This template is NOT for:
- Agencies needing an enterprise ATS with CV parsing, SOC 2, and SSO
- Firms with 500+ recruiters requiring row-level security and automated payroll runs
- Teams that need a candidate sourcing funnel (sourced → screened → submitted) rather than placement and revenue reporting
⚙️ How to Use the Temp Staffing Dashboard in Google Sheets
- Open the PDF guide in your download and click the Google Sheets copy link to create your own editable copy in Google Drive.
- Open the Data sheet and paste your placement records into the same column format shown by the sample rows.
- Return to the Overview page — the 4 KPI cards, 16 charts, and Search sheet refresh automatically.
- Use the slicers on the Overview page to filter by industry, branch, placement type, or date range.
- Open the Search sheet and pick any Placement ID to view all 13 fields for that placement.
💼 Real-World Use Cases
Arjun runs a 20-recruiter temp staffing firm across three branches. Every Monday he opens the Temp Staffing Dashboard in Google Sheets to check Total Revenue and Gross Margin, then filters Revenue by Branch to see which office is pulling ahead — and shares a live link with his branch managers.
Lena leads finance at a light-industrial staffing agency. She uses the Recruiters page to spot which recruiters protect gross margin versus those chasing low-margin volume, and reviews Revenue and Gross Margin by Month before the quarterly board meeting.
Sam is a solo contract recruiter placing IT and healthcare temps. He uses the Search sheet during client calls to pull bill rate, pay rate, and hours billed for any placement, and the Clients page to see which accounts deliver the best margin.
❓ Frequently Asked Questions
What KPIs does the Temp Staffing Dashboard in Google Sheets track?
The Temp Staffing Dashboard in Google Sheets tracks 4 headline KPIs — Total Revenue, Gross Margin, Total Placements, and Hours Billed — plus revenue by industry, branch, recruiter, and client, gross margin by recruiter and client, placements by role, month, and status, and hours billed by job role. Every metric updates automatically when you add data.
How long does setup take?
Setup takes under 10 minutes. Make your own copy from the included link, paste your placement records into the Data sheet using the same column format, and the Temp Staffing Dashboard in Google Sheets refreshes every chart, KPI card, and the Search sheet automatically.
How does this compare to Bullhorn or Zoho Recruit?
Bullhorn and Zoho Recruit cost $30–$99 per user per month and keep your data inside their platform. The Temp Staffing Dashboard in Google Sheets is a $9.99 one-time purchase covering revenue, margin, placement, recruiter, and client reporting with real-time collaboration and no per-user fees.
Can I filter the dashboard by branch or industry?
Yes. Native slicers on the Overview page let you filter the Temp Staffing Dashboard in Google Sheets by industry, branch, placement type, and date range in one click, and every chart and KPI card re-draws instantly.
Can I look up a single placement?
Yes. The Search sheet in the Temp Staffing Dashboard in Google Sheets returns 13 fields for any Placement ID — candidate name, client company, job role, industry, recruiter, branch, placement type, status, hours billed, bill rate, pay rate, revenue, and gross margin — in one lookup.
Do I need paid software to use this dashboard?
No. The Temp Staffing Dashboard in Google Sheets runs entirely in Google Sheets, which is free with any Google account. You open it in your browser with no desktop software, no plugins, and no Excel license required.
👤 About the Author
Built by PK — Microsoft Certified Professional with 15+ years of Excel, Google Sheets, and Power BI experience. Founder of NextGenTemplates, reaching 300K+ subscribers across YouTube channels (@PK-AnExcelExpert, @NextGenTemplates, @NeoTechNavigators). Every template is hand-built and tested before release.
🔗 Explore Related Templates
Browse more Google Sheets Dashboard Templates and HR & Payroll Templates on NextGenTemplates. If you also track placement volume and bill rates, the Staffing Agency Dashboard in Google Sheets is a natural companion.
🔄 Also available as: Excel · Power BI.
📖 Click here to read the Detailed Blog Post<
Watch the step-by-step video Demo:
/h3>
🎥 Visit our YouTube channel for step-by-step video tutorials
👉 YouTube.com/@NeoTechNavigators
📅 Last updated: July 2026


Reviews
There are no reviews yet.