

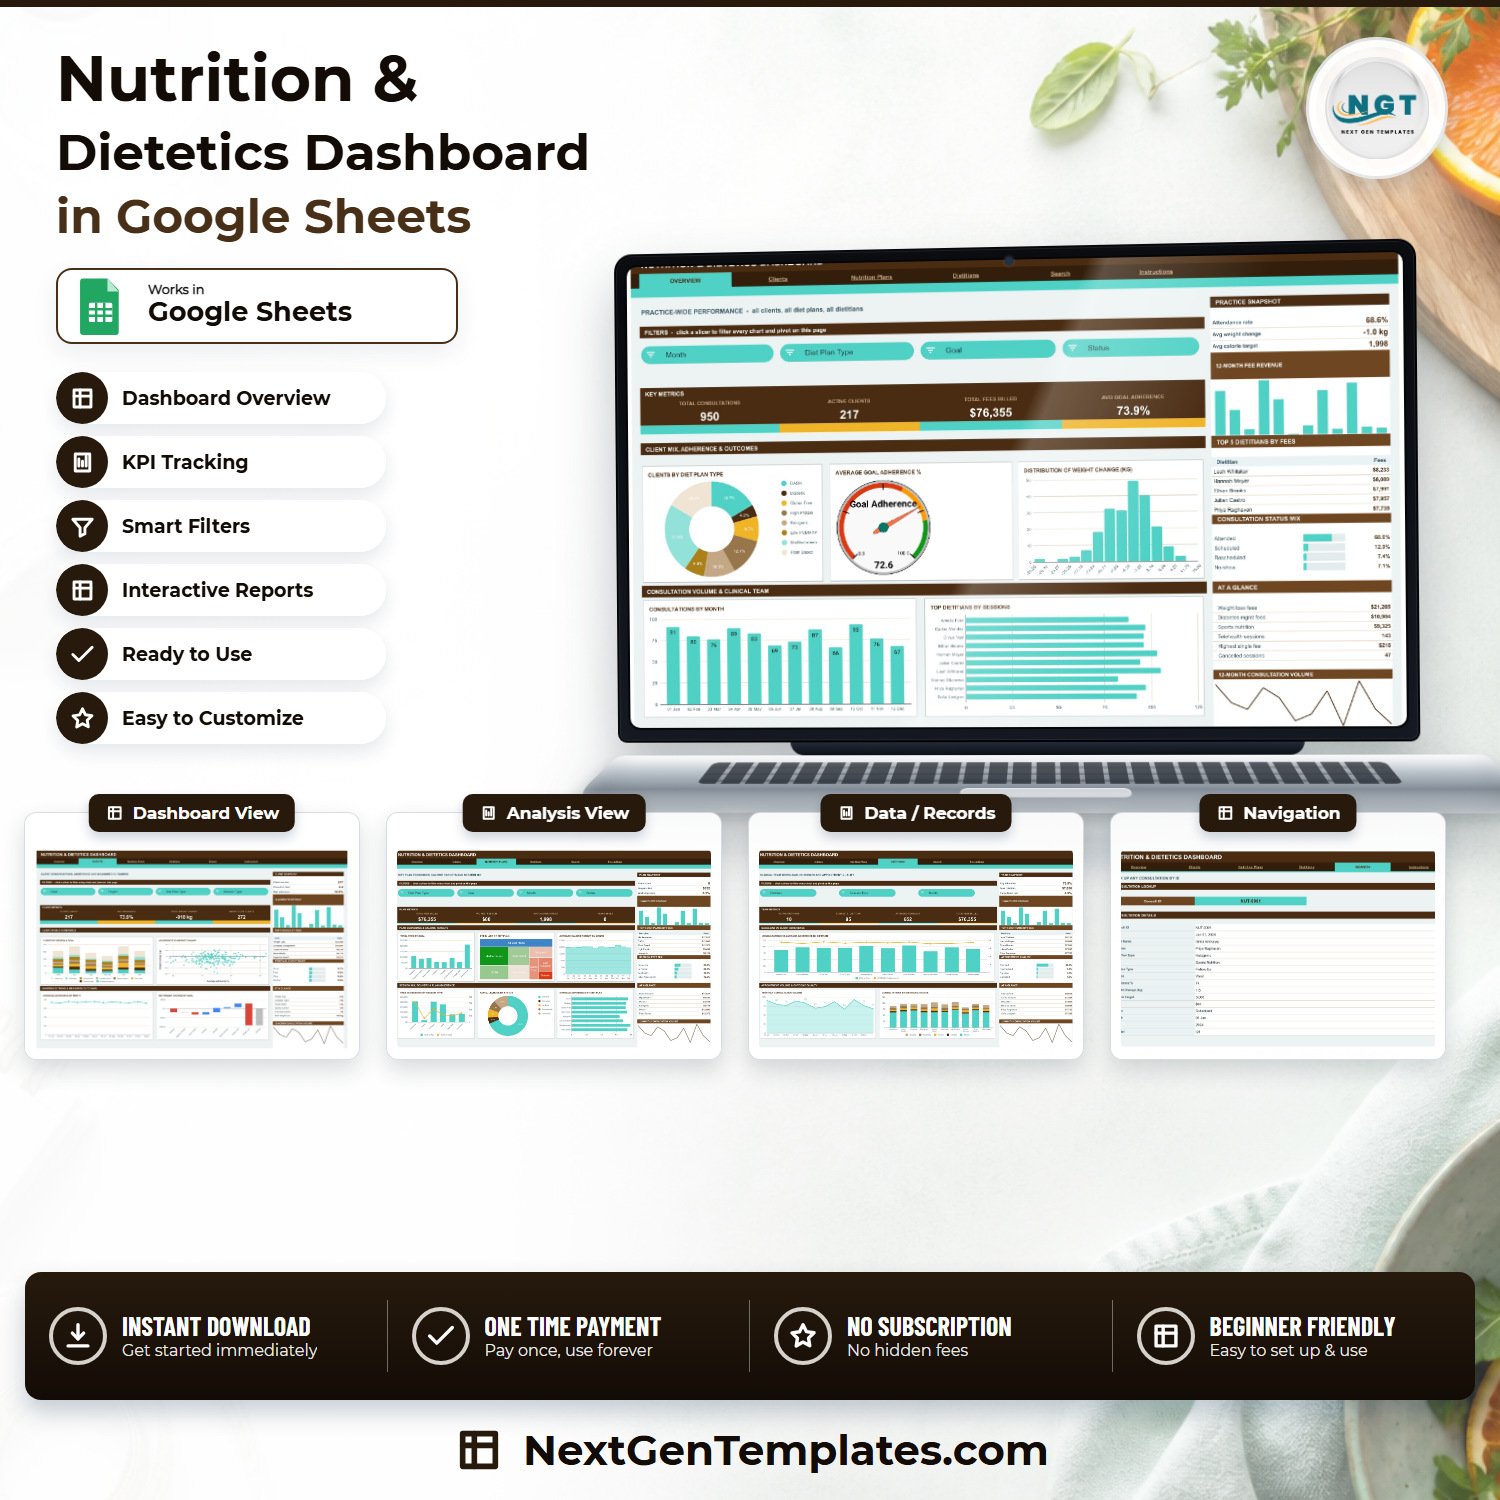

The Nutrition & Dietetics Dashboard in Google Sheets reports on a dietetics practice from one consultation log: 4 slicer-driven pages, 18 charts, 16 KPI cards and 15 slicers, all reading native Google Sheets pivot tables. It ships with 950 sample consultation rows across 17 columns (1 Jan – 27 Dec 2024) covering 217 clients, 10 dietitians, 8 diet plan types and 8 consultation goals. Setup takes under 10 minutes: make your copy, paste your own consultations over the sample rows, and every chart, pivot and Top 5 panel redraws.
🌍 Join 8,400+ teams in 40+ countries using NextGenTemplates to replace paid SaaS reporting tools with one-time-purchase Excel, Google Sheets, Power BI and HTML templates.
✅ Instant download · One-time payment · No subscription · No per-user fees · Lifetime access
⚠️ Read this first. This is a business reporting template for a nutrition or dietetics practice. It is not clinical software, not a diagnostic tool, not a meal planner, not a nutrient calculator and not dietary advice. It performs no nutritional assessment and is not a substitute for a registered dietitian or any other qualified health professional. Every clinical-sounding number in it – Adherence %, Weight Change (kg), Calorie Target – is a value your practice types in, not a value the sheet measures, calculates or validates.
🔑 Key Features of the Nutrition & Dietetics Dashboard in Google Sheets
📊 Four reporting pages, each with its own filter strip. Overview covers the whole practice, Clients covers demographics and recorded outcomes, Nutrition Plans covers diet-plan economics and calorie targets, and Dietitians covers team workload and appointment quality. Across the four pages there are 15 slicers – Month, Diet Plan Type, Goal, Status, Region, Session Type and Dietitian.
🧮 Sixteen KPI cards, four per page. On the sample data they read: Total Consultations 950, Active Clients 217, Total Fees Billed $76,355, Avg Goal Adherence 73.9%, Total Weight Change -918 kg, Weight Loss Consultations 272, Avg Fee / Session $80, Avg Calorie Target 1,998, Plans in Use 8, Active Dietitians 10, Consults / Dietitian 95 and Attended Consults 652.
📈 Eighteen charts, named by the metric they show. Donut, gauge, histogram, column, bar, stacked column, scatter, line, waterfall, treemap, stepped area, combo and area – one chart family per question, not one chart family repeated twelve times.
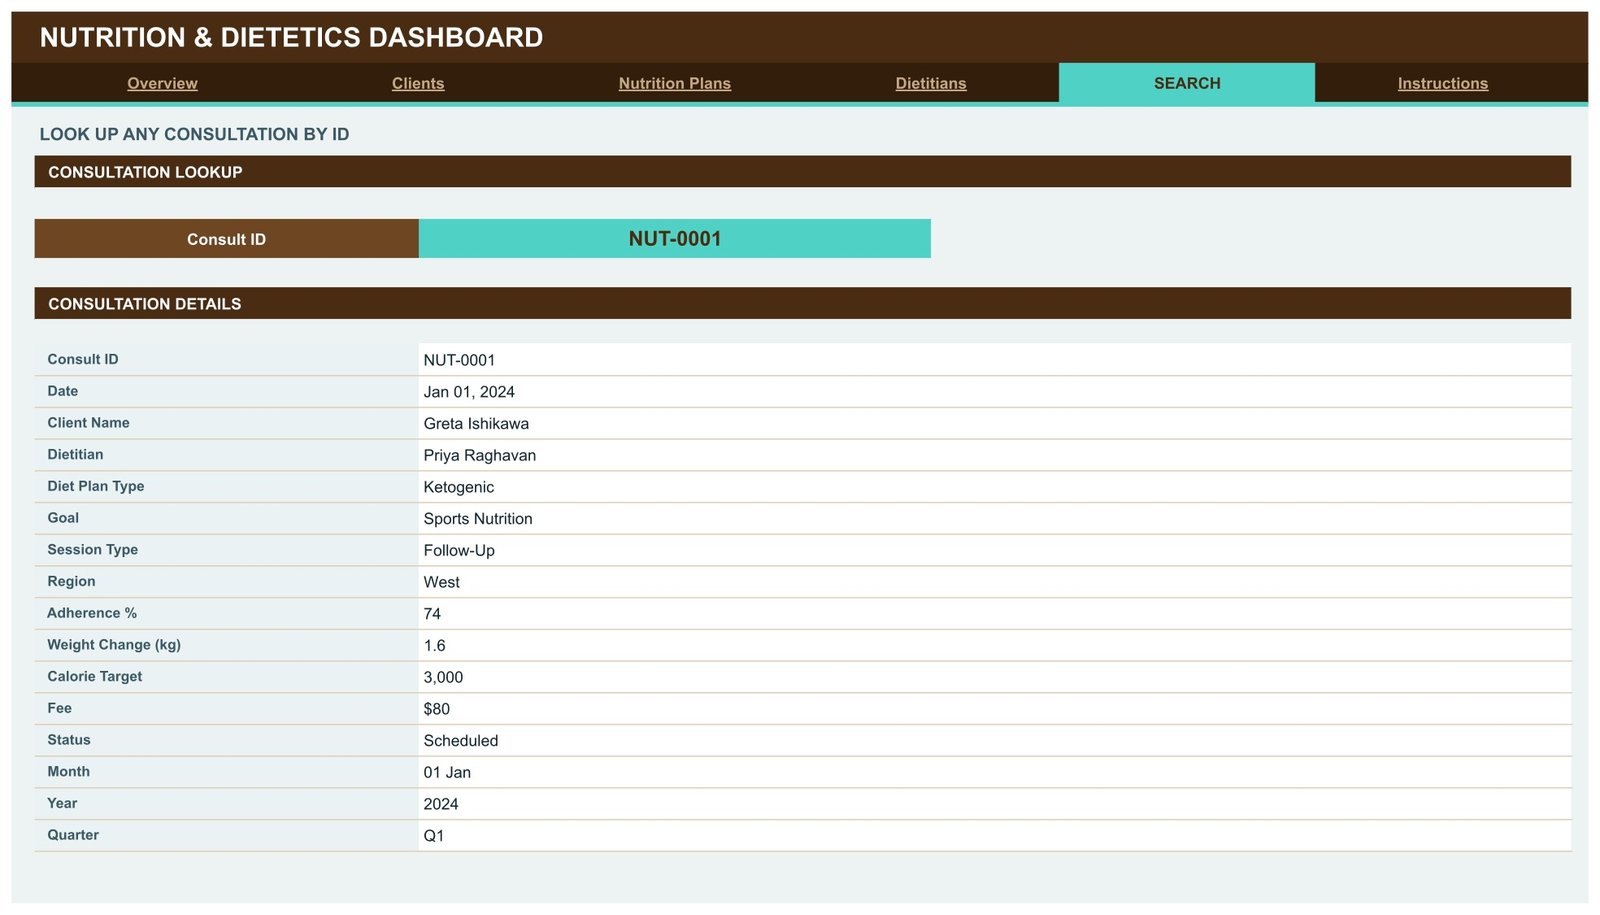
🔎 A Search page that returns a full consultation record. Type any Consult ID (NUT-0001 to NUT-0950) and 15 fields come back through INDEX/MATCH – date, client, dietitian, diet plan, goal, session type, region, adherence, weight change, calorie target, fee, status, month, year and quarter.
⚡ Pivot-and-slicer architecture, not helper formulas. Every chart reads a real pivot table parked to the right of each page, so the file stays fast as the consultation log grows. Pivots, slicers and formulas are pre-sized to 1,000 data rows; paste anywhere up to row 1001 and the dashboard updates on its own.
📦 What’s Inside the Nutrition & Dietetics Dashboard in Google Sheets
Seven tabs: Overview, Clients, Nutrition Plans, Dietitians, Search, Instructions and Data.
Page 1: Overview – Practice-Wide Performance
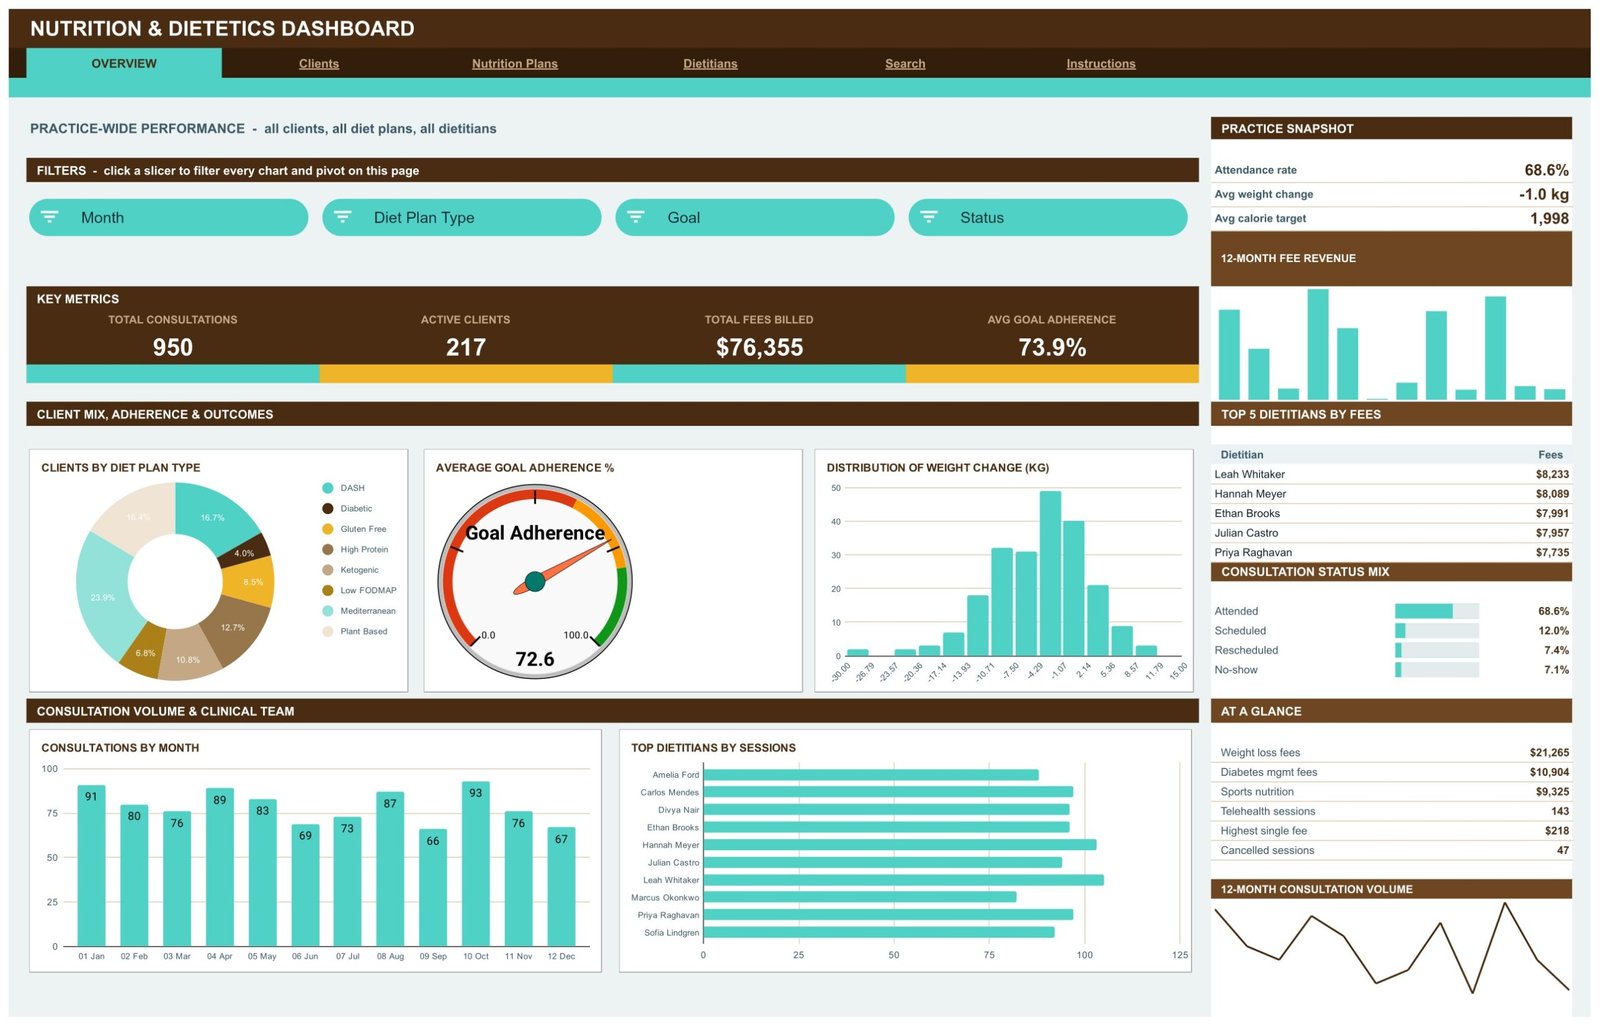
Four KPI cards (Total Consultations 950, Active Clients 217, Total Fees Billed $76,355, Avg Goal Adherence 73.9%) sit under slicers for Month, Diet Plan Type, Goal and Status. Charts: Clients by Diet Plan Type, Average Goal Adherence %, Distribution of Weight Change (kg), Consultations by Month and Top Dietitians by Sessions. The right rail carries a Practice Snapshot (attendance rate 68.6%, avg weight change -1.0 kg, avg calorie target 1,998), a 12-month fee revenue sparkline, Top 5 Dietitians by Fees, a Consultation Status Mix and a six-row At a Glance list.
Page 2: Clients – Demographics, Adherence and Recorded Outcomes
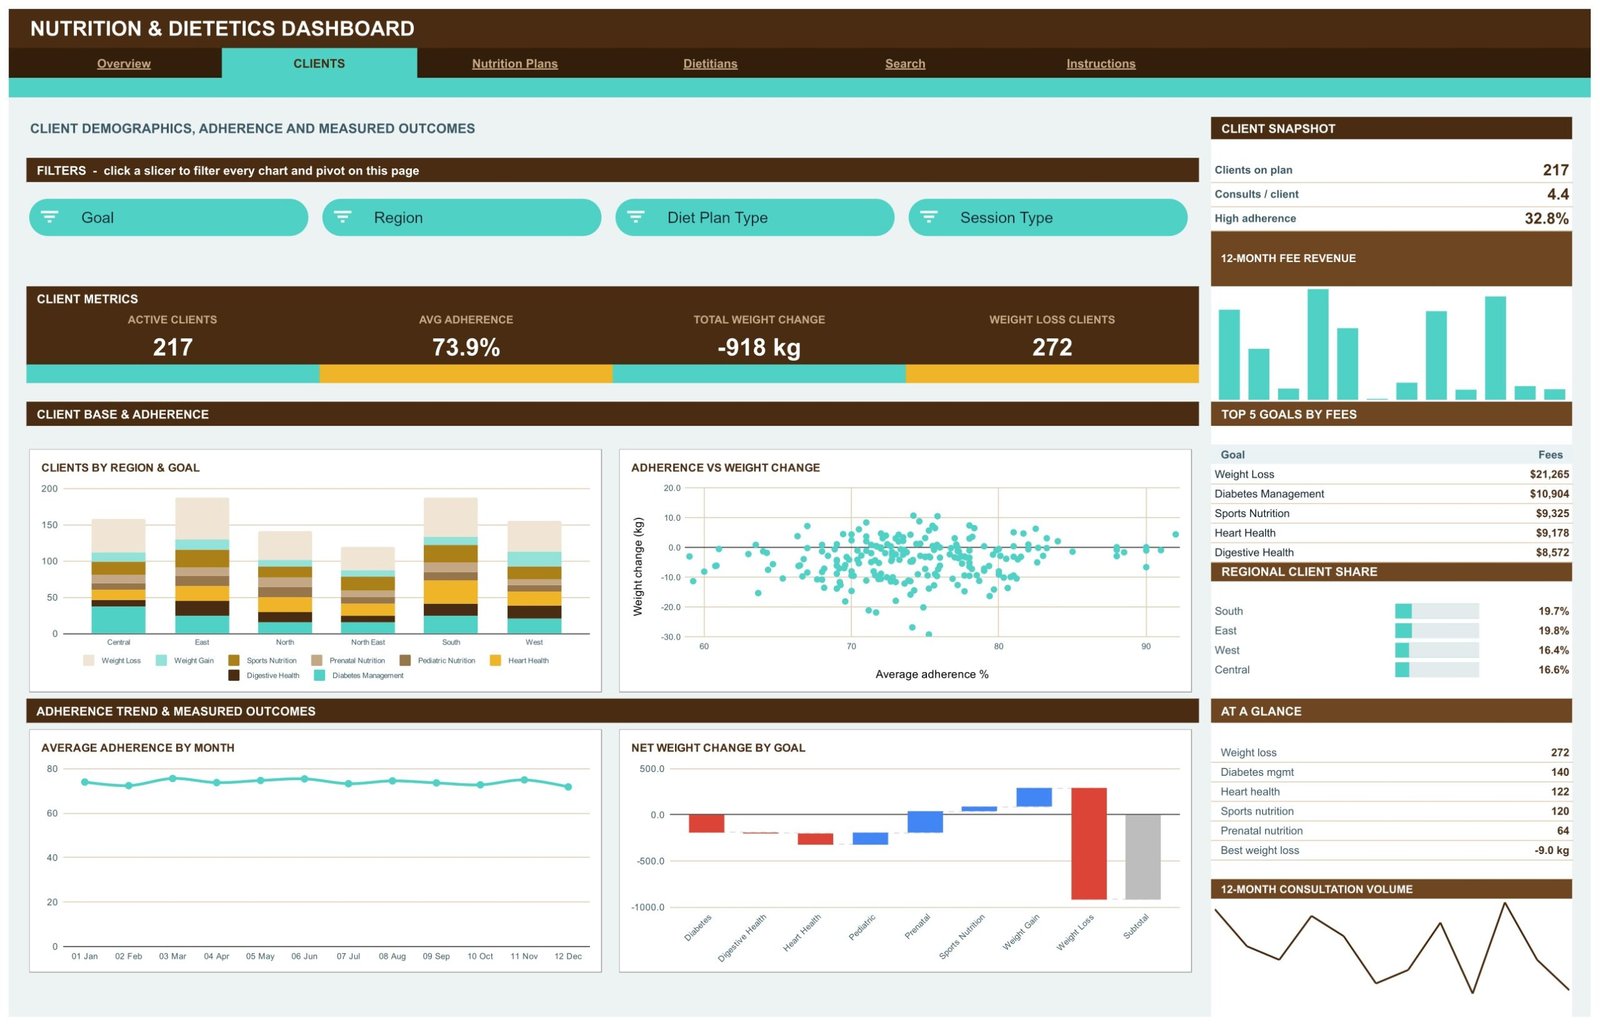
KPI cards read Active Clients 217, Avg Adherence 73.9%, Total Weight Change -918 kg and Weight Loss Consultations 272, with slicers for Goal, Region, Diet Plan Type and Session Type. Charts: Clients by Region & Goal, Adherence vs Weight Change, Average Adherence by Month and Net Weight Change by Goal. The rail adds Consults per Client 4.4, a high-adherence share of 32.8%, Top 5 Goals by Fees and a Regional Client Share panel.
Page 3: Nutrition Plans – Plan Economics, Calorie Targets and Session Mix
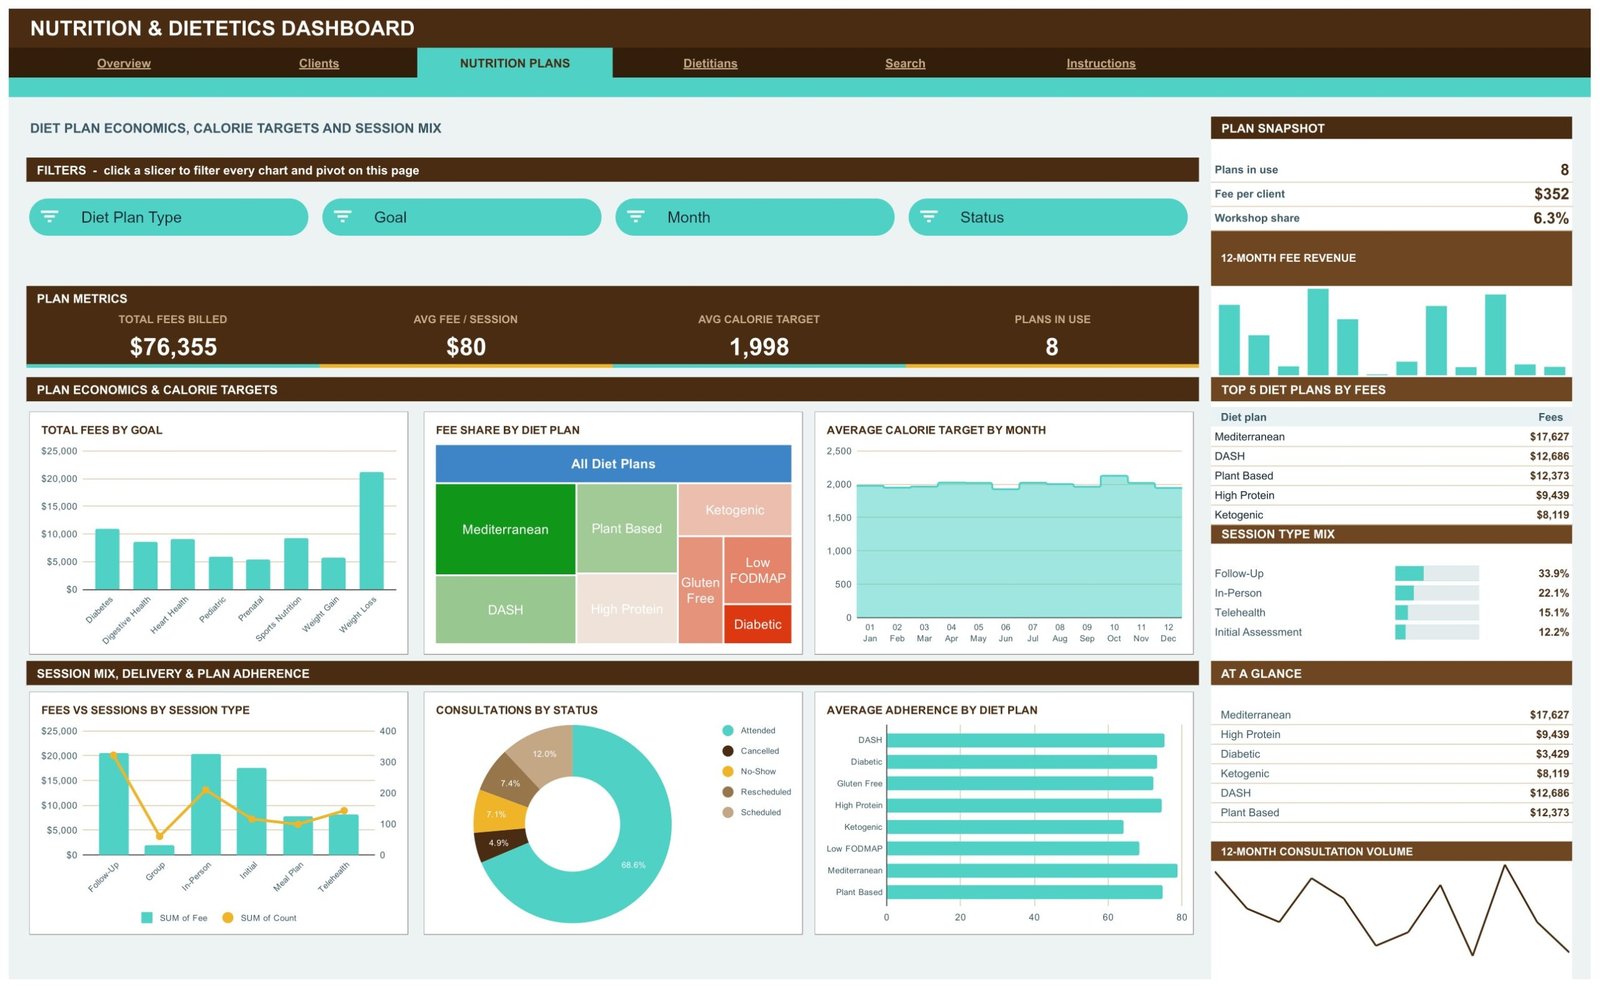
KPI cards read Total Fees Billed $76,355, Avg Fee / Session $80, Avg Calorie Target 1,998 and Plans in Use 8. Charts: Total Fees by Goal, Fee Share by Diet Plan, Average Calorie Target by Month, Fees vs Sessions by Session Type, Consultations by Status and Average Adherence by Diet Plan. On the sample data Mediterranean leads on fees at $17,627, ahead of DASH at $12,686 and Plant Based at $12,373.
Page 4: Dietitians – Team Workload and Appointment Quality
KPI cards read Active Dietitians 10, Consults / Dietitian 95, Attended Consults 652 and Total Fees Billed $76,355, filtered by Dietitian, Session Type and Month. Charts: Consultations vs Average Adherence by Dietitian, Monthly Consultation Volume and Consultations by Dietitian & Status. The Appointment Quality panel splits the log into Attended 68.6%, Rescheduled 7.4%, No-show 7.1% and Cancelled 4.9%.
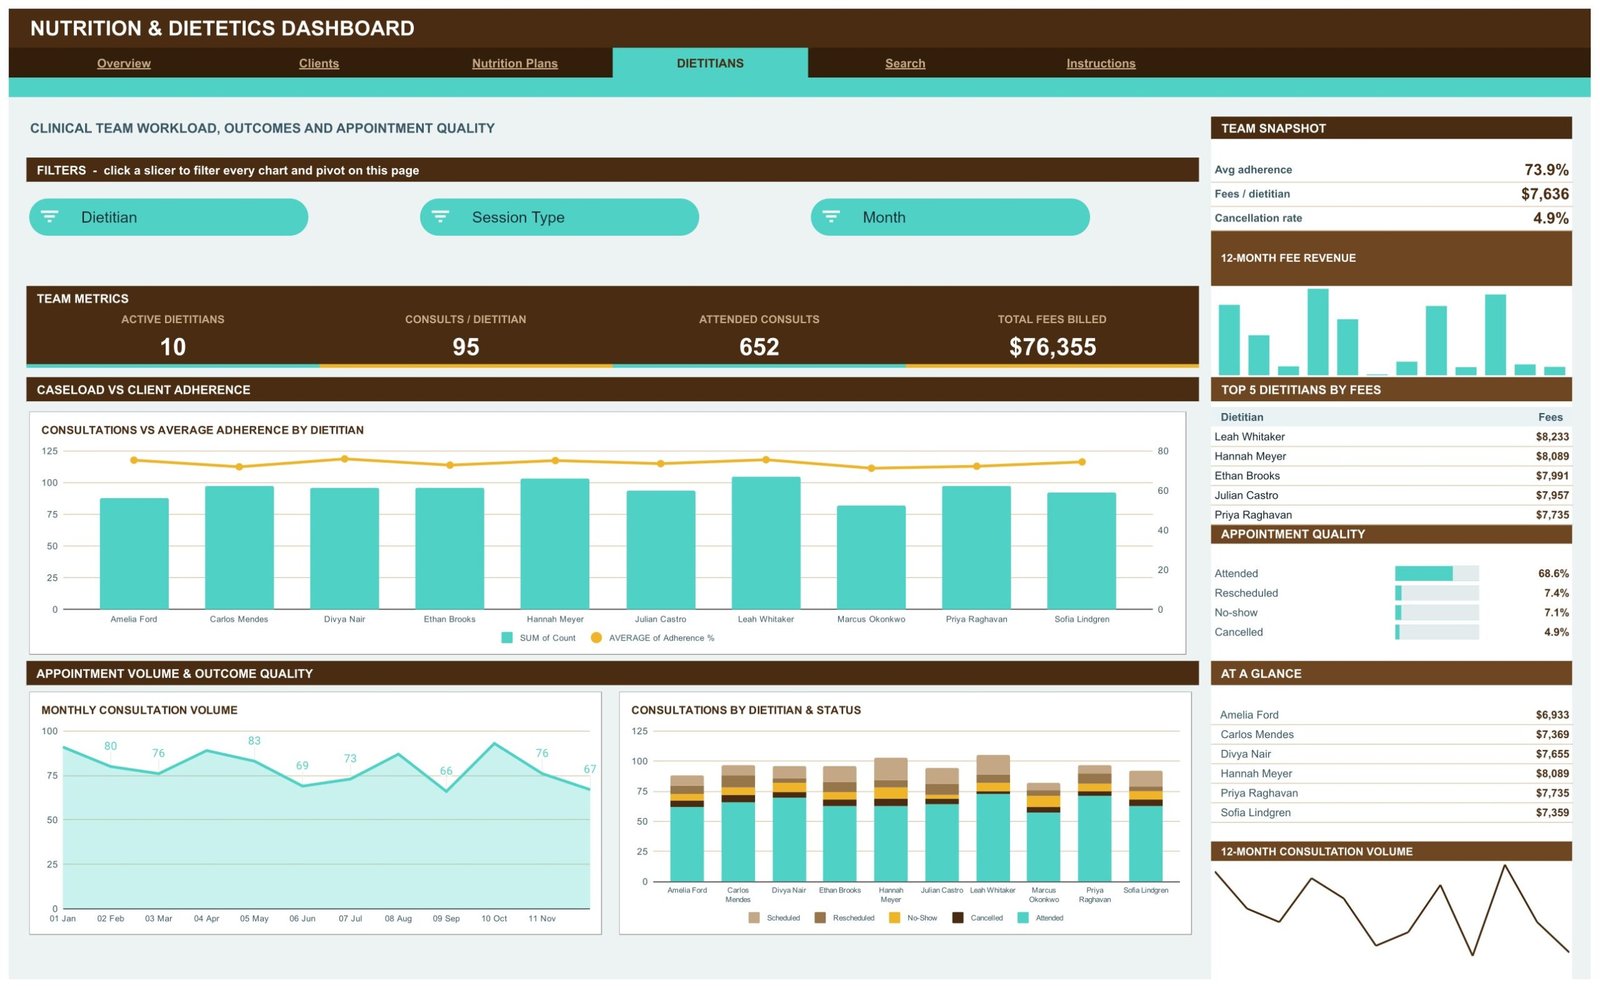
Page 5: Search – Consultation Lookup
One input cell takes a Consult ID and returns all 15 fields of that consultation record from the Data sheet.
Page 6: Instructions – Ten-Step User Guide
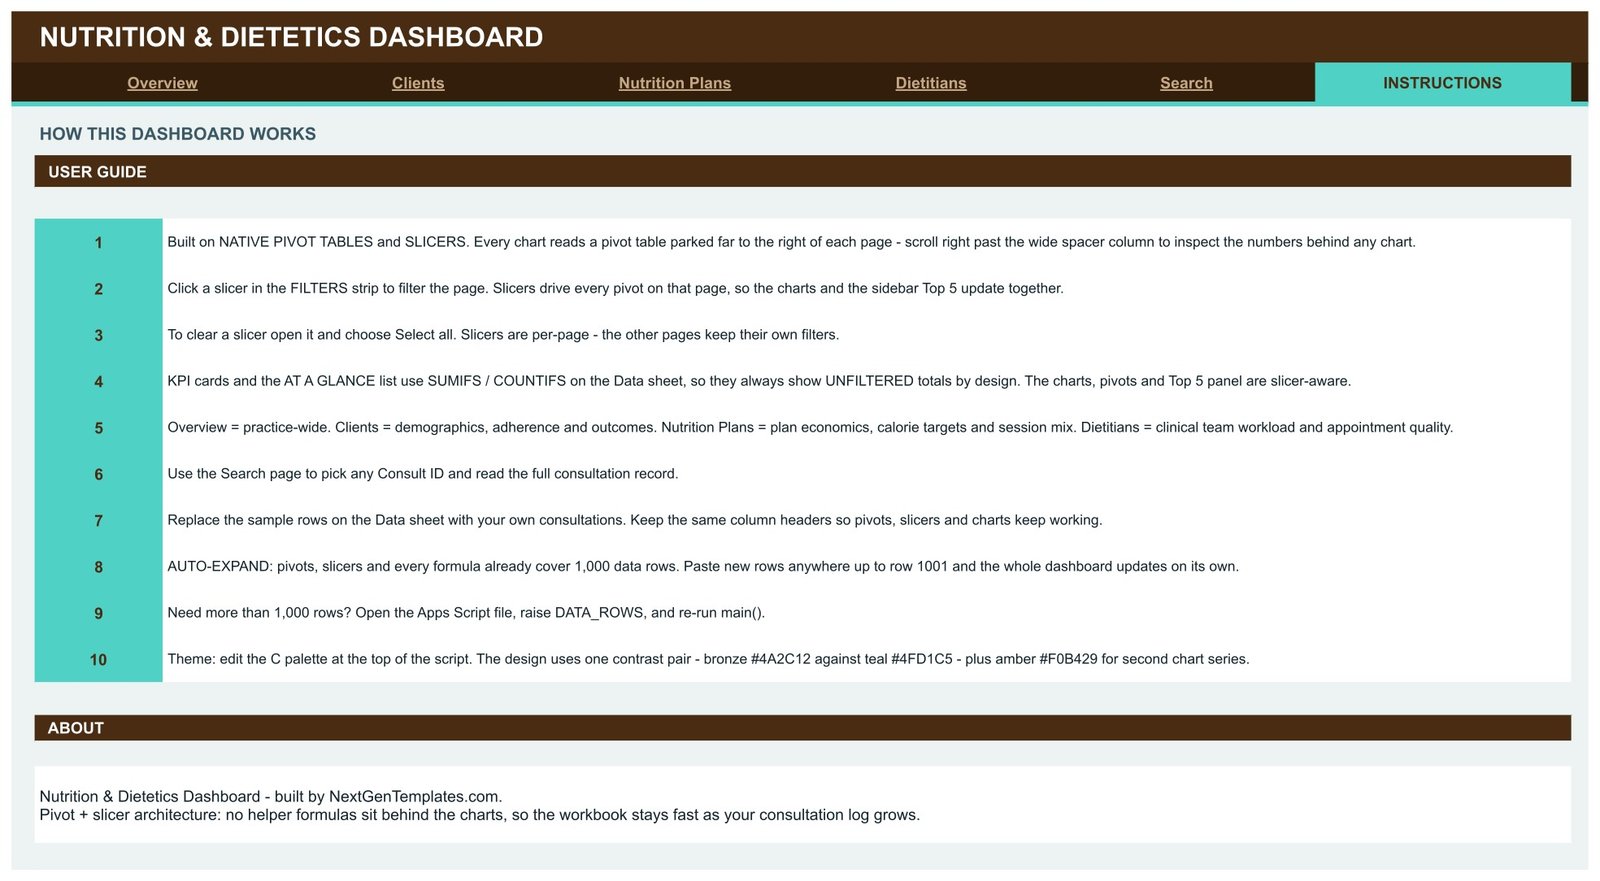
Ten numbered rows explain the pivot-and-slicer architecture, how to clear a slicer, which panels are filtered and which are not, how to swap in your own data, and how to raise the 1,000-row limit in the Apps Script.
Page 7: Data – The Consultation Log
Seventeen columns: Consult ID, Date, Client Name, Dietitian, Diet Plan Type, Goal, Session Type, Region, Adherence %, Weight Change (kg), Calorie Target, Fee, Status, Month, Year, Quarter and Count. The last four are helper columns that feed the pivots.
🔐 What This Template Holds About Your Clients – Read Before You Load Real Data
Being straight about this matters more than a marketing line. The Data sheet has a Client Name column, and the sample fills it with 217 personal names. Alongside it, each row carries an Adherence %, a Weight Change in kilograms and a Calorie Target. So yes – this template stores client-level rows, and the Search page will echo back whatever you put in that cell.
What the dashboard actually does with that column is narrower than it looks: it counts distinct values (Active Clients = 217) and groups by them. A case reference, client code or initials works exactly as well as a real name – every KPI, chart and pivot behaves identically. If you would rather not put names in a spreadsheet, you do not have to.
What the Data sheet does not have, verified column by column: no date of birth, no address, no phone or email, no diagnosis, no medication, no allergy field, no lab value and no clinical note. And because this is an ordinary Google Sheet, its privacy is exactly your Google sharing settings and nothing more. It carries no encryption, no audit trail, no access roles, and no HIPAA, GDPR or accreditation standing of any kind. Treat it the way you would treat any spreadsheet holding client information.
📊 Nutrition & Dietetics Dashboard in Google Sheets vs. Microsoft Excel Dashboard vs. Practice BI Suite – Where This Fits
| Feature | Nutrition & Dietetics Dashboard in Google Sheets | Microsoft Excel Dashboard | Practice BI suite (Tableau / Qlik) |
|---|---|---|---|
| Cost | $9.99 one-time ✅ | $17.99 one-time | $70-$150 / user / month |
| Platform | Google Sheets – browser, nothing to install ✅ | Microsoft Excel desktop | Desktop app plus a server or cloud tenant |
| Setup time | Under 10 minutes – copy, paste, done ✅ | Under 15 minutes | Days to weeks with a data model |
| Real-time team collaboration | Native – multiple dietitians in one file ✅ | Only via OneDrive co-authoring | Yes, per licensed seat |
| Mobile access | Google Sheets app, free ✅ | Excel mobile, limited pivots | Viewer app, paid seat required |
| Customisable fields | Edit the 17 Data columns and re-point the pivots ✅ | Same, via Excel pivots | Yes, needs modelling skills |
| Share with a link | Yes – one Google link, view or edit ✅ | File attachment or OneDrive link | Portal login per viewer |
| Row capacity out of the box | 1,000 consultations, raisable in the script | Practically unlimited | Millions ✅ |
| Year-1 cost at 5 users | $9.99 total ✅ | $17.99 total | $4,200-$9,000 |
For a practice that wants clear consultation, adherence and fee reporting without a per-seat BI licence, the Nutrition & Dietetics Dashboard in Google Sheets sits in the sweet spot.
👥 Who This Template Is For – and Who It’s Not For
✅ This template is built for:
- Independent dietitians and nutritionists who keep consultations in a spreadsheet and want a reporting layer over it
- Small nutrition clinics with 2-15 practitioners who need caseload, attendance and fee reporting in one shared link
- Practice managers preparing a monthly or quarterly review of consultation volume, no-show rate and fee mix
- Wellness and corporate-nutrition programmes reporting session counts and plan mix to a client organisation
- Anyone who wants pivot-and-slicer reporting in Google Sheets without building the pivots themselves
❌ This template is NOT for:
- Anyone needing clinical, diagnostic or nutritional-assessment functionality – this template provides none
- Meal planning, recipe building, macro calculation or nutrient analysis – there is no food or nutrient database in it
- Practices needing a live link to an EHR, practice-management system, booking tool or payment processor – the file is static and you paste into it
- Anyone who needs HIPAA, GDPR or accreditation controls, an audit trail, or per-user permissions inside the file
- Multi-year trend analysis out of the box – the sample covers one year (2024) and there is no year-over-year view
- Practices logging more than a few thousand consultations a year without editing the Apps Script row limit
⚙️ How to Use the Nutrition & Dietetics Dashboard in Google Sheets
- Open the PDF in your download and click the Google Sheets link inside it to create your own editable copy in Google Drive.
- Read the Instructions tab first – it explains in ten steps which panels respond to slicers and which do not.
- Go to the Data tab and replace the 950 sample rows with your own consultations, keeping all 17 column headers unchanged.
- Decide what goes in Client Name – a real name, a client code or a case reference. The dashboard counts distinct values either way.
- Fill the four helper columns (Month, Year, Quarter, Count) for each new row so the pivots group correctly.
- Return to Overview and click any slicer to filter that page’s charts, pivots and Top 5 panel.
- To clear a filter, open the slicer and choose Select all. Slicers are per page – each page keeps its own filters.
- Use the Search tab to pull any single consultation record back by its Consult ID.
- Need more than 1,000 rows? Open the attached Apps Script, raise DATA_ROWS and re-run main().
💼 Real-World Use Cases
Amara runs a two-dietitian nutrition clinic. She keeps every consultation in the Data tab and opens the Dietitians page each Friday to see attended consults against no-shows per practitioner. The Appointment Quality panel showed a 7.1% no-show rate, so she introduced a reminder call for first appointments – and now watches that one number month over month.
Ben is a practice manager at a five-person wellness centre. He uses the Nutrition Plans page to see which diet plan types actually carry the fee load. Finding Mediterranean at $17,627 against Diabetic at $3,429 changed how the centre allocated its group-workshop slots, which sit at 6.3% of all sessions.
Priya is a freelance dietitian working across three regions. She uses client codes rather than names in the Client Name column, filters the Clients page by Region, and exports the quarterly view for her accountant – no practice-management subscription, no per-seat licence.
⚠️ Honest Limitations You Should Know Before Buying
- The KPI cards and the At a Glance list do not respond to slicers. They use SUMIFS and COUNTIFS on the whole Data sheet and always show unfiltered totals – by design, and stated on the Instructions tab. Only the charts, pivots and Top 5 panels are slicer-aware.
- Total Fees Billed is fees on the schedule, not collected revenue. The $76,355 sums the Fee column across all 950 rows, including 114 Scheduled sessions that have not happened yet, 67 No-Shows and 70 Rescheduled rows. Only the 47 Cancelled rows carry a zero fee.
- Several panels labelled “Clients” actually count consultations. The Clients by Diet Plan Type donut, the Clients by Region & Goal column chart and the Weight Loss Clients card (272) all count rows, not distinct people. The only true distinct-client figure in the file is the Active Clients card (217).
- The Overview gauge and the adherence KPI card disagree slightly – 72.6 against 73.9%. The gauge averages the monthly pivot averages; the card averages all 950 rows. Both are correct arithmetic on different groupings.
- Average adherence includes rows that never happened. Cancelled, No-Show and Scheduled rows carry an Adherence % and are included in the 73.9% average; the attended-only average on the sample data is 73.6.
- No date-range picker and no year-over-year view. Filtering is by Month slicer only, on three of the four pages, and the sample covers a single year.
- Cosmetic: the treemap and waterfall render in Google’s default palette rather than the bronze-and-teal theme, and the Monthly Consultation Volume chart on the Dietitians page stops labelling its x-axis at November although all twelve months are plotted.
❓ Frequently Asked Questions
Is the Nutrition & Dietetics Dashboard in Google Sheets a clinical or dietary-advice tool?
No. The Nutrition & Dietetics Dashboard in Google Sheets is a business reporting template. It performs no nutritional assessment, gives no dietary or medical advice, plans no meals and calculates no nutrients. It is not a substitute for a registered dietitian or any other qualified health professional.
Does it store client names or health information?
The Data sheet has a Client Name column and the sample fills it with 217 names, plus a per-consultation Adherence %, Weight Change and Calorie Target. There is no date of birth, address, contact detail, diagnosis, medication, allergy or lab value column. You can use client codes instead of names and every figure still works.
Does it connect to my practice-management system or EHR?
No. The Nutrition & Dietetics Dashboard in Google Sheets is a static Google Sheet with no live connection to any EHR, practice-management system, booking tool, payment processor or nutrient database. You paste your consultation log into the Data tab and the pivots, charts and slicers redraw.
What KPIs does the Nutrition & Dietetics Dashboard in Google Sheets track?
Sixteen KPI cards across four pages: total consultations, active clients, total fees billed, average goal adherence, total weight change, weight-loss consultations, average fee per session, average calorie target, plans in use, active dietitians, consults per dietitian and attended consults, plus twelve rail metrics.
How long does setup take?
Under 10 minutes. Open the PDF, click the Google Sheets link to copy the file into your own Drive, then paste your consultations over the 950 sample rows on the Data tab keeping all 17 headers intact. Every chart, pivot and Top 5 panel updates automatically.
How does this compare to a paid BI suite like Tableau or Qlik?
A practice BI suite costs $70-$150 per user per month and needs a data model built first. The Nutrition & Dietetics Dashboard in Google Sheets is $9.99 once, works in a browser, and is ready in minutes – at the cost of a 1,000-row default capacity and no live data connectors.
Can more than one dietitian use it at the same time?
Yes. It is a normal Google Sheet, so multiple practitioners can open and edit it together with no extra licence. Remember that slicer selections are shared in a live file – if two people filter the same page at once they will see each other’s filter.
👤 About the Author
Built by PK – Microsoft Certified Professional with 15+ years of Excel, Google Sheets and Power BI experience. Founder of NextGenTemplates, reaching 300K+ subscribers across YouTube channels (@PK-AnExcelExpert, @NextGenTemplates, @NeoTechNavigators). Every template is hand-built and tested before release.
🔗 Explore Related Templates
Also available as: the same nutrition and dietetics reporting exists on two other platforms – the Nutrition & Dietetics Dashboard in Excel for desktop pivot work, and the Nutrition & Dietetics Dashboard in Power BI for a modelled .pbix version.
If you want a scorecard rather than an analytical dashboard, the Nutrition & Dietetics KPI Dashboard in Excel is a different template with a month picker and traffic lights – a companion, not a duplicate of this one.
For client-side record keeping, pair this with the Doctor Appointments & Medical History Tracker in Google Sheets or the Lab Results & Health Metrics Tracker in Google Sheets. Browse the full range of Google Sheets Dashboards for other industries, including the Market Research Dashboard in Google Sheets built on the same pivot-and-slicer architecture.
📖 Click here to read the Detailed Blog Post
🎥 Visit our YouTube channel for step-by-step video tutorials
👉 YouTube.com/@NextGenTemplates
Watch the step-by-step video Demo:
📅 Last updated: September 2026
Compatibility and Requirements
- Works in Google Sheets. You need a free Google account and a web browser.
- The four pages use slicers and native pivot tables. Google explains how charts work in Add and edit a chart or graph.






























Reviews
There are no reviews yet.