

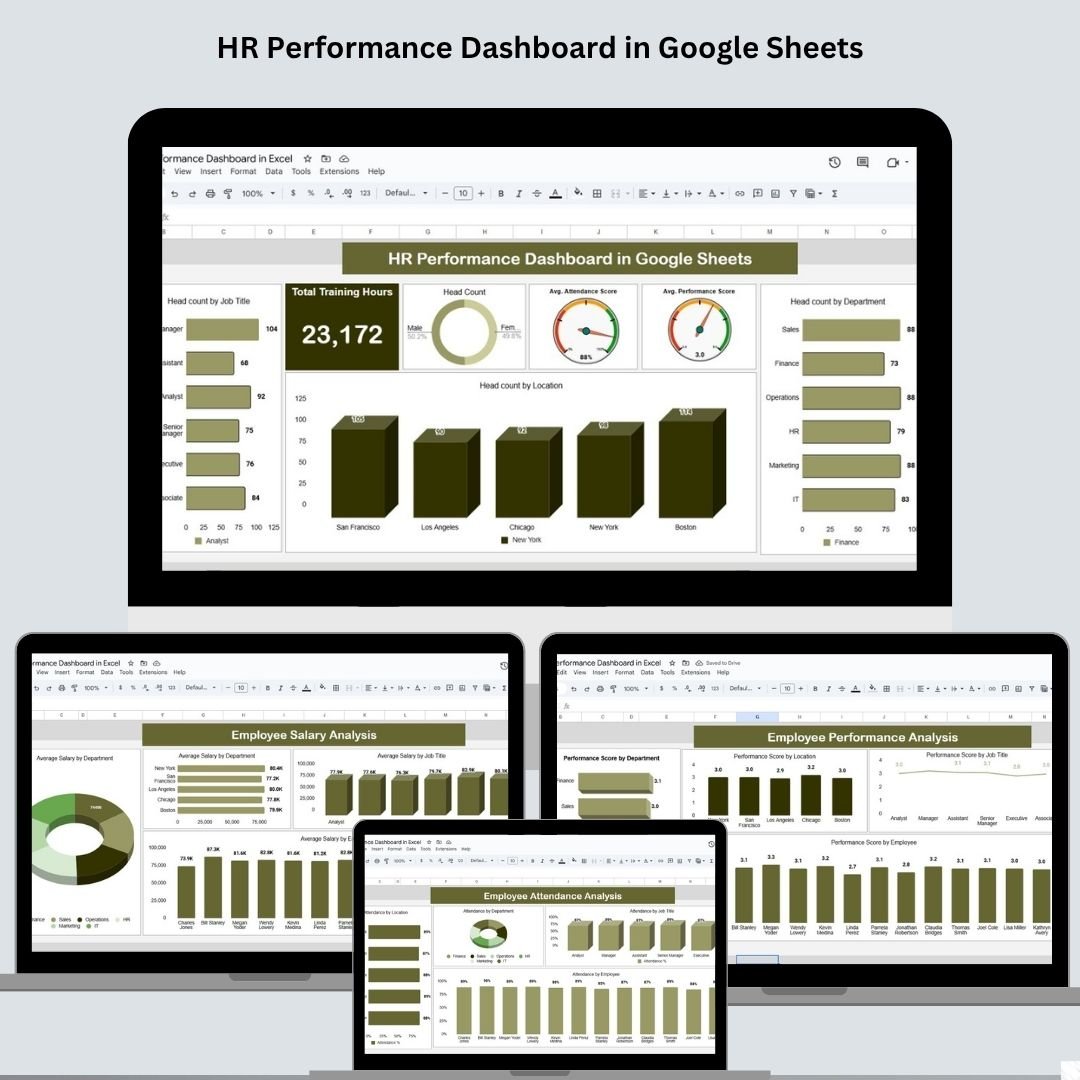
Effective HR management starts with clear, real-time insights into your workforce. The HR Performance Dashboard in Google Sheets is your all-in-one solution for tracking, analyzing, and optimizing employee performance, attendance, compensation, and training across the organization.
Whether you manage a small team or a large department, this interactive, no-code Google Sheets template enables data-driven HR decision-making with ease. It’s fully customizable, visually engaging, and updates instantly as you input new data—no complex setup required.
🔍 Key Features of the Dashboard
This Google Sheets dashboard includes 6 key sheets, each focused on a specific aspect of HR performance:
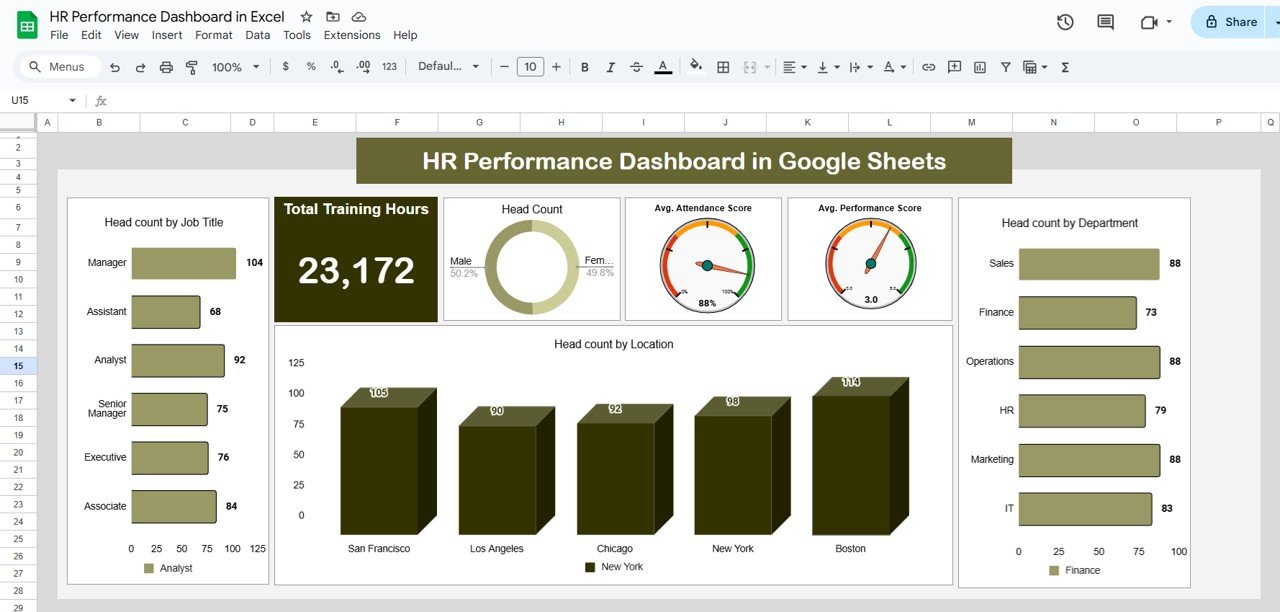
📊 1. Overview Sheet Tab
Get a quick summary of your key HR metrics in one view.
-
Cards:
✔️ Total Training Hours -
Charts:
👥 Head Count
📅 Avg. Attendance Score
🧠 Avg. Performance Score
💼 Head Count by Job Title
📍 Head Count by Location
🏢 Head Count by Department
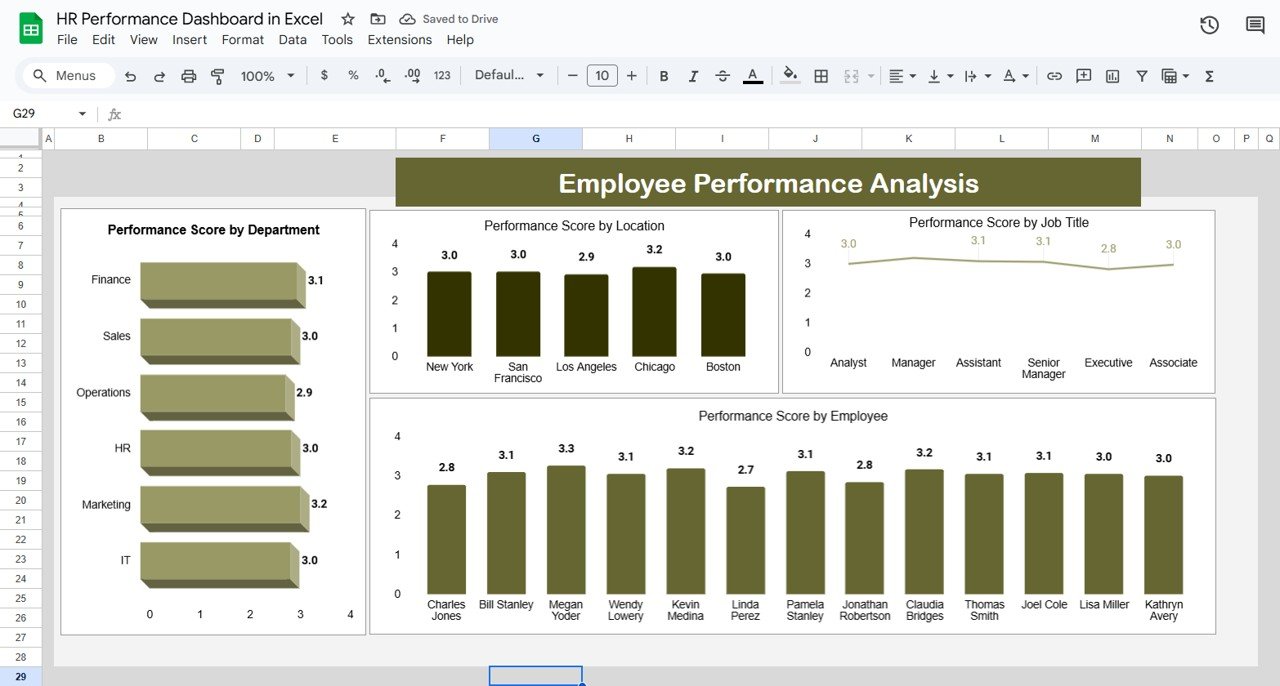
⭐ 2. Employee Performance Sheet Tab
Visualize and track employee performance across various dimensions:
-
Performance Score by:
-
Department
-
Location
-
Job Title
-
Individual Employee
-
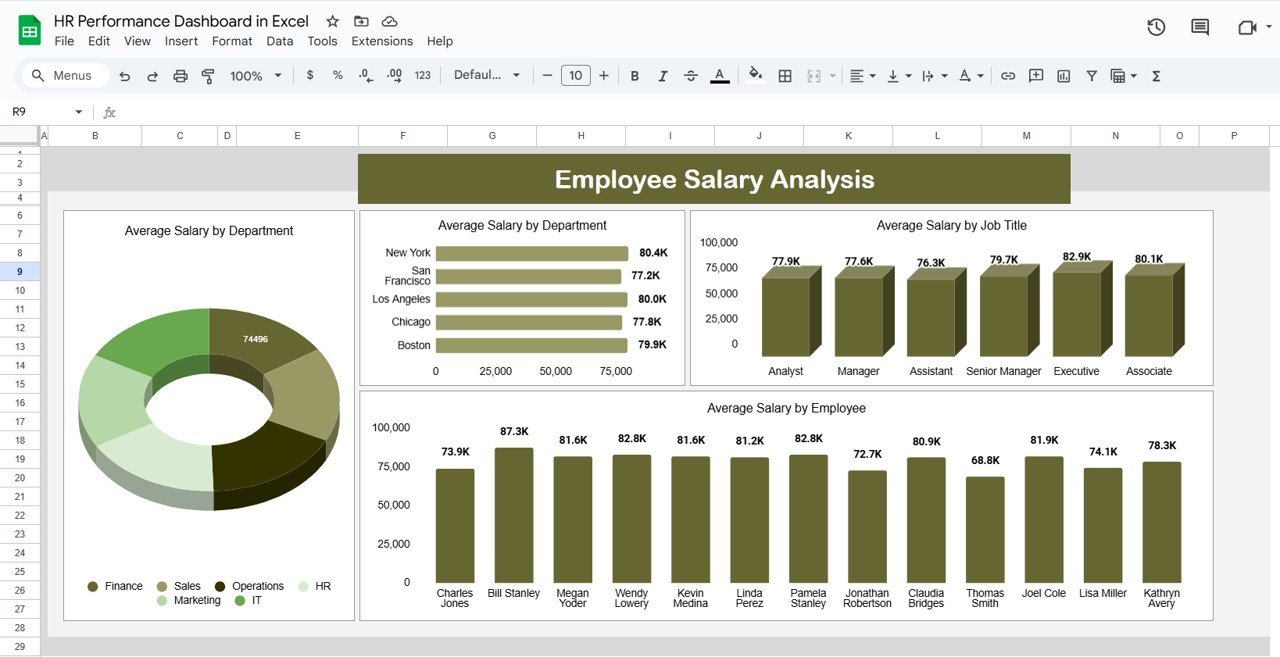
💰 3. Salary Analysis Sheet Tab
Understand compensation distribution at every level:
-
Average Salary by:
-
Department
-
Job Title
-
Individual Employee
-
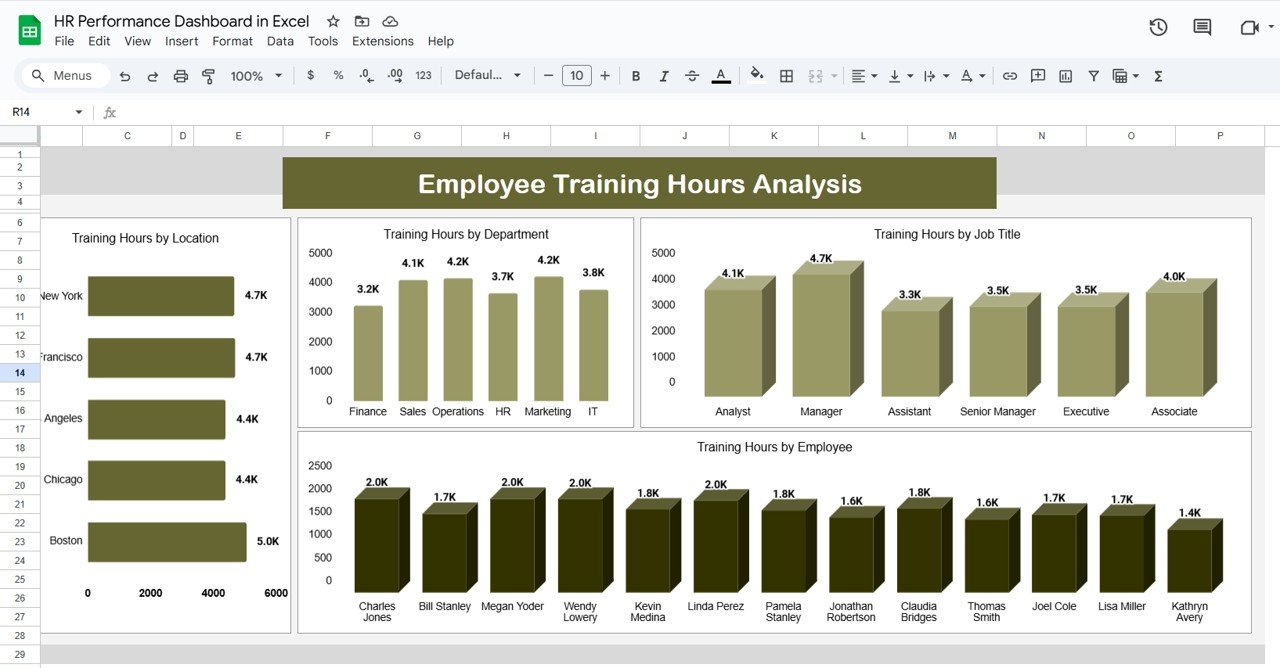
📚 4. Training Hours Sheet Tab
Measure learning and development efforts with precision:
-
Training Hours by:
-
Location
-
Department
-
Job Title
-
Employee
-
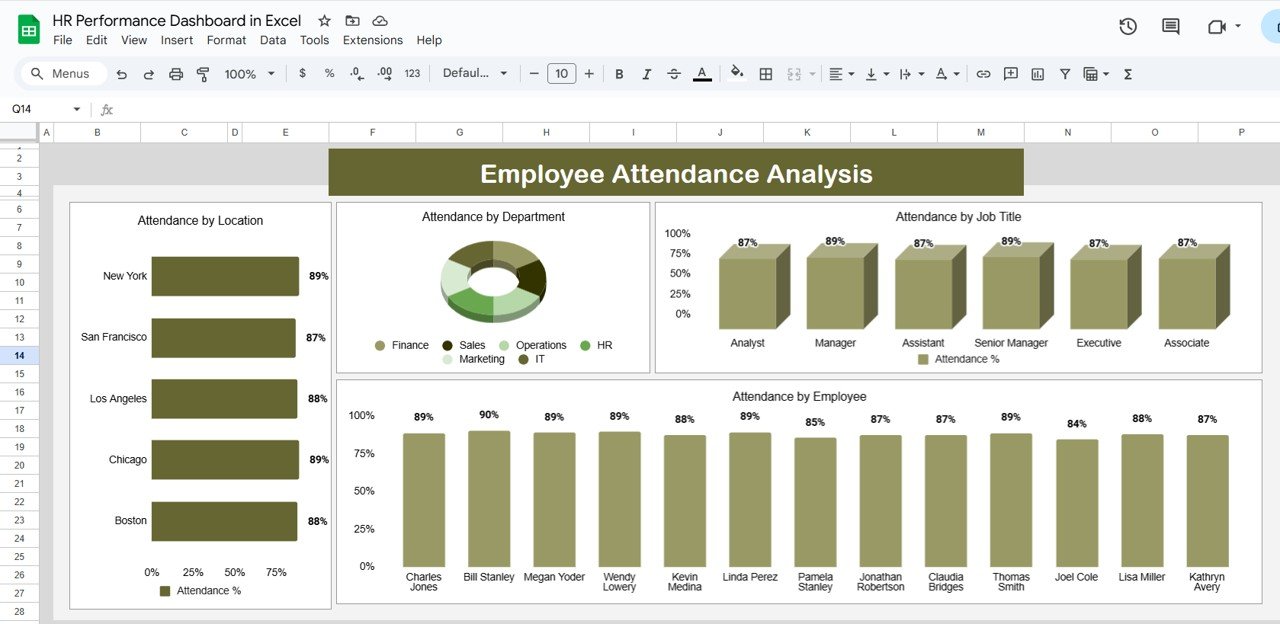
📅 5. Attendance Sheet Tab
Stay on top of employee attendance patterns and issues:
-
Attendance Trends by:
-
Location
-
Department
-
Job Title
-
Employee
-
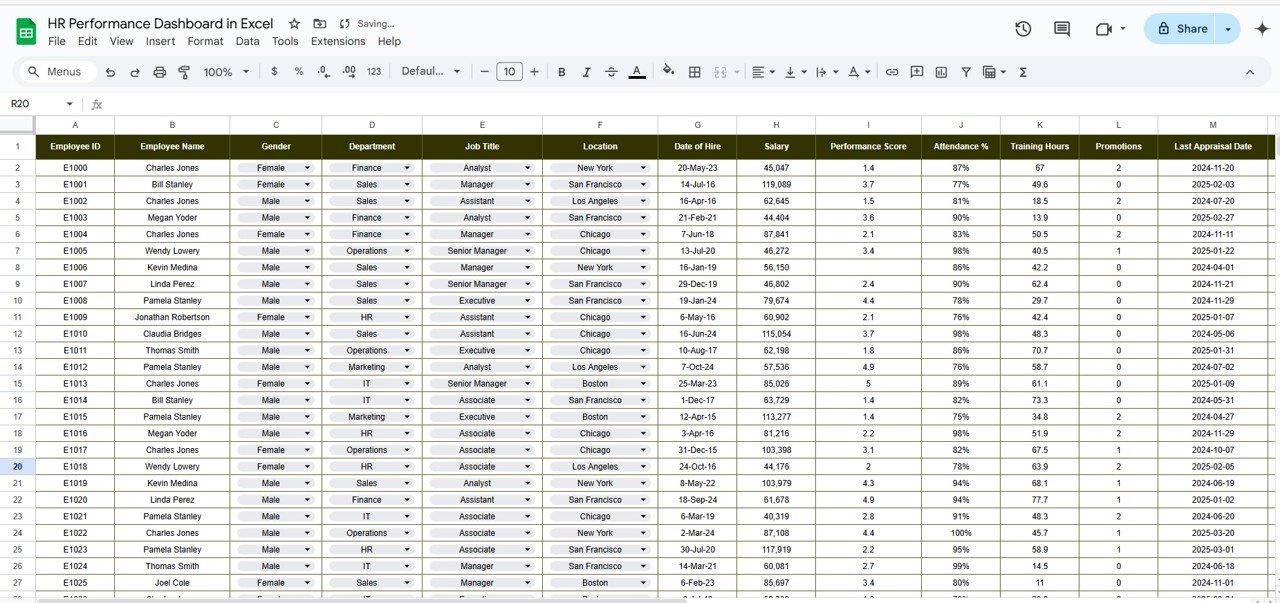
🗂️ 6. Data Sheet Tab
Input your employee data once and let the dashboards do the rest. Columns include:
-
Employee Name
-
Job Title
-
Department
-
Location
-
Attendance Score
-
Performance Score
-
Training Hours
-
Salary
🚀 Advantages of Using This HR Dashboard
📌 Centralized Data Management
Track all HR metrics—performance, training, salary, and attendance—in one organized place.
📈 Real-Time Analytics
Update the Data Sheet, and watch your dashboards refresh automatically.
🧩 Fully Customizable
Add or remove columns, KPIs, or visualizations to match your HR goals.
📊 Clear Visual Insights
From charts to breakdowns, everything is easy to interpret and presentation-ready.
🧠 Informed Decision Making
Base promotions, training programs, and performance reviews on actual metrics—not assumptions.
💡 Best Practices for Success
✔️ Update Data Regularly
Keep your dashboard accurate by routinely updating the Data Sheet.
✔️ Track Trends Over Time
Use KPI comparisons to spot high or low performers and develop improvement plans.
✔️ Leverage Employee Data for Growth
Use training and performance data to build targeted development initiatives.
✔️ Share with Stakeholders
Make real-time HR performance visible to leadership without exporting reports.







Reviews
There are no reviews yet.