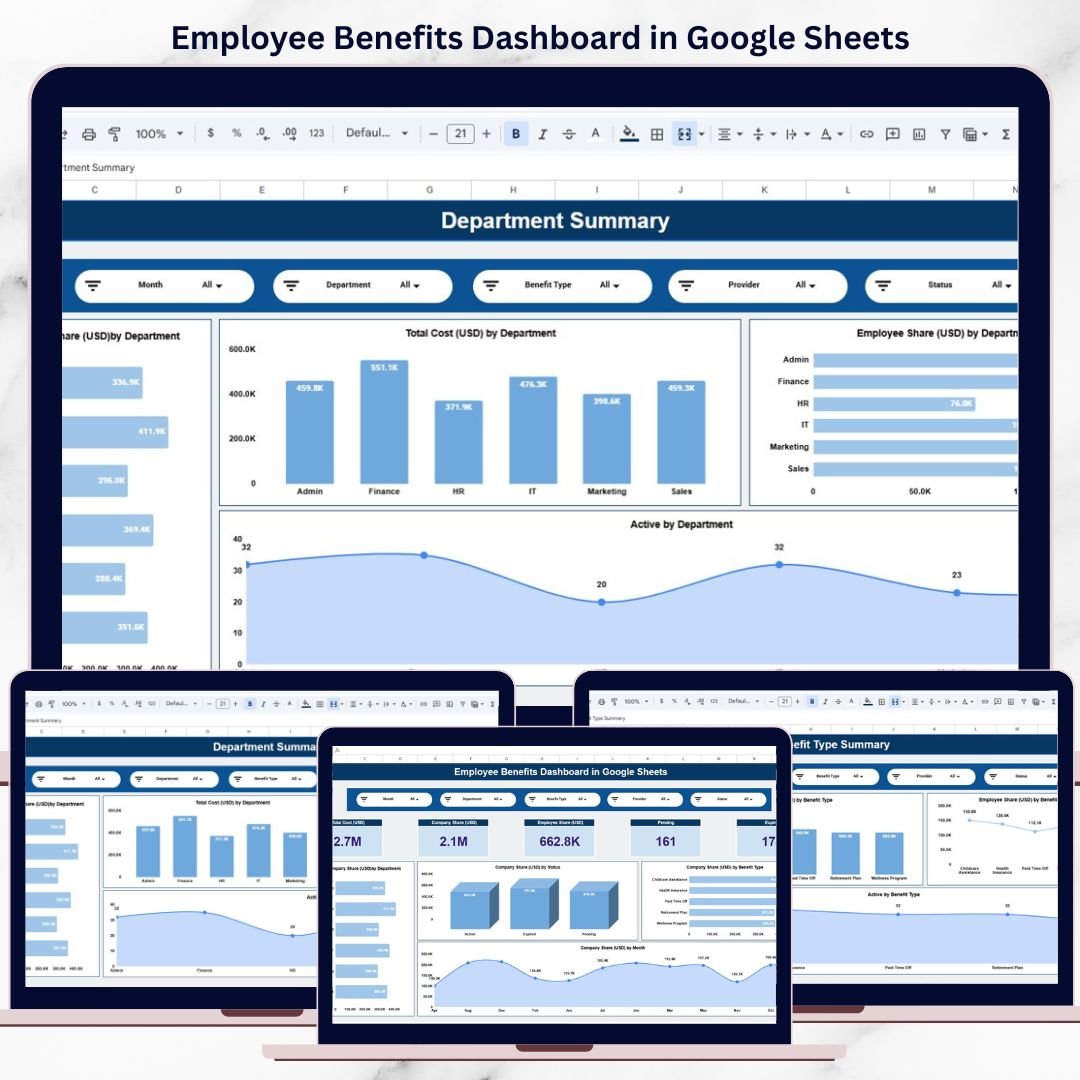
Employee benefits play a vital role in attracting, retaining, and motivating top talent. However, as organizations grow, managing benefits data across departments, providers, benefit types, and months becomes increasingly complex. When benefits data remains scattered across spreadsheets, HR teams struggle with cost control, participation tracking, and reporting accuracy.Employee Benefits Dashboard in Google Sheets
That is exactly why the Employee Benefits Dashboard in Google Sheets becomes an essential HR analytics and decision-support tool.Employee Benefits Dashboard in Google Sheets
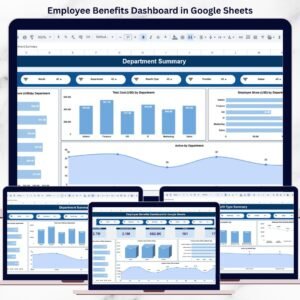
This ready-to-use dashboard transforms raw benefits data into clear KPIs, visual insights, and actionable trends. Instead of manually preparing reports, HR and leadership teams can instantly monitor total benefits cost, company and employee contributions, benefit utilization, and provider performance—all in one centralized Google Sheets dashboard.
Because the dashboard is built entirely in Google Sheets, it is cloud-based, collaborative, cost-effective, and easy to customize, with no technical skills or additional software required.
🔑 Key Features of the Employee Benefits Dashboard
📊 Executive-Level Benefits Overview
Instantly understand total benefits exposure with dynamic KPI cards and charts.
💰 Company vs. Employee Contribution Tracking
Clearly distinguish employer-paid and employee-paid benefit costs.
🏢 Department-Wise Analysis
Identify teams with higher benefits cost or participation.
🧾 Benefit Type & Provider Insights
Evaluate which benefits and vendors drive the most value and cost.
📈 Monthly Trends & Forecasting
Track benefit cost growth and participation patterns over time.
🤝 Real-Time Collaboration
Multiple HR and finance users can work together in Google Sheets.
📌 What’s Inside the Employee Benefits Dashboard
🗂️ Overview Sheet – Benefits Snapshot
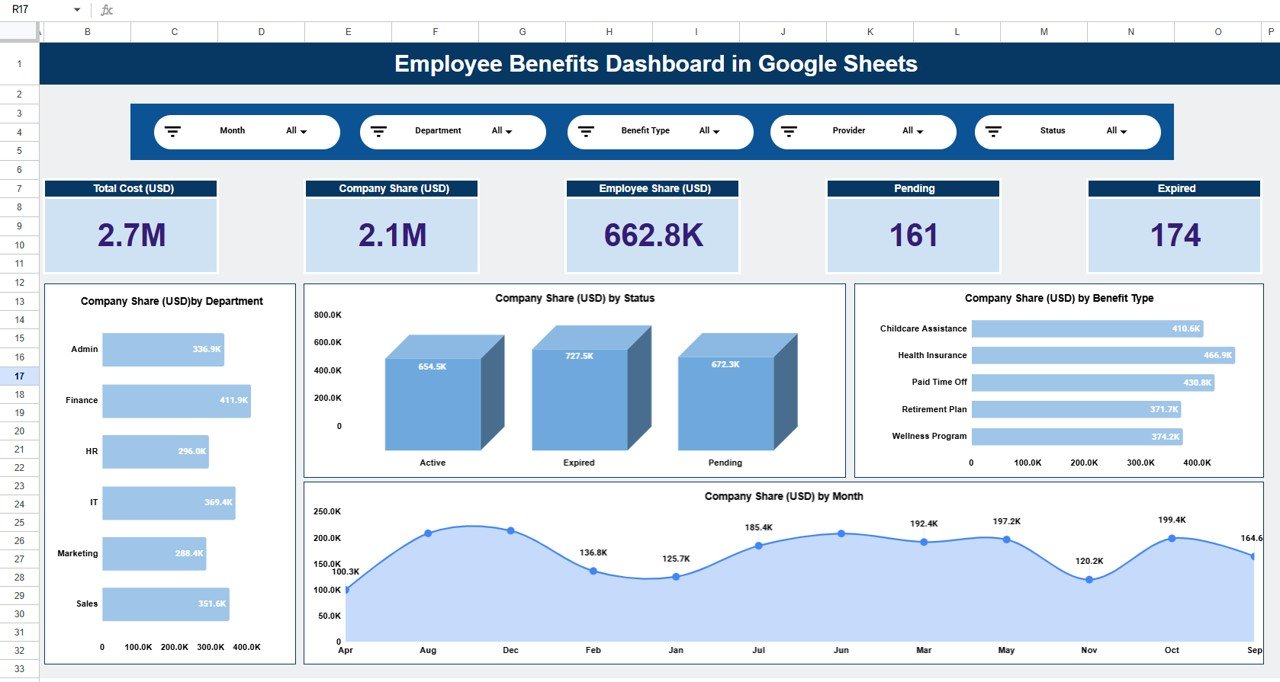
The Overview Sheet provides a high-level summary of benefits performance.
KPI Cards Display:
Total Cost (USD)
Company Share (USD)
Employee Share (USD)
Pending Benefits
Expired Benefits
These KPIs help leadership understand benefits exposure at a glance.
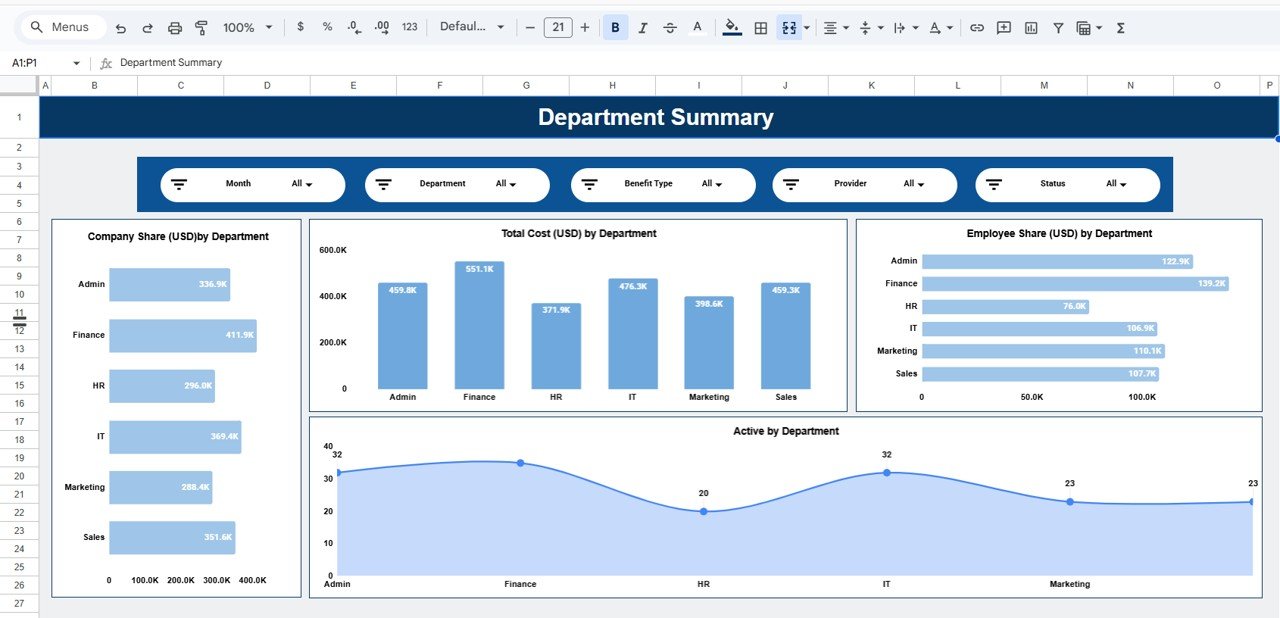
🏢 Department Summary – Team-Level Insights
This section analyzes benefits distribution across departments.
Charts Included:
Company Share (USD) by Department
Total Cost (USD) by Department
Employee Share (USD) by Department
Active Benefits by Department
HR teams can quickly identify departments with higher benefit spend or engagement.
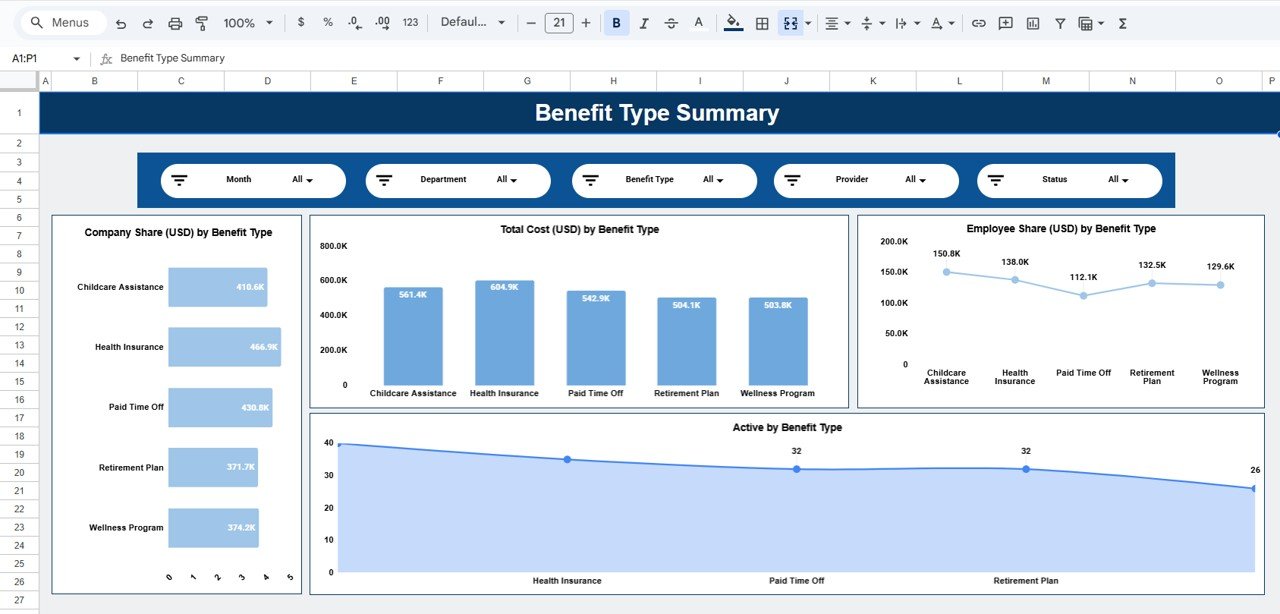
🧩 Benefit Type Summary – Utilization Analysis
Different benefits have different cost and adoption patterns. This section highlights benefit-wise insights.
Key Visuals:
Company Share (USD) by Benefit Type
Total Cost (USD) by Benefit Type
Employee Share (USD) by Benefit Type
Active Benefits by Benefit Type
This analysis supports benefit optimization and redesign decisions.
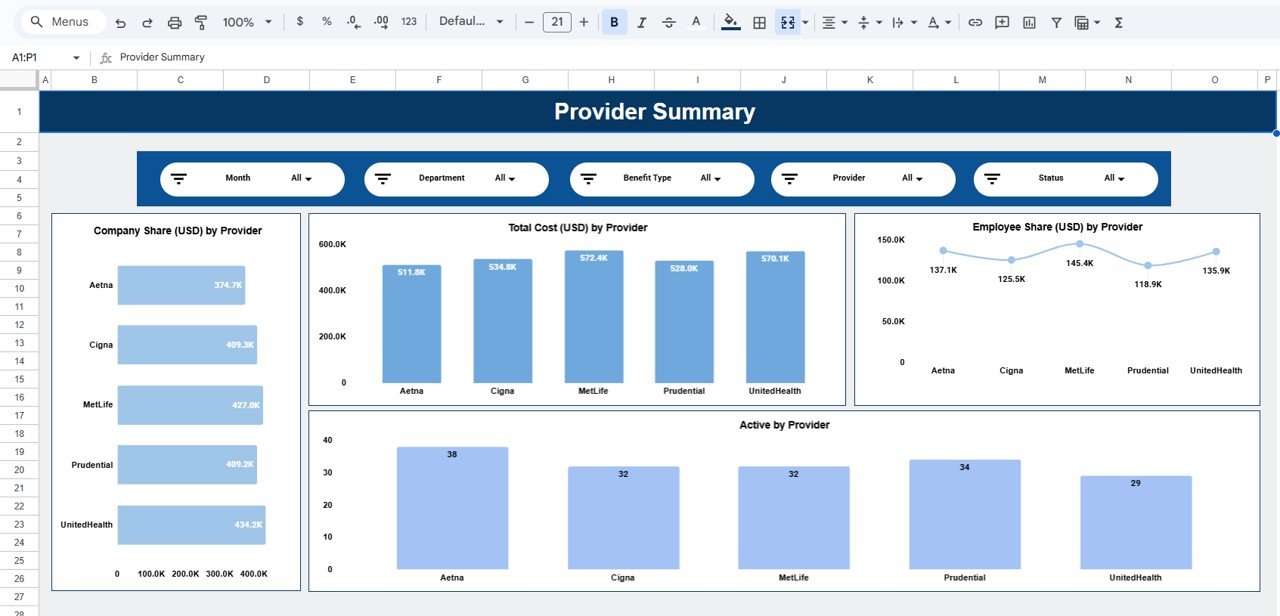
🤝 Provider Summary – Vendor Performance Monitoring
Organizations often work with multiple benefits providers. This section evaluates provider-level performance.
Charts Covered:
Company Share (USD) by Provider
Total Cost (USD) by Provider
Employee Share (USD) by Provider
Active Benefits by Provider
Procurement and HR teams can use these insights for vendor reviews and contract negotiations.
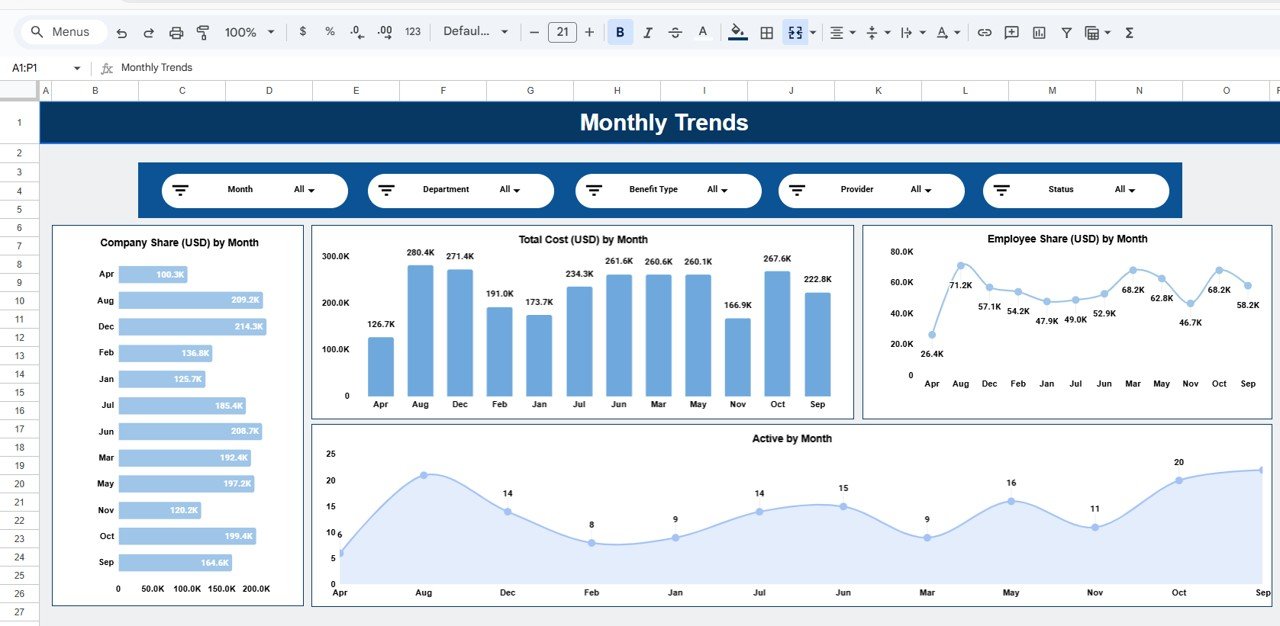
📅 Monthly Trends – Benefits Over Time
The Monthly Trends section tracks how benefits evolve over time.
Trend Charts Include:
Company Share (USD) by Month
Total Cost (USD) by Month
Employee Share (USD) by Month
Active Benefits by Month
These trends help forecast future benefits budgets and identify seasonal spikes.
👥 Who Should Use This Dashboard
HR managers & HR business partners
Compensation & benefits teams
Finance & payroll teams
Business leaders & executives
Growing organizations and enterprises
🚀 How to Use the Dashboard
Enter or update benefits data in the data sheet
Use filters to slice by department, provider, or benefit type
Review cost and participation trends monthly
Track expired and pending benefits proactively
Share insights with HR leadership
No advanced Google Sheets skills required.
Click here to read the Detailed blog post
Watch the step-by-step video tutorial: