

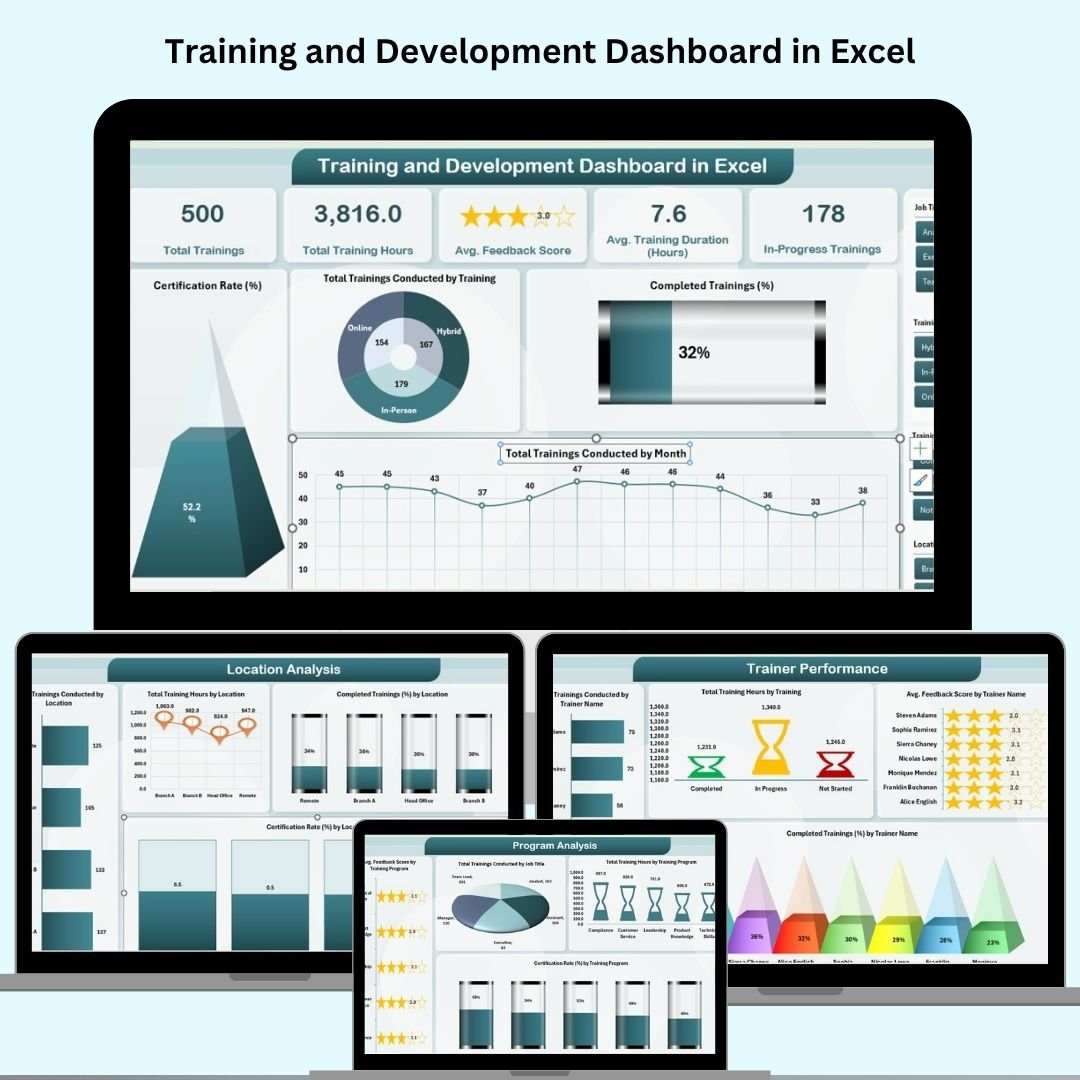
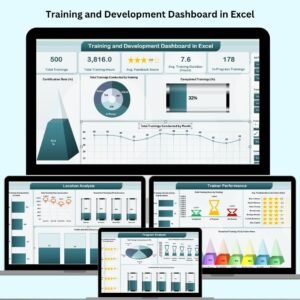
Unlock the full potential of your training programs with our Training and Development Dashboard in Excel. Designed for HR teams, L&D managers, and organizational leaders, this ready-to-use dashboard offers a centralized view of training performance, helping you track completion rates, feedback scores, trainer effectiveness, and more. Whether you’re running onboarding programs or skill upgrades, this tool helps you measure impact and make data-driven improvements effortlessly.
📊 Key Features of the Training and Development Dashboard in Excel
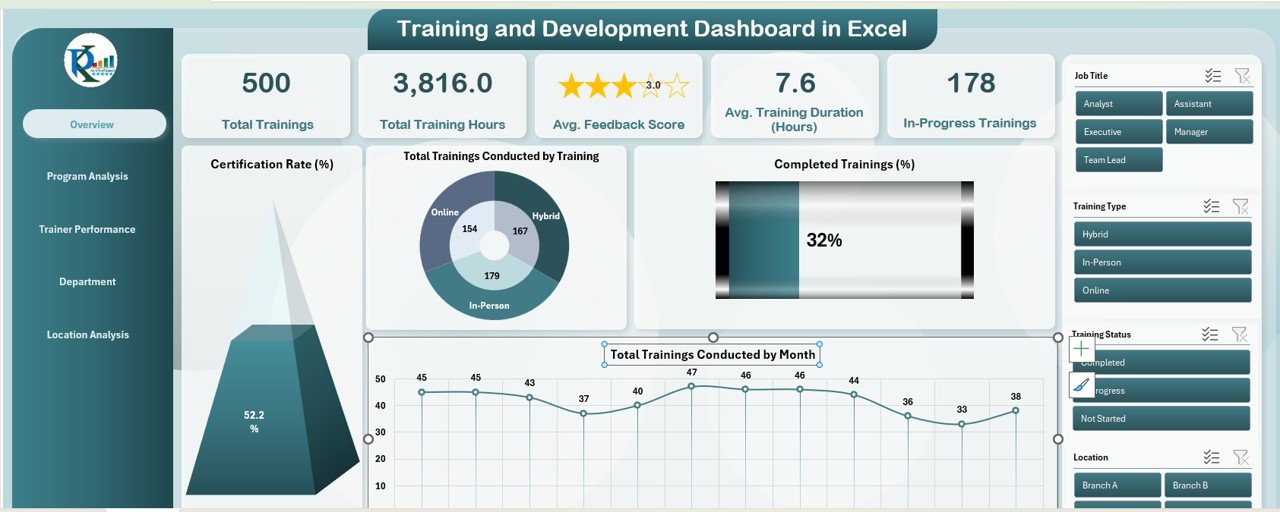
📋 Overview Sheet Tab
Your training performance snapshot in one place:
✅ Total Trainings Conducted
⏱️ Total Training Hours
⭐ Avg. Feedback Score
🕒 Avg. Training Duration
📌 In-Progress Trainings
📈 Charts Included:
Certification Rate (%)
Trainings Conducted by Program
Completed Trainings (%)
Monthly Training Trends
🎯 All charts update dynamically with the data you input—no manual setup needed.
📁 What’s Inside the Dashboard?
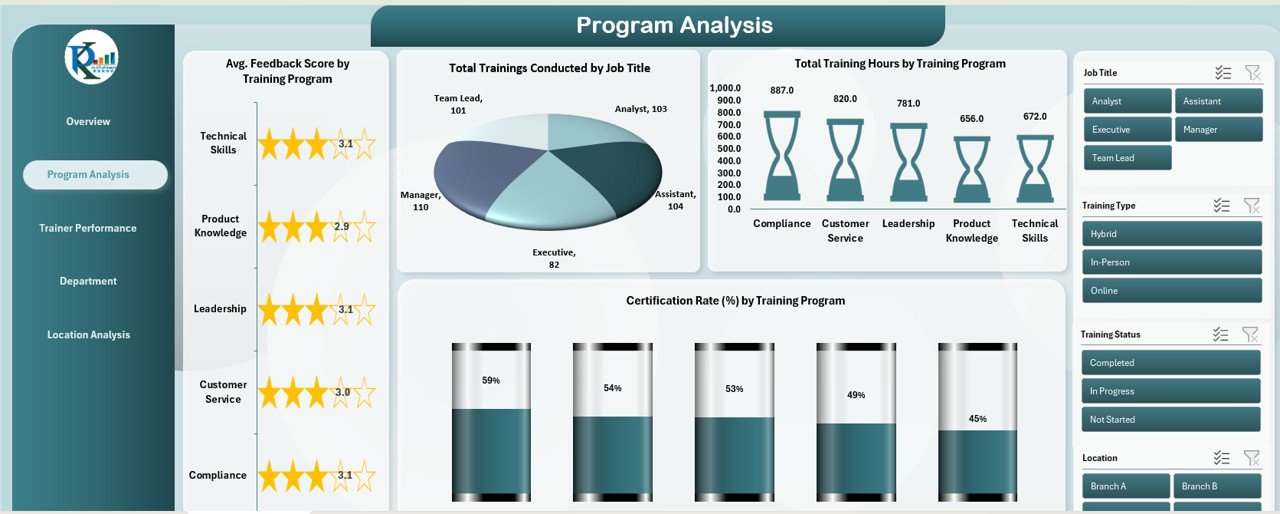
1️⃣ Program Analysis Sheet Tab
Drill down into training programs with key charts:
Avg. Feedback by Program
Training Hours by Program
Trainings by Job Title
Certification Rate by Program
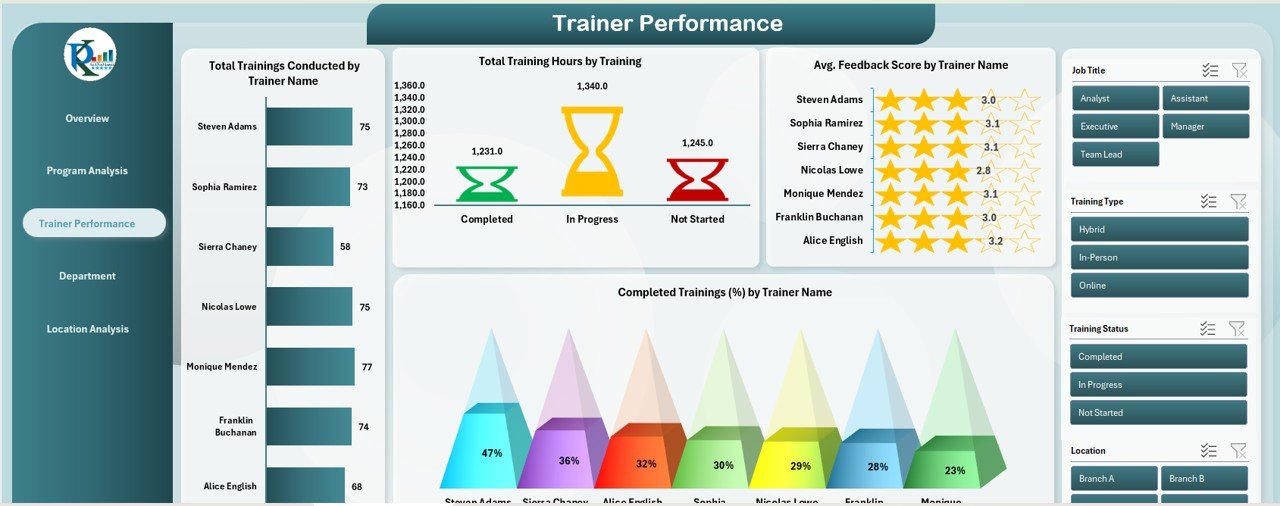
2️⃣ Trainer Performance Sheet Tab
Evaluate your trainers with:
Trainings Conducted per Trainer
Total Training Hours per Trainer
Avg. Feedback Score by Trainer
Completion Rate by Trainer
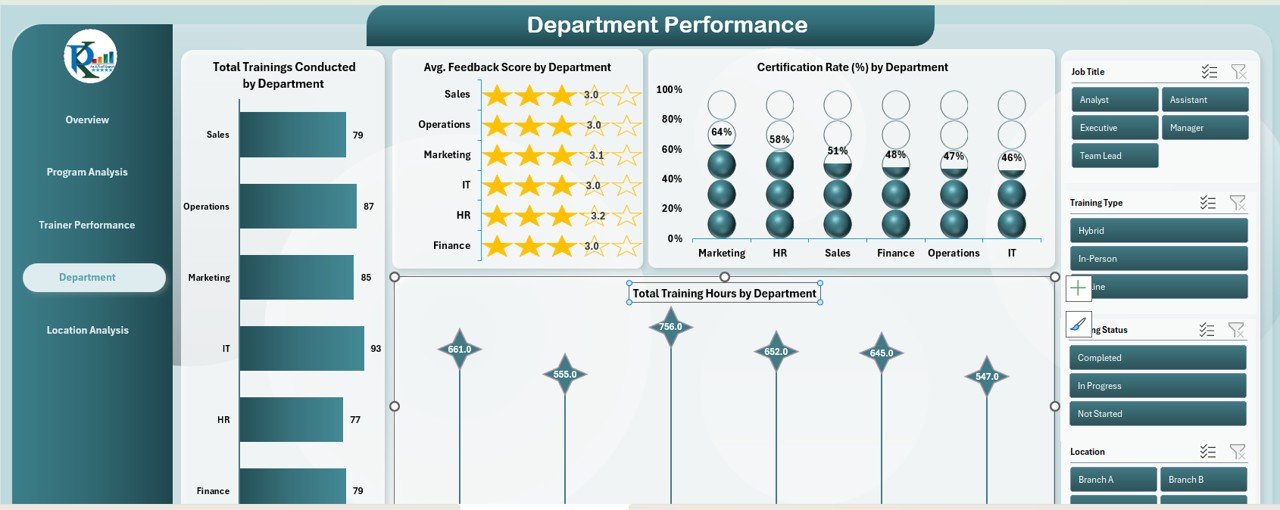
3️⃣ Department Performance Sheet Tab
Compare training activity across departments:
Total Trainings by Department
Avg. Feedback by Department
Certification Rate
Training Hours by Department
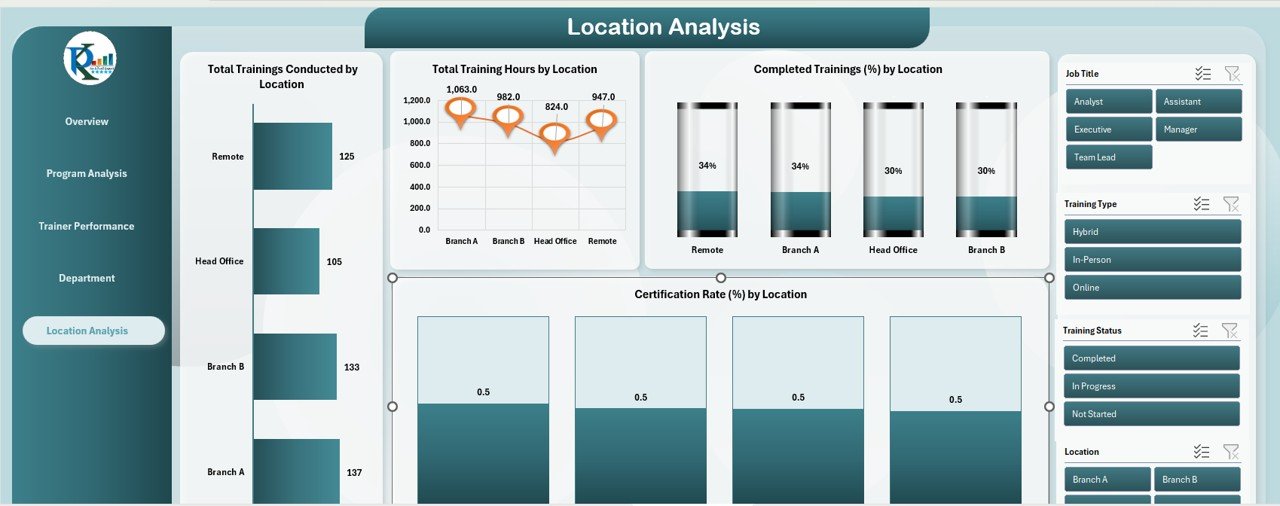
4️⃣ Location Analysis Sheet Tab
Track geographic performance:
Trainings Conducted by Location
Total Hours and Completion Rates
Certification Rate by Location
5️⃣ Data Sheet Tab
Capture raw training session data:
Training Title, Program Name
Department, Location, Job Title
Trainer Name
Feedback Score, Duration, Status
Certification Achieved
🧩 Every metric, chart, and KPI auto-updates from this central input sheet.
🚀 How to Use the Dashboard
📥 Step 1: Enter training data into the Data Sheet
📊 Step 2: View real-time insights in each analytical tab
🎓 Step 3: Use filters to dive into specific programs or locations
📈 Step 4: Monitor trends and adjust training schedules accordingly
📤 Step 5: Share or export dashboards for HR reviews or leadership reports
No coding. No complex setup. Just plug in data and start optimizing.
👥 Who Can Benefit from This Dashboard?
🧑💼 HR & L&D Managers – Monitor program effectiveness and track results
🏢 Corporate Trainers – Analyze feedback and training reach
📈 Leadership Teams – Understand learning impact across departments
👨🏫 Training Coordinators – Stay organized with certification tracking
🌎 Global Teams – Analyze training distribution by location
From onboarding to leadership development, this dashboard fits any training initiative.
💡 Why This Excel Dashboard Stands Out
✅ Fully dynamic and customizable
✅ Interactive charts and slicers
✅ Centralized tracking of sessions, trainers, and certifications
✅ Real-time data updates as you enter new training records
✅ Works 100% in Excel—no add-ins required
✅ Print or export for HR presentations and leadership briefings
It’s not just a dashboard—it’s your training command center.
🔁 Click here to read the Detailed blog post
Click here to read the Detailed blog post











Reviews
There are no reviews yet.