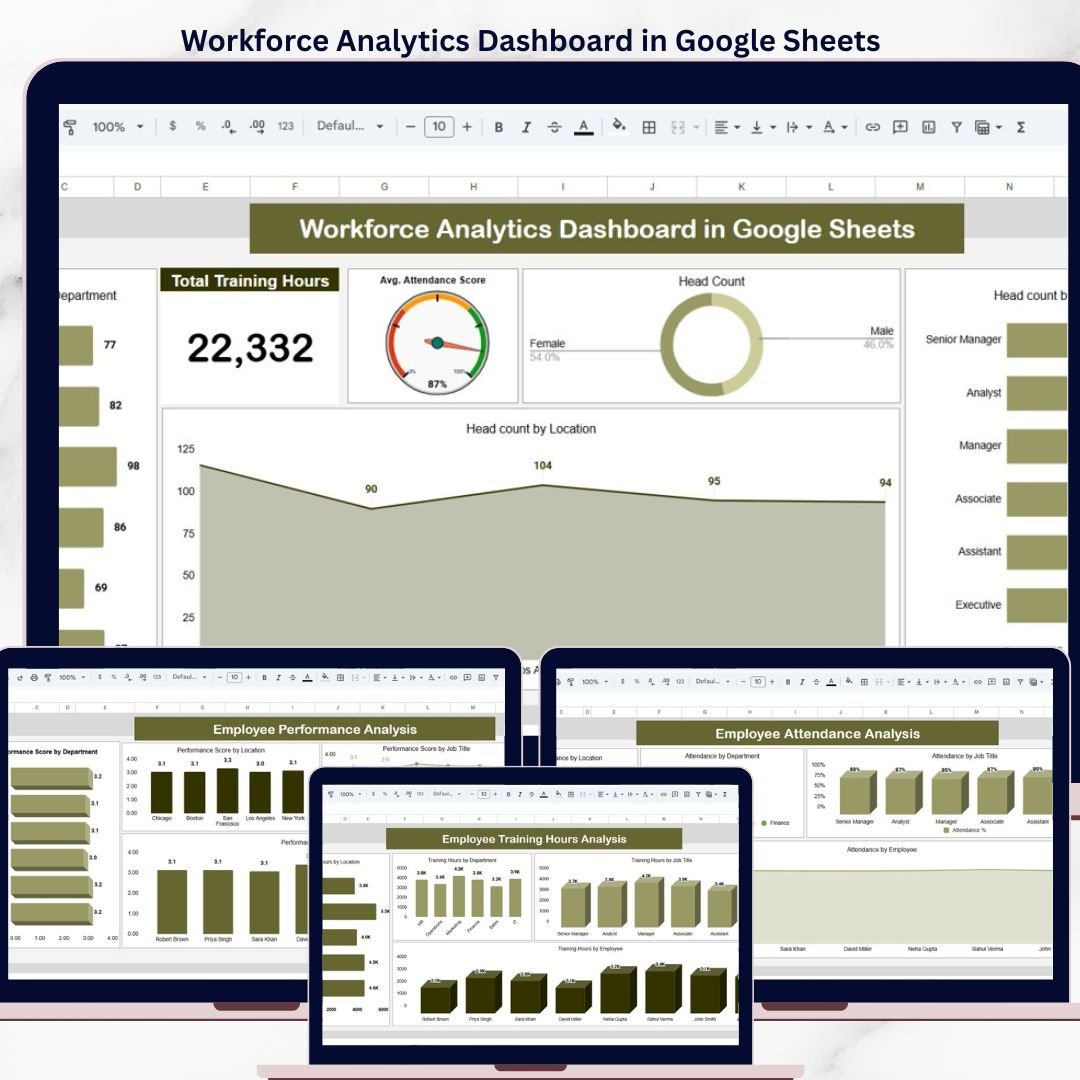
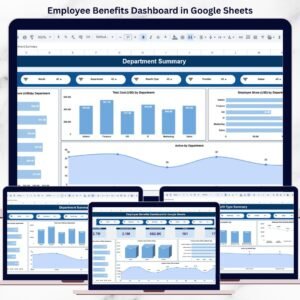
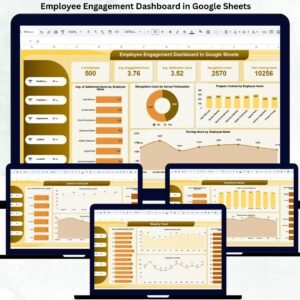
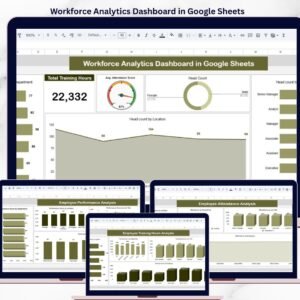
The Workforce Analytics Dashboard in Google Sheets tracks employee data across 6 interactive pages, covering salary analysis, training hours, performance scores, and attendance — all with dynamic slicers and pre-built charts. 3 KPI cards on the overview page deliver headcount, average attendance score, and total training hours at a glance. Setup takes under 10 minutes — just paste your employee data and the entire dashboard recalculates automatically.
🌍 Join 8,400+ teams in 40+ countries using NextGenTemplates to replace paid SaaS tools with one-time-purchase Google Sheets, Excel, Power BI, and HTML templates.
✅ Instant download · One-time payment · No subscription · No per-user fees · Lifetime access
🔑 Key Features of the Workforce Analytics Dashboard in Google Sheets
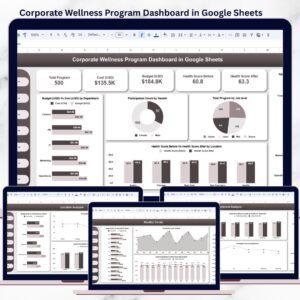
📊 6-Page Dashboard Structure — Overview, Salary Analysis, Training Hours Analysis, Performance Analysis, Attendance Analysis, and Data Sheet. Each page delivers focused insights with dedicated charts and breakdowns.
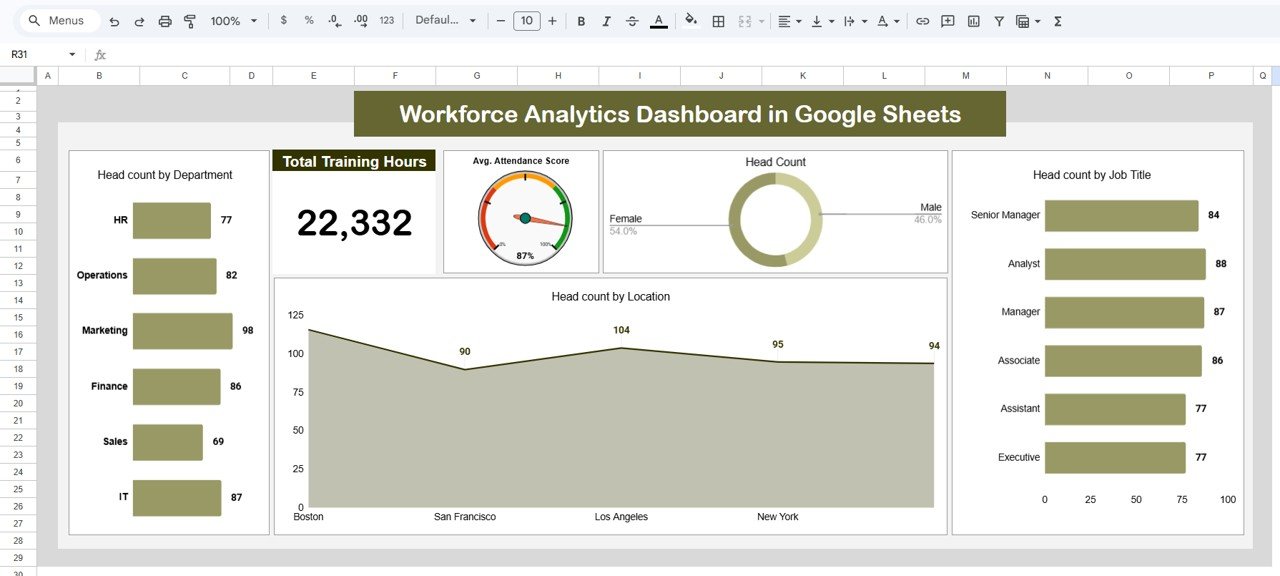
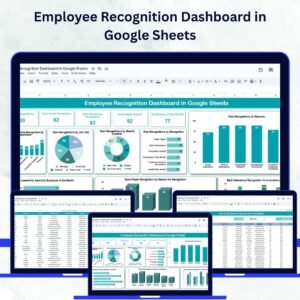
📈 3 KPI Summary Cards — Total Training Hours, Avg. Attendance Score, and Head Count are displayed prominently on the overview page, giving HR managers an instant pulse check on workforce health.
🔍 Multiple Slicers for Quick Filtering — Apply filters by department, location, job title, or employee to instantly slice the data across every chart on the overview page. No formulas to edit — just click and filter.
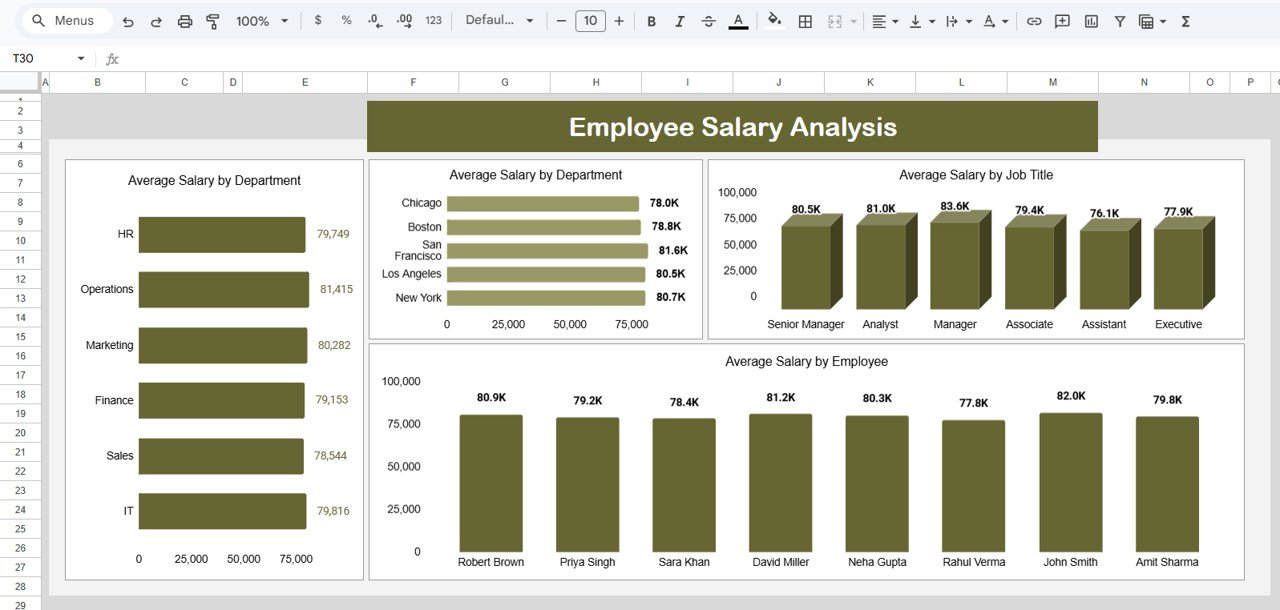
💰 Salary Benchmarking by 4 Dimensions — Average salary breakdowns by Department, Location, Job Title, and individual Employee help you spot pay gaps and budget allocation issues in seconds.
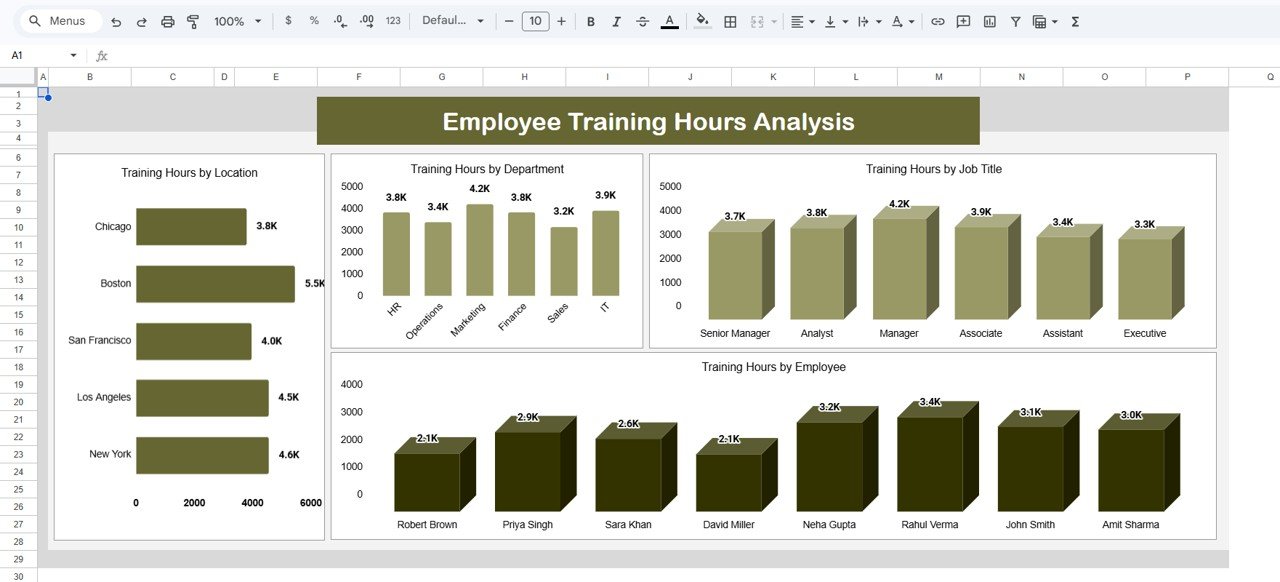
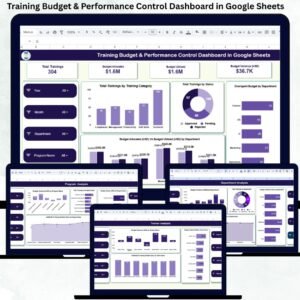
🎓 Training Hours Tracking — Analyze training investment by Location, Department, Job Title, and Employee. Identify which teams or roles are getting the most (or least) development hours.
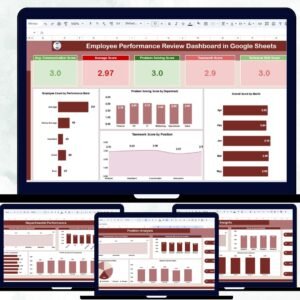
⭐ Performance Score Analysis — Visualize performance scores by Department, Location, Job Title, and Employee. Quickly identify top performers and teams that need support.
📋 Attendance Monitoring — Track attendance patterns by Location, Department, Job Title, and Employee. Spot absenteeism trends before they become a problem.
🔗 Explore more Google Sheets Dashboard Templates or browse our full HR & Payroll Templates collection.
📦 What’s Inside the Workforce Analytics Dashboard
📄 Page 1 — Overview Dashboard: High-level workforce snapshot with 3 KPI cards (Total Training Hours, Avg. Attendance Score, Head Count) and charts showing Head Count by Department, Head Count by Location, and Head Count by Job Title. Multiple slicers let you filter the entire page instantly.
 Workforce Analytics Dashboard in Google Sheets
📄 Page 2 — Employee Salary Analysis: Dedicated salary benchmarking with Average Salary by Department, Average Salary by Location, Average Salary by Job Title, and Average Salary by Employee charts.
 Employee Salary Analysis
📄 Page 3 — Employee Training Hours Analysis: Training investment visibility with Training Hours by Location, Training Hours by Department, Training Hours by Job Title, and Training Hours by Employee.
 Employee Training Hours Analysis
📄 Page 4 — Employee Performance Analysis: Performance score visualization with Performance Score by Department, Performance Score by Location, Performance Score by Job Title, and Performance Score by Employee.
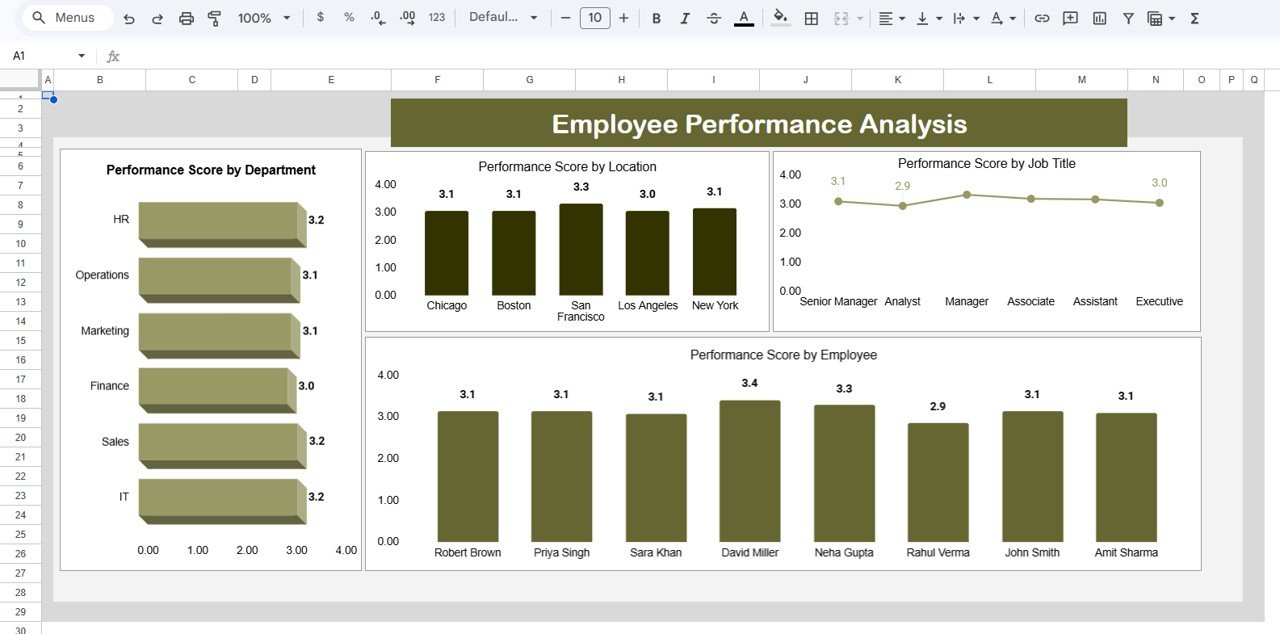 Employee Performance Analysis
📄 Page 5 — Employee Attendance Analysis: Attendance tracking with Attendance by Location, Attendance by Department, Attendance by Job Title, and Attendance by Employee.
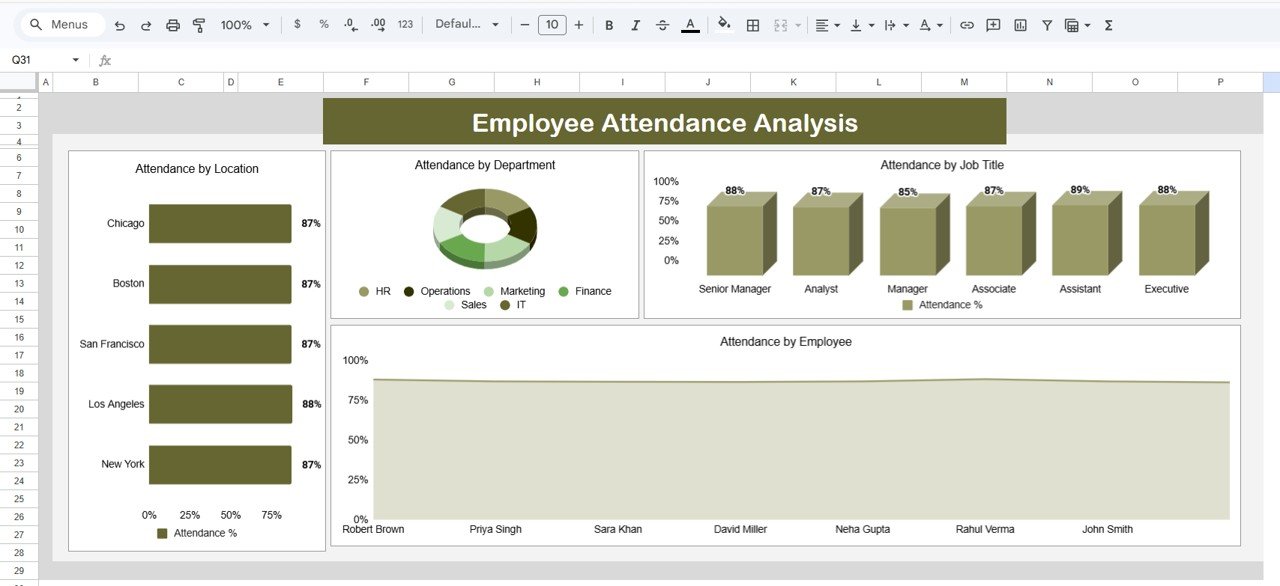 Employee Attendance Analysis
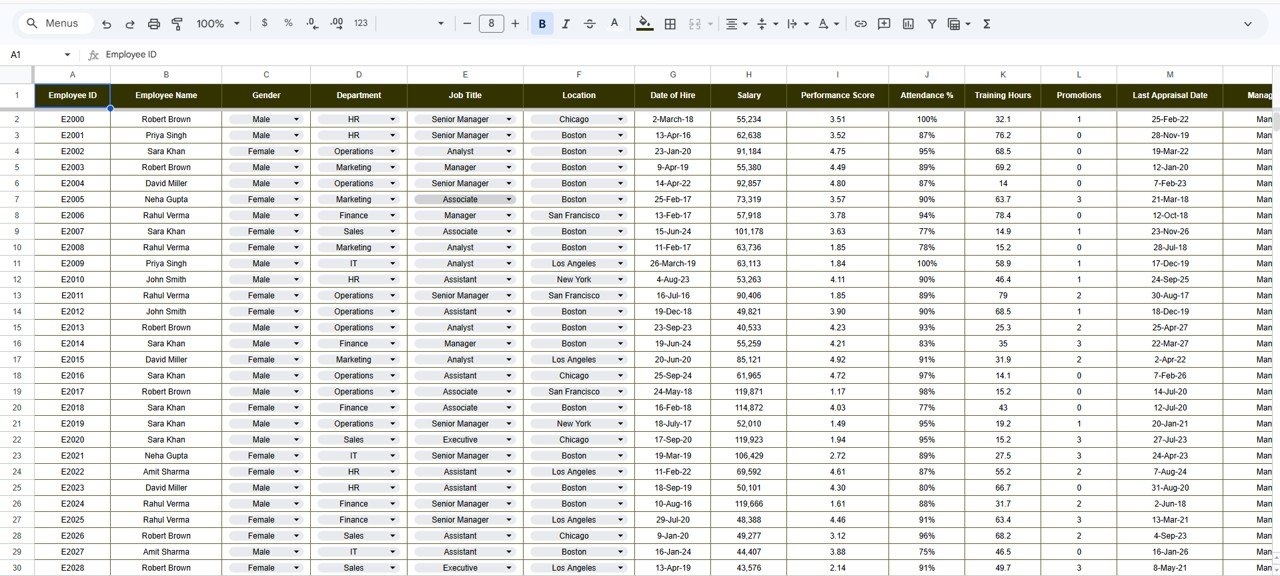
📄 Page 6 — Data Sheet: This is where you enter your employee records. Simply add data in the same format — columns for employee name, department, location, job title, salary, training hours, performance score, and attendance score — and the entire dashboard updates automatically.
 Data Sheet Tab
📊 Workforce Analytics Dashboard vs. Microsoft Excel Dashboard vs. BambooHR — Where This Fits
| Feature | Workforce Analytics Dashboard (Google Sheets) | Excel HR Dashboard | BambooHR |
|---|---|---|---|
| Cost | $9.99 one-time | $17.99 one-time | $6-12 / employee / month |
| Platform | Google Sheets (browser-based) | Microsoft Excel (desktop) | Cloud SaaS |
| Setup Time | Under 10 minutes ✅ | Under 10 minutes | 2-4 weeks onboarding |
| Real-Time Team Collaboration | Yes — built-in ✅ | Limited (OneDrive only) | Yes |
| Mobile Access | Yes — Google Sheets app ✅ | Limited | Yes |
| Customizable Fields | Fully editable ✅ | Fully editable | Limited by plan |
| Share with Link | Yes — one click ✅ | Manual file sharing | Yes (within platform) |
| Year-1 Cost (5 users) | $9.99 total ✅ | $17.99 total | $3,600 – $7,200 |
| Salary Benchmarking | 4-dimension analysis ✅ | Depends on template | Requires add-on |
For HR teams that want workforce insights without paying $500+ per month for SaaS, the Workforce Analytics Dashboard in Google Sheets sits in the sweet spot.
👥 Who This Template Is For — and Who It’s Not For
✅ This template is built for:
- HR managers at companies with 10-500 employees who need a visual workforce overview
- Small business owners who want to track salary, performance, and attendance in one place
- HR consultants who need a ready-made analytics template for multiple clients
- Startup founders who want workforce insights without a BambooHR subscription
❌ This template is NOT for:
- Enterprise HR teams (1,000+ employees) that need SSO, role-based access control, and audit trails
- Organizations requiring automated payroll integration with ADP or Workday
- Teams needing HRIS-level compliance reporting (EEOC, SOC 2)
⚙️ How to Use the Workforce Analytics Dashboard in Google Sheets
- Open the PDF guide included in your download — it contains the direct Google Sheets copy link.
- Click the copy link to create your own editable version in Google Drive.
- Go to the Data Sheet tab and replace the sample employee records with your own data.
- Navigate to the Overview page — all KPI cards and charts update automatically.
- Use the slicers to filter by department, location, job title, or employee.
- Explore the analysis pages (Salary, Training, Performance, Attendance) for deeper breakdowns.
- Share with your team — click Share in Google Sheets to give view or edit access instantly.
💼 Real-World Use Cases
Priya manages HR for a 120-person logistics company in Mumbai. She uses the Workforce Analytics Dashboard to compare salary averages across 5 departments, identify which locations have the lowest attendance scores, and present quarterly training investment reports to her leadership — all from a single Google Sheet that her team can access on any device.
Carlos runs a growing SaaS startup with 45 employees across 3 offices. He needed a quick way to track performance scores by team and spot which departments were falling behind on training hours. The Workforce Analytics Dashboard gave him that visibility in 10 minutes — without signing up for BambooHR or Workday.
Amanda is an independent HR consultant serving 6 small-business clients. She duplicates this dashboard for each client, customizes the department and job title fields, and uses it as a standard analytics deliverable — saving 15+ hours per client on manual report building.
❓ Frequently Asked Questions
What KPIs does the Workforce Analytics Dashboard track?
The Workforce Analytics Dashboard in Google Sheets tracks 3 KPI cards — Total Training Hours, Average Attendance Score, and Head Count — plus detailed breakdowns of salary, training, performance, and attendance across 4 dimensions each (Department, Location, Job Title, Employee).
Can I customize the departments and job titles?
Yes. The Data Sheet tab is fully editable. Add, rename, or remove departments, locations, and job titles as needed. All charts and analysis pages update automatically based on your data entries.
How does this compare to BambooHR for workforce analytics?
BambooHR charges $6-12 per employee per month and requires weeks of onboarding. This dashboard costs $9.99 one-time, sets up in 10 minutes, and covers salary, training, performance, and attendance analytics — without recurring fees or vendor lock-in.
Does it work on mobile devices?
Yes. The Workforce Analytics Dashboard works on any device with the Google Sheets app — phone, tablet, laptop, or Chromebook. Real-time collaboration is built in, so multiple team members can view or edit simultaneously.
How many employees can this dashboard handle?
Google Sheets supports up to 10 million cells. The dashboard comfortably handles 500-2,000 employee records with no performance issues. For larger datasets, consider the Power BI or Excel versions of our HR dashboards.
Do I need to know Google Sheets formulas?
No. All formulas, charts, and conditional formatting are pre-built. Simply replace the sample data in the Data Sheet tab with your own employee information. The dashboard handles everything else automatically.
Can I add more analysis pages?
Yes. The template is fully unlocked and editable. You can duplicate existing analysis pages, add new charts, or create additional breakdowns based on your specific workforce metrics.
👤 About the Author
Built by PK — Microsoft Certified Professional with 15+ years of Excel, Google Sheets, and Power BI experience. Founder of NextGenTemplates, reaching 300K+ subscribers across YouTube channels (@PK-AnExcelExpert, @NextGenTemplates, @NeoTechNavigators). Every template is hand-built and tested before release.
🔗 Explore Related Templates
📊 Attendance Tracker in Google Sheets — Detailed daily attendance tracking with annual summaries and KPI dashboard.
📋 Employee Shift Schedule in Google Sheets — Weekly and monthly shift planning with employee directory and KPI cards.
💎 Save 47% — Get all 10 HR templates in the HR & Workforce Analytics Bundle for just $89.99!
📖 Click here to read the Detailed Blog Post
🎥 Visit our YouTube channel for step-by-step video tutorials
👉 YouTube.com/@NextGenTemplates


Reviews
There are no reviews yet.