


The Toy and Games Industry Dashboard is driven by creativity, trends, and strong seasonal demand. New products launch frequently, customer preferences change rapidly, and sales peak during holidays, festivals, and school seasons. However, without clear data visibility, even the most innovative toy and games businesses struggle to scale profitably. When data lives in static reports or disconnected files, decisions become slow and reactive.
That is exactly where the Toy and Games Industry Dashboard in Power BI becomes a true game-changer 🧸🎮📊.
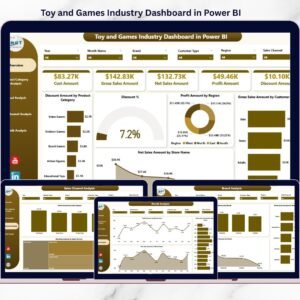
This ready-to-use Power BI dashboard transforms raw toy and games sales data into interactive KPIs, dynamic visuals, and actionable insights. Instead of manually compiling reports, decision-makers gain real-time visibility into sales, profit, discounts, brands, product categories, channels, regions, and monthly trends—all in one professional Power BI file.
By combining Excel or structured data sources with Power BI’s powerful visualization engine, this dashboard helps toy manufacturers, distributors, and retailers move from guesswork to data-driven growth.
## Key Features of Toy and Games Industry Dashboard in Power BI 🚀
This dashboard is designed to simplify complex industry analytics.
📊 Centralized Business Performance View
Track sales, profit, discounts, and trends across the entire toy and games business.
🎛️ Interactive Power BI Slicers
Filter insights instantly by product category, brand, sales channel, region, customer type, store, or month.
📈 Executive KPI Cards
Get instant snapshots of critical performance metrics without digging into raw data.
📉 Discount & Margin Analysis
Monitor discount amounts and percentages to protect profitability.
🏷️ Brand & Category Performance Insights
Identify top-performing toy brands and high-margin product categories.
🌍 Region & Channel Analysis
Understand which regions and sales channels contribute the most value.
📅 Seasonal & Monthly Trend Tracking
Analyze demand spikes during holidays and plan inventory proactively.
⚡ Scalable Power BI Solution
Handles large datasets efficiently and refreshes visuals instantly.
## What’s Inside the Toy and Games Industry Dashboard in Power BI 📂
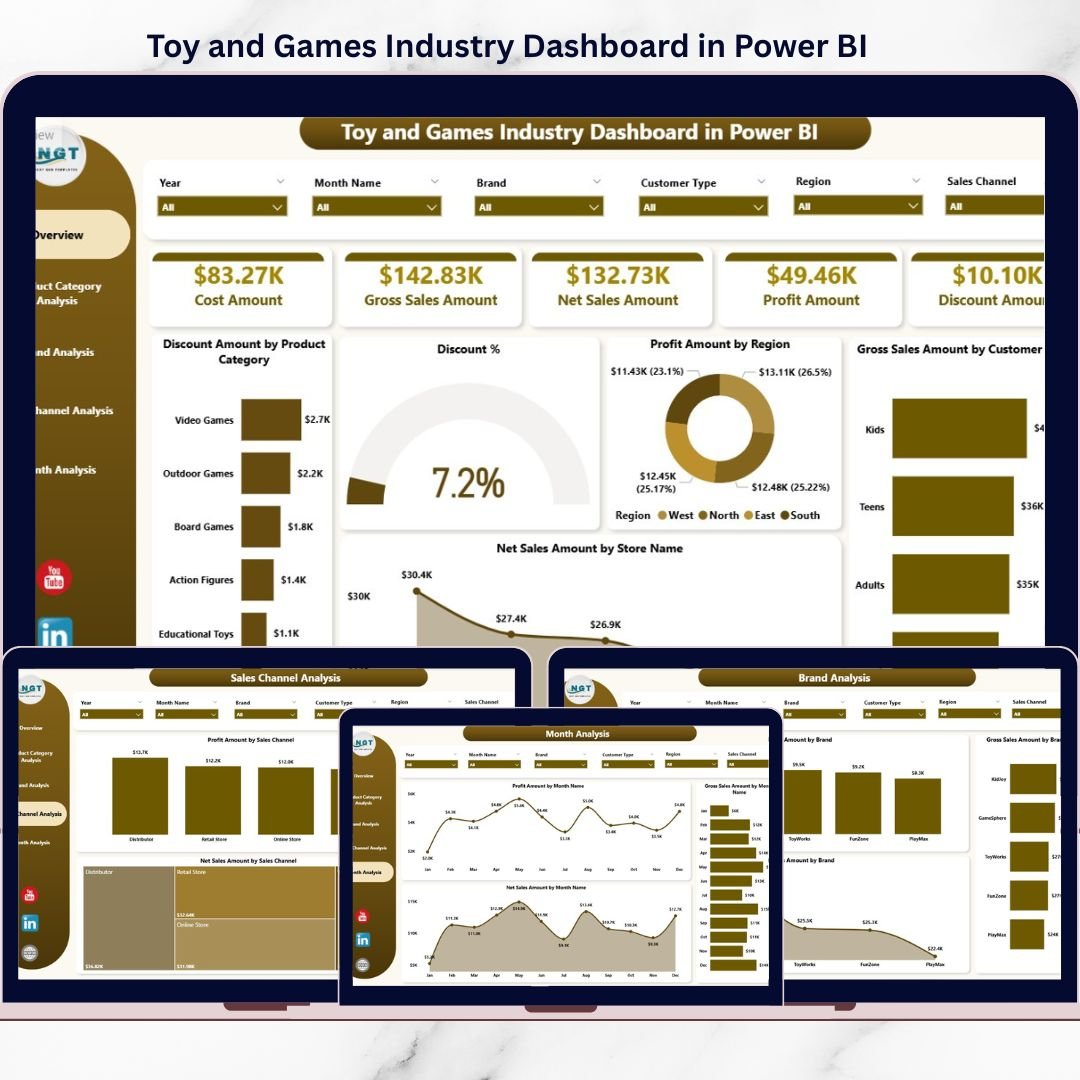
This dashboard includes five powerful Power BI pages, each answering a specific business question.
🟦 Overview Page
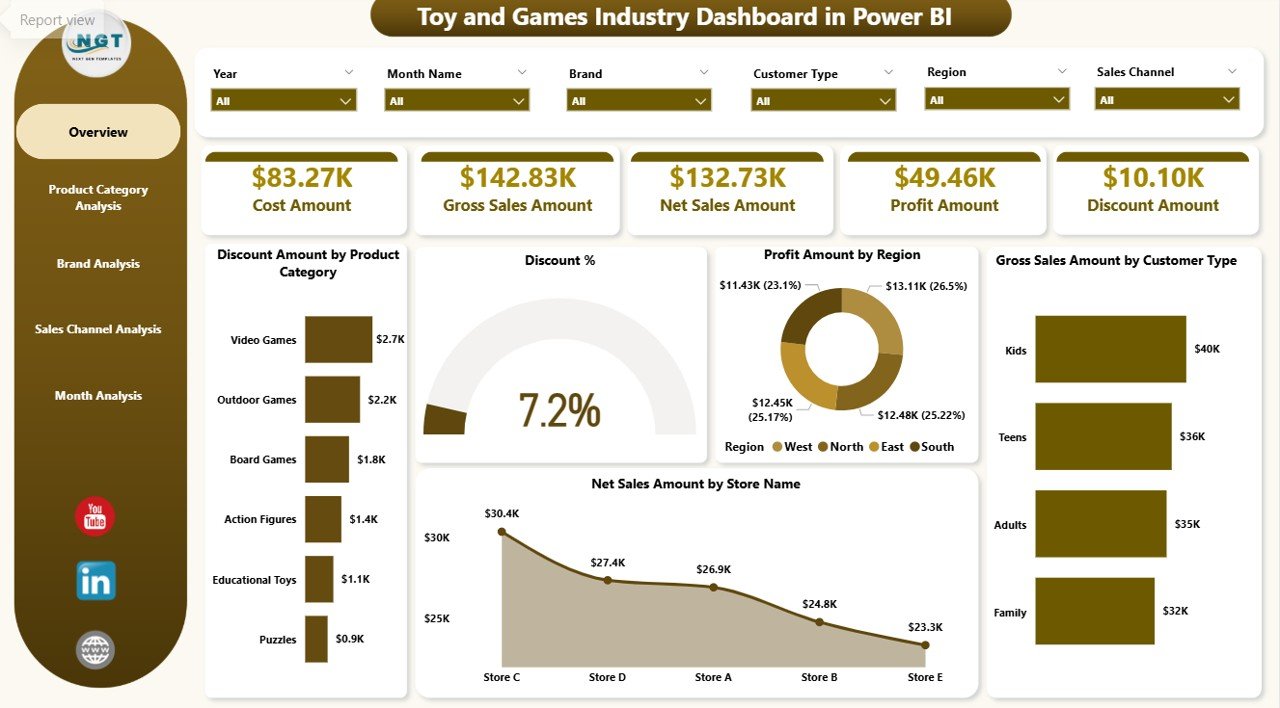
Acts as the control center with KPIs and visuals such as Discount Amount by Product Category, Discount %, Profit by Region, Gross Sales by Customer Type, and Net Sales by Store Name.
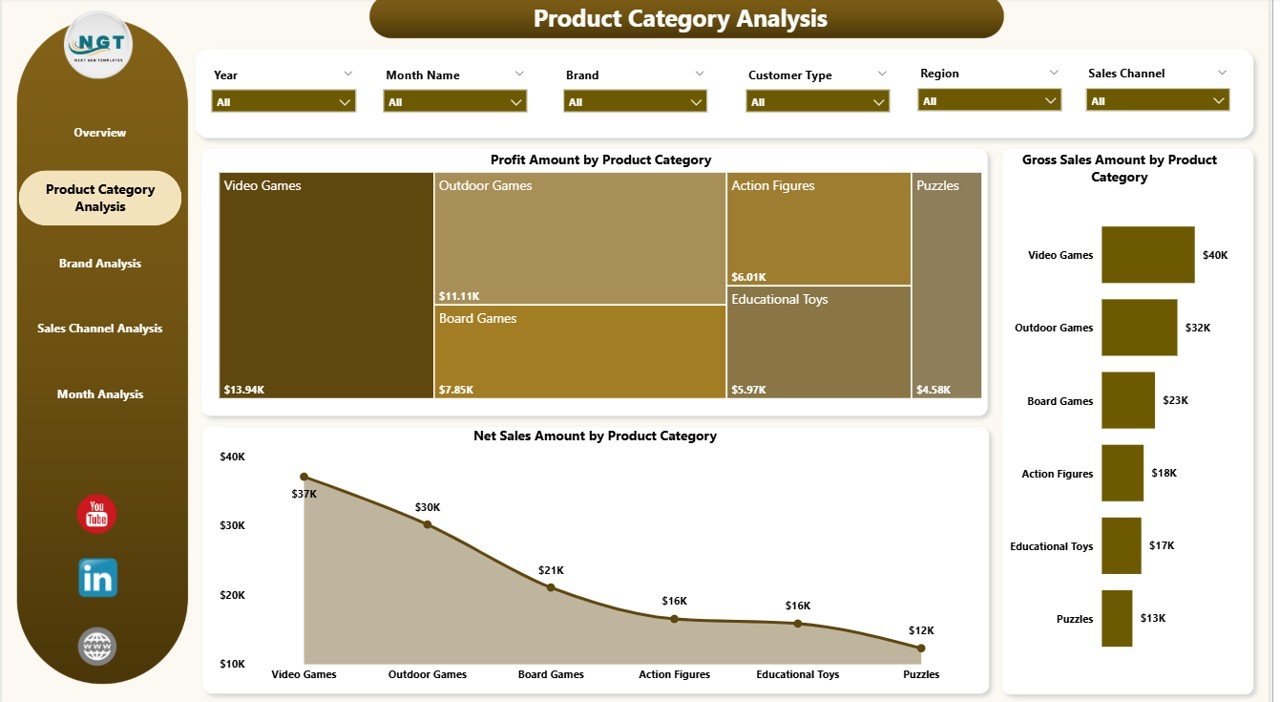
🟦 Product Category Analysis Page
Compares profit, gross sales, and net sales across toy and game categories like educational toys, board games, puzzles, and electronic games.
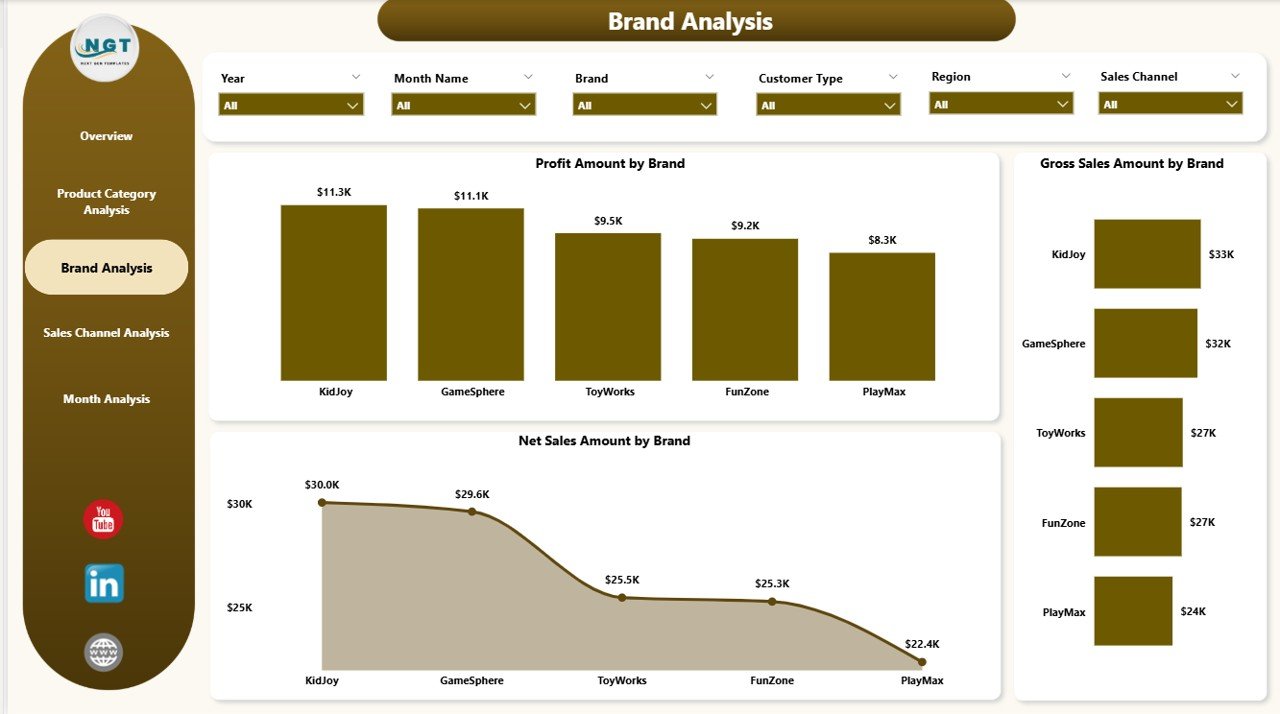
🟦 Brand Analysis Page
Provides brand-level insights for gross sales, net sales, and profit to support brand investment decisions.
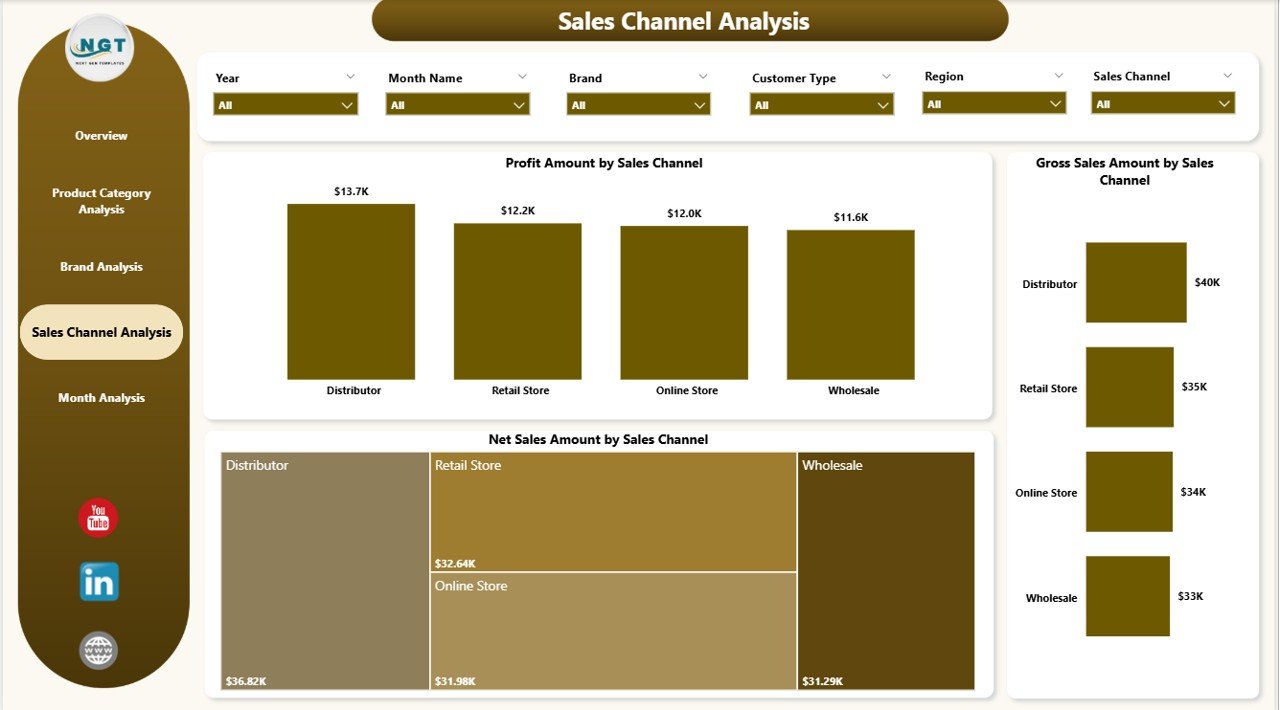
🟦 Sales Channel Analysis Page
Evaluates performance across online marketplaces, retail stores, distributors, and direct-to-consumer channels.
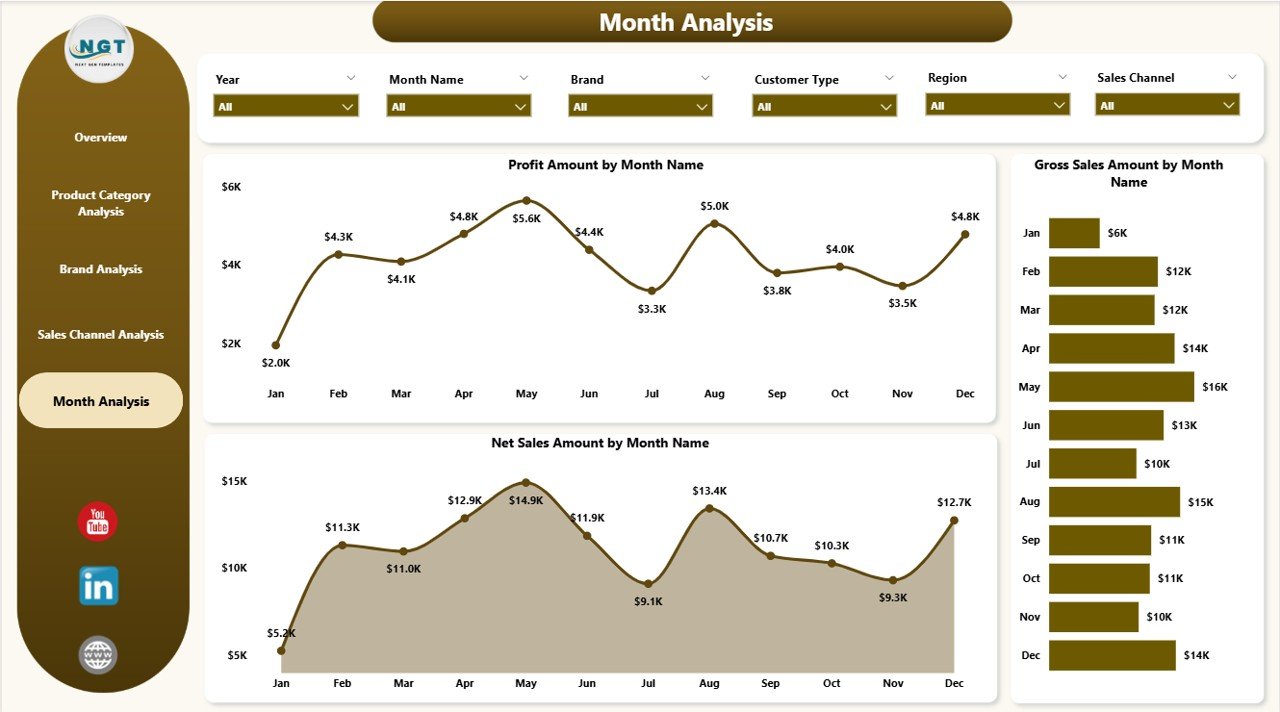
🟦 Month Analysis Page
Tracks monthly trends for gross sales, net sales, and profit to highlight seasonality and campaign impact.
Together, these pages create a complete analytics framework for the toy and games industry.
## How to Use the Toy and Games Industry Dashboard in Power BI 🧩
Using the dashboard is simple and efficient:
1️⃣ Connect or load your toy and games sales data
2️⃣ Refresh the Power BI report
3️⃣ Use slicers to filter by brand, category, channel, region, or month
4️⃣ Review KPIs, charts, and trends instantly
5️⃣ Use insights to optimize pricing, discounts, inventory, and promotions
Power BI automatically handles calculations and visuals—so teams focus on strategy, not reporting.
## Who Can Benefit from This Toy and Games Industry Dashboard in Power BI 👥
This dashboard is ideal for:
✔️ Toy Manufacturers
✔️ Game Publishers
✔️ Retail & E-commerce Businesses
✔️ Distributors & Wholesalers
✔️ Sales & Finance Teams
✔️ Business Owners & Analysts
Both technical and non-technical users can use this dashboard confidently.
### Click here to read the Detailed blog post
Visit our YouTube channel to learn step-by-step video tutorials
👉 YouTube.com/@PKAnExcelExpert
Watch the step-by-step video tutorial:
Compatibility and Requirements
- Works in Power BI Desktop, which is free to download from Microsoft. Microsoft explains the install in Get Power BI Desktop.
- You load your own toy and games sales data (Excel or another structured source) and refresh the report.
Frequently Asked Questions
How many pages does the dashboard have?
Five pages: Overview, Product Category Analysis, Brand Analysis, Sales Channel Analysis and Month Analysis.
What can I filter by?
Slicers filter the report by product category, brand, sales channel, region, customer type, store and month.
Can I track discounts and profit?
Yes. The Overview page shows Discount Amount by Product Category, Discount % and Profit by Region. Other pages compare gross sales, net sales and profit by category, brand, channel and month.
Can I see seasonal demand?
Yes. The Month Analysis page tracks monthly gross sales, net sales and profit, so holiday and campaign peaks are easy to spot.
Is there an Excel or Google Sheets version?
Yes. See the Toy and Games Industry Dashboard in Excel and the Toy & Games Industry Dashboard in Google Sheets.
Related Toy and Games Templates
- Toy and Games Industry Dashboard in Excel: the same dashboard for Excel
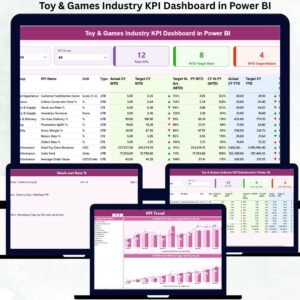
- Toy & Games Industry KPI Dashboard in Power BI: a KPI-focused Power BI view
- Toy & Games Industry Dashboard in Google Sheets: a browser-based version
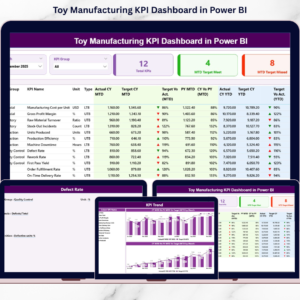
- Toy Manufacturing KPI Dashboard in Power BI: production metrics for toy makers
- Power BI Dashboard Mega Collection: 15 Power BI templates in one download
Browse all Power BI dashboards.






















Reviews
There are no reviews yet.