Influencer marketing is no longer optional. Brands compete for attention on Instagram, YouTube, TikTok, and other platforms every single day. However, many marketing teams still track campaigns in scattered Excel sheets. As a result, they struggle to understand engagement, ROI, budget allocation, and overall performance clearly.
That is exactly why the Influencer Marketing Dashboard in Power BI becomes a game-changing solution 🚀📊.
This ready-to-use Power BI dashboard transforms raw influencer campaign data into powerful, interactive insights. It helps marketing managers monitor engagement rate, revenue performance, campaign budgets, cost per conversion, and platform effectiveness—all in one centralized system. Instead of manual reporting, you gain real-time visibility and strategic control.
🔑 Key Features of Influencer Marketing Dashboard in Power BI
📊 Centralized Campaign Monitoring
Track all influencer campaigns across platforms in one interactive dashboard.
📈 Engagement & Revenue Tracking
Monitor engagement rate %, revenue by platform, and overall performance instantly.
💰 Cost Per Conversion & Budget Analysis
Identify overspending and optimize campaign efficiency easily.
🎯 Multi-Dimensional Filtering
Analyze performance by campaign name, category, region, and month using slicers.
📅 Time-Based Trend Analysis
Track monthly growth, seasonal spikes, and campaign timing impact.
🔄 Real-Time Data Refresh
Update Excel or data source and refresh Power BI for instant insights.
📦 What’s Inside the Influencer Marketing Dashboard in Power BI
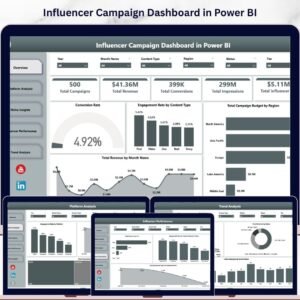
This dashboard includes 5 powerful analytical pages, each designed for focused performance analysis.
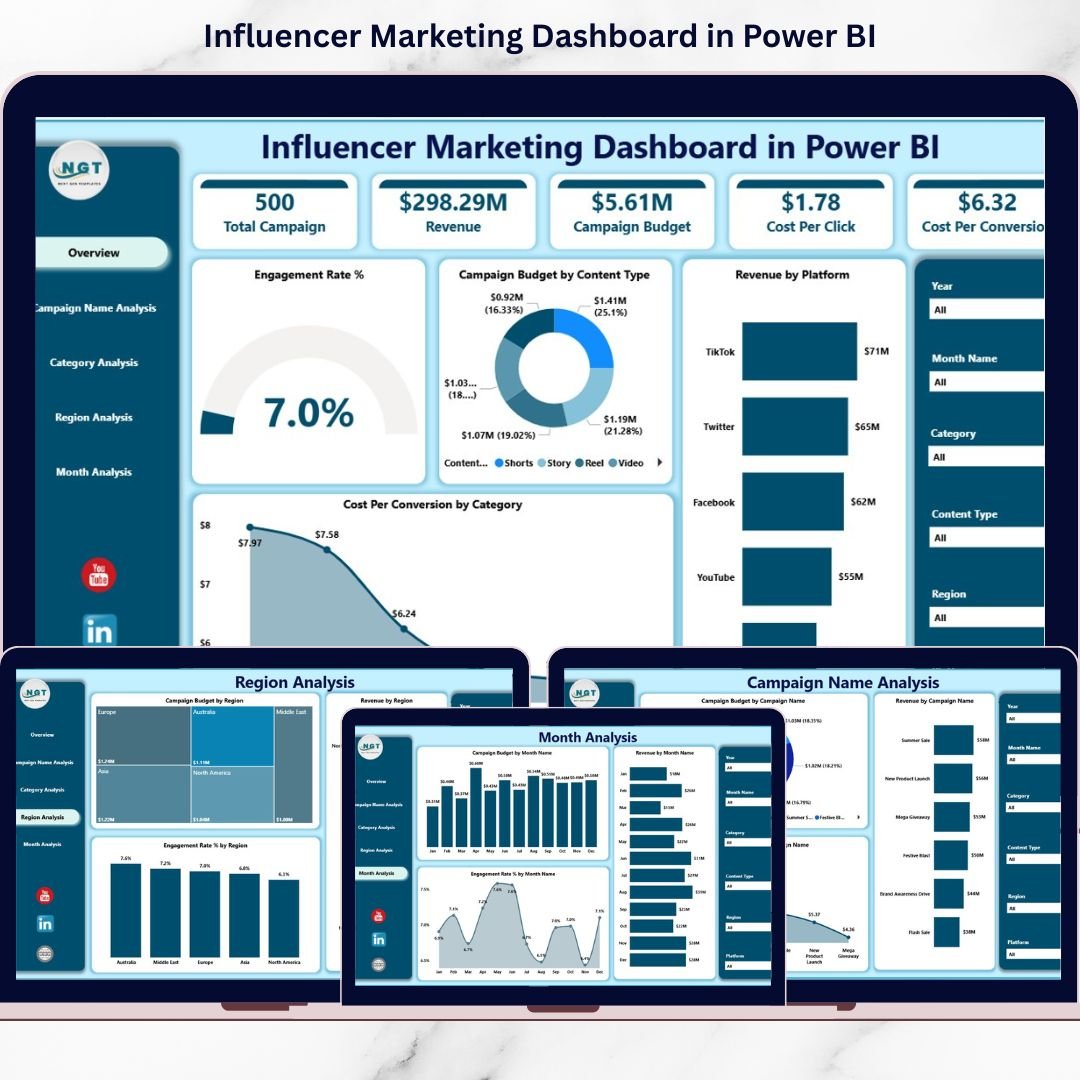
📌 Overview Page – Complete Campaign Snapshot
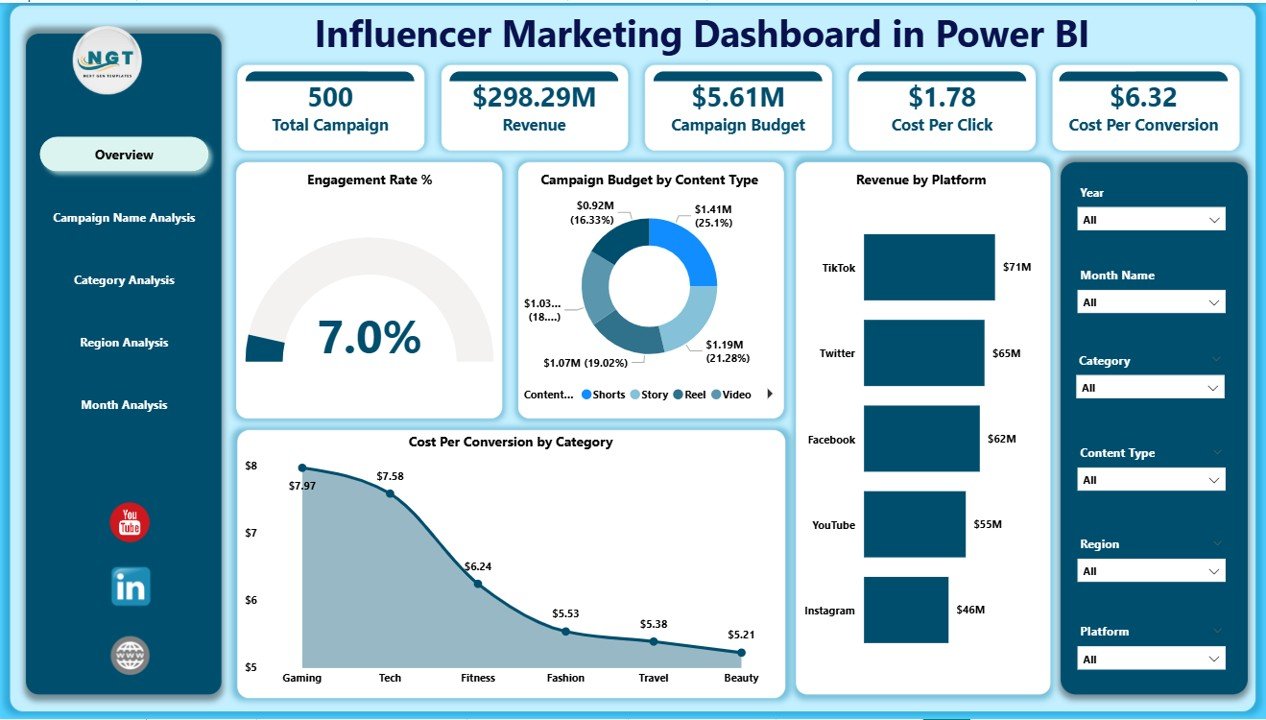
The main command center featuring:
• Engagement Rate % KPI
• Campaign Budget by Content Type
• Revenue by Platform
• Cost Per Conversion by Category
• Interactive slicers for campaign, category, region, and month
This page instantly shows campaign health and platform performance.
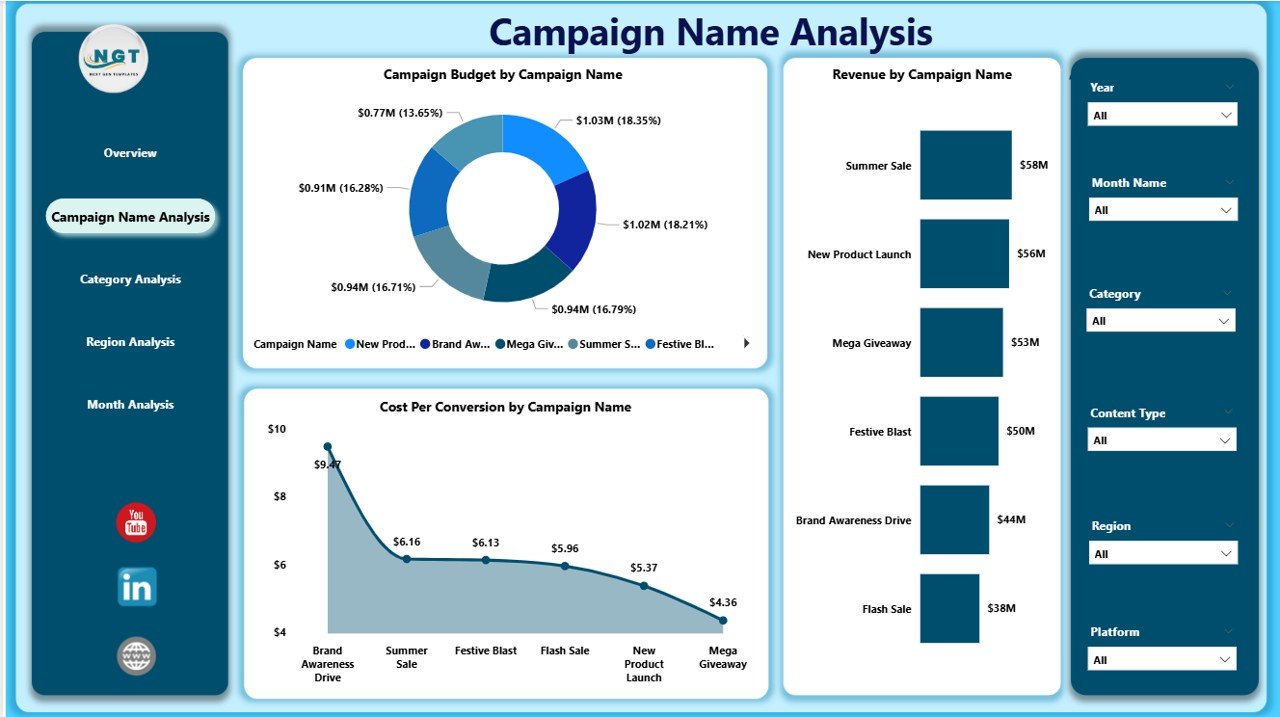
📢 Campaign Name Analysis Page
Dive deep into individual campaign performance.
• Campaign Budget by Campaign Name
• Revenue by Campaign Name
• Cost Per Conversion by Campaign Name
Quickly identify high-budget, high-revenue, or low-ROI campaigns.
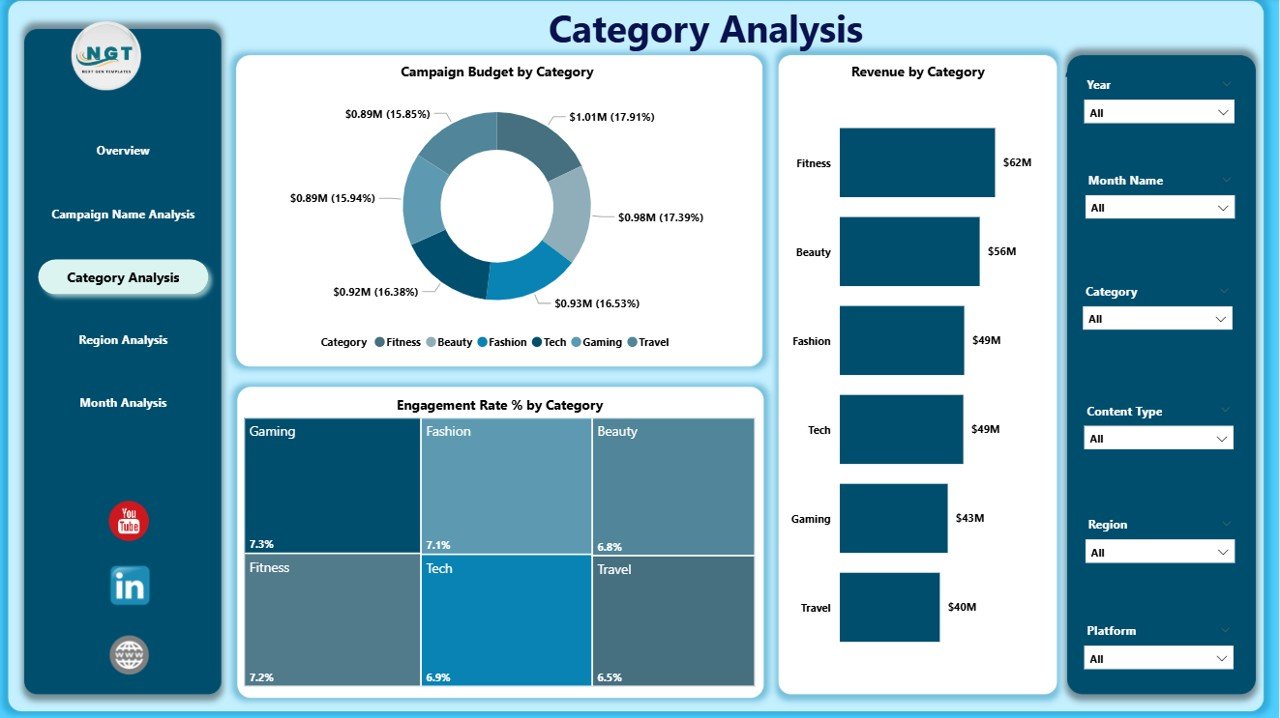
🎯 Category Analysis Page
Compare influencer niches such as Fashion, Tech, Travel, Beauty, Fitness, and Gaming.
• Campaign Budget by Category
• Revenue by Category
• Engagement Rate % by Category
Refine targeting strategy based on category-level performance.
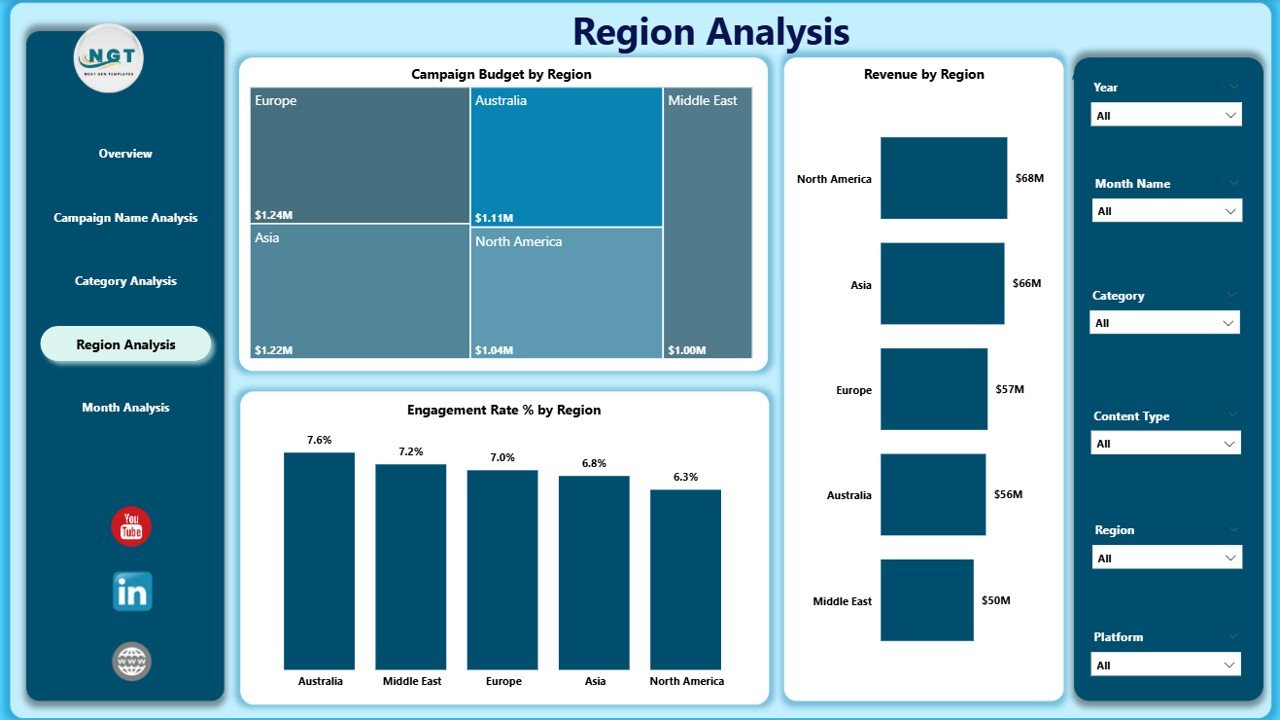
🌍 Region Analysis Page
Evaluate geographic performance.
• Campaign Budget by Region
• Revenue by Region
• Engagement Rate % by Region
Focus more on high-performing regions and optimize weaker markets.
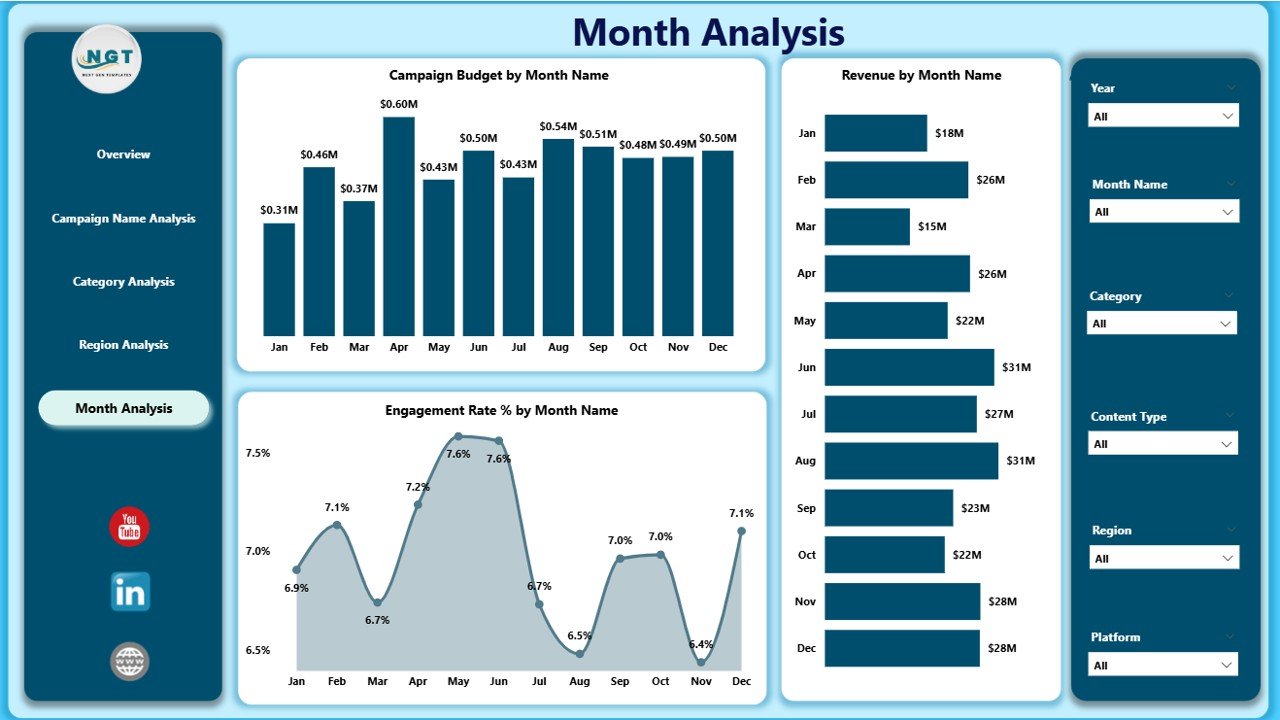
📅 Month Analysis Page
Track performance trends over time.
• Campaign Budget by Month
• Revenue by Month
• Engagement Rate % by Month
Identify seasonal spikes and forecast future campaign success.
🛠️ How to Use the Influencer Marketing Dashboard in Power BI
1️⃣ Import influencer campaign data into Excel or your data source
2️⃣ Connect data to Power BI
3️⃣ Refresh the dashboard
4️⃣ Use slicers to filter by campaign, region, or category
5️⃣ Review KPI cards and visuals
6️⃣ Identify high-performing influencers
7️⃣ Reallocate budget strategically
Within minutes, you convert campaign data into actionable marketing intelligence.
👥 Who Can Benefit from This Influencer Marketing Dashboard in Power BI
📈 Digital Marketing Agencies
🛍️ E-commerce Brands
📊 Brand Managers
📱 Social Media Marketing Teams
🚀 Startups & Growth Marketers
🏢 Corporate Marketing Departments
If you manage influencer campaigns, this dashboard improves clarity and accountability.