


In today’s fast-paced and quality-driven world, laboratories face constant pressure to maintain accuracy, compliance, and efficiency. Whether in pharmaceuticals, construction, food & beverages, or environmental testing — every certificate, approval, or rejection matters. That’s why we’ve designed the Test Lab Certifications Dashboard in Excel — your all-in-one tool to monitor, analyze, and improve testing performance seamlessly.
Built entirely in Microsoft Excel, this interactive dashboard helps lab managers, quality assurance professionals, and compliance officers visualize key performance indicators with clarity. From tracking approval rates to analyzing satisfaction scores — it transforms raw data into powerful insights that drive better decisions.
⚙️ Key Features of the Test Lab Certifications Dashboard in Excel
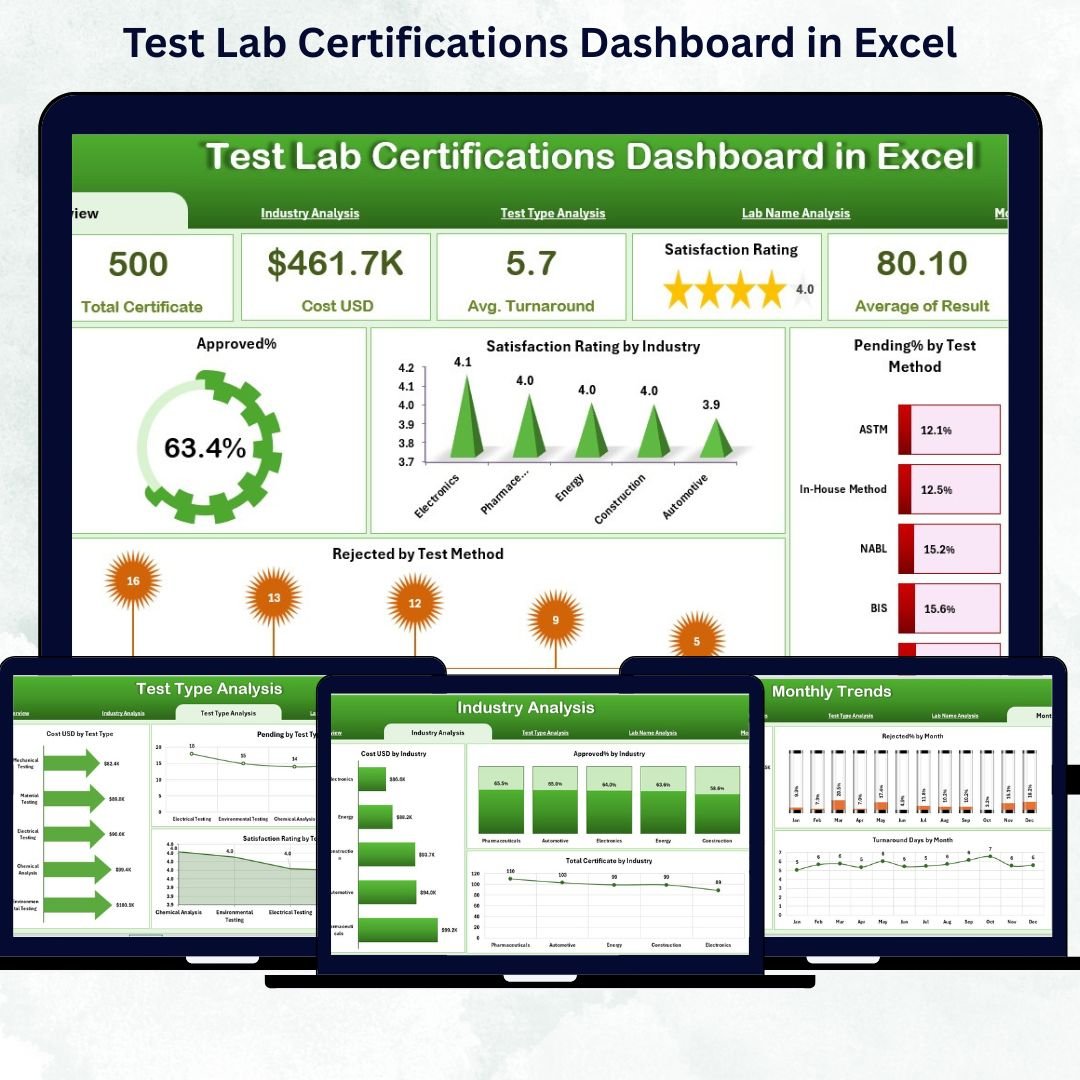
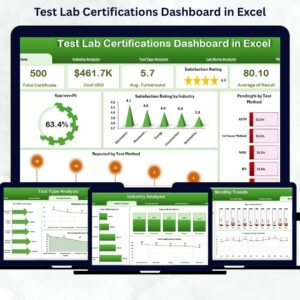
✅ Comprehensive Overview Page – Get an instant summary of lab performance with interactive cards displaying total certificates, approval rate, pending %, rejection %, and average satisfaction rating.
📊 Dynamic Charts – View 4 key visuals including Approved %, Satisfaction by Industry, Pending % by Test Method, and Rejected by Test Method — all updating automatically when filters change.
🧭 Smart Navigation – Use the left-side Page Navigator to switch between analytical pages instantly without scrolling through complex sheets.
📈 Real-Time Insights – Automatically updates KPIs and visuals when data changes — no manual refresh needed.
💡 Built-In Filters – Use slicers for Industry, Lab Name, Test Type, and Month to focus on what truly matters.
📅 Monthly & Industry Trends – Analyze how approval and rejection rates shift across industries or over time.
🔒 No Coding Required – Everything is powered by Excel formulas and pivot tables — simple yet powerful.
📂 What’s Inside the Test Lab Certifications Dashboard in Excel
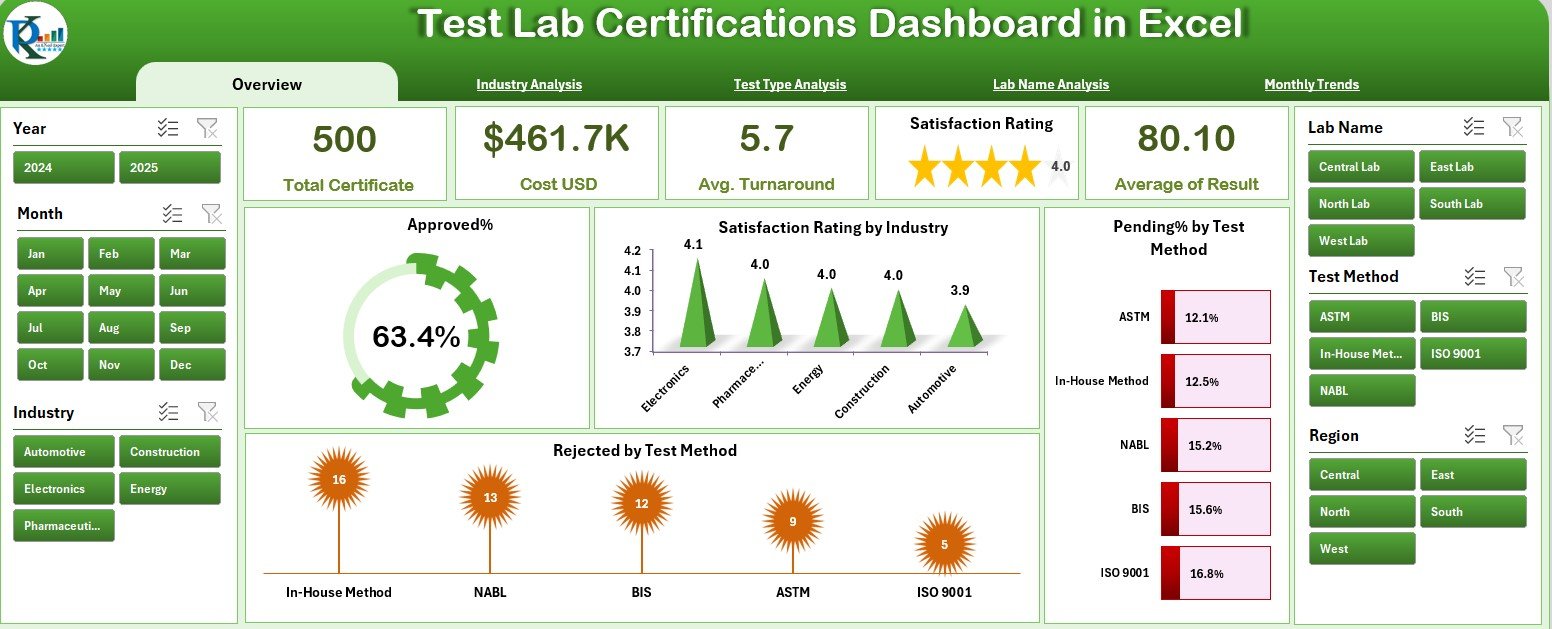
🗂️ 1. Overview Page: Displays key cards and visuals for quick insights on performance and satisfaction.
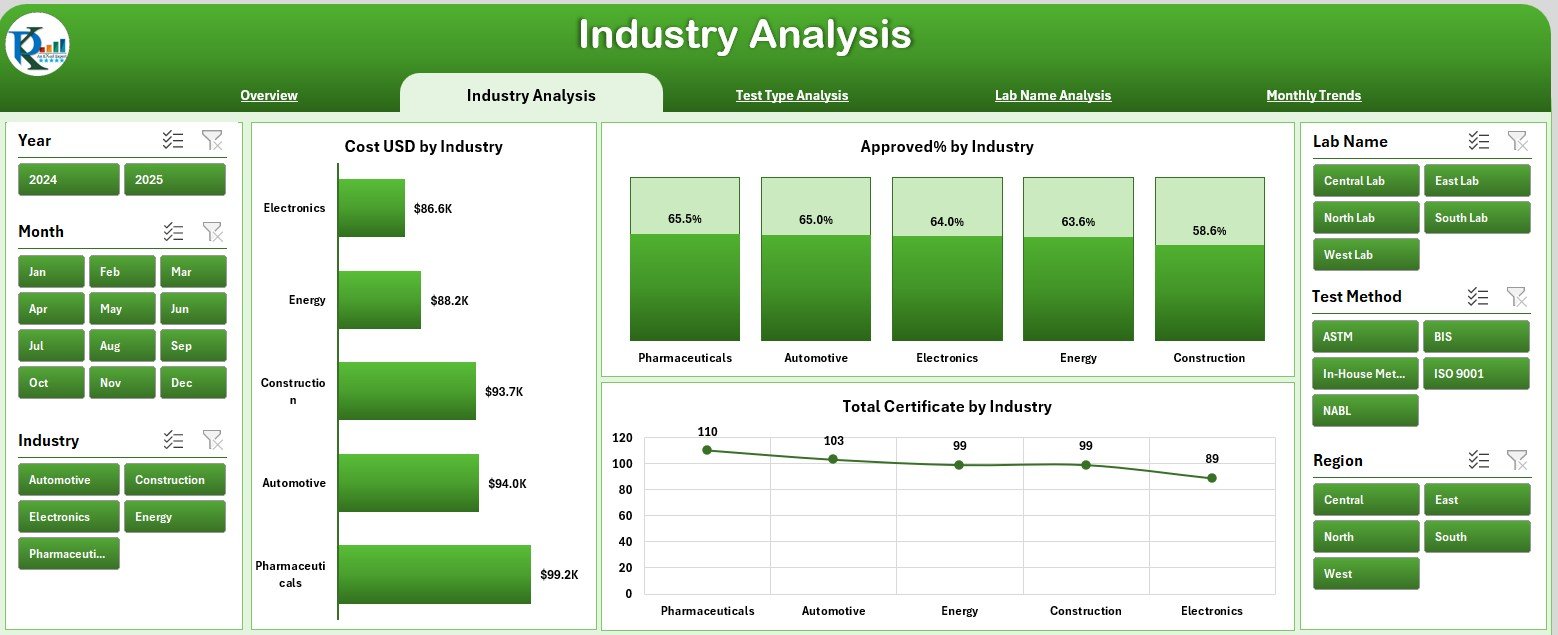
🏭 2. Industry Analysis: Understand which industries contribute most to testing costs, approvals, and certificate volume.
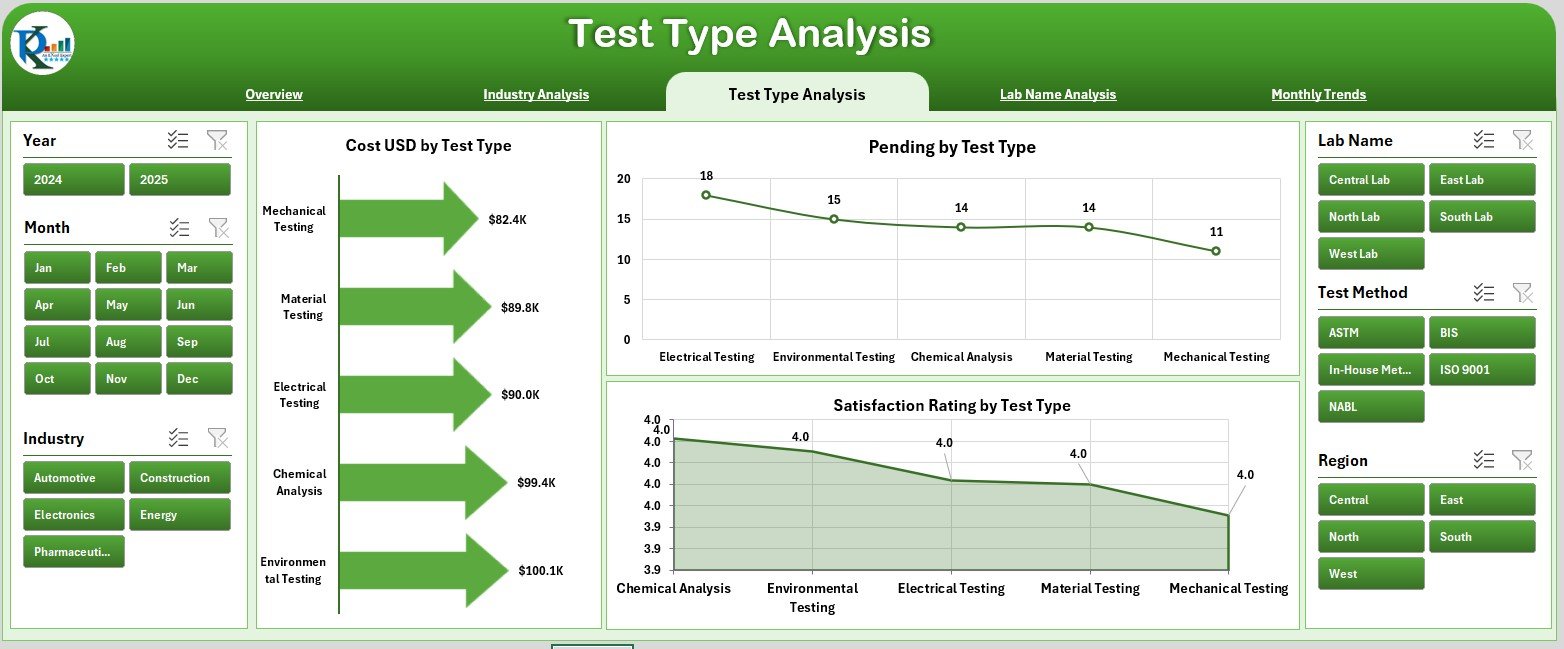
🧪 3. Test Type Analysis: Analyze testing categories by cost, pending %, and client satisfaction.
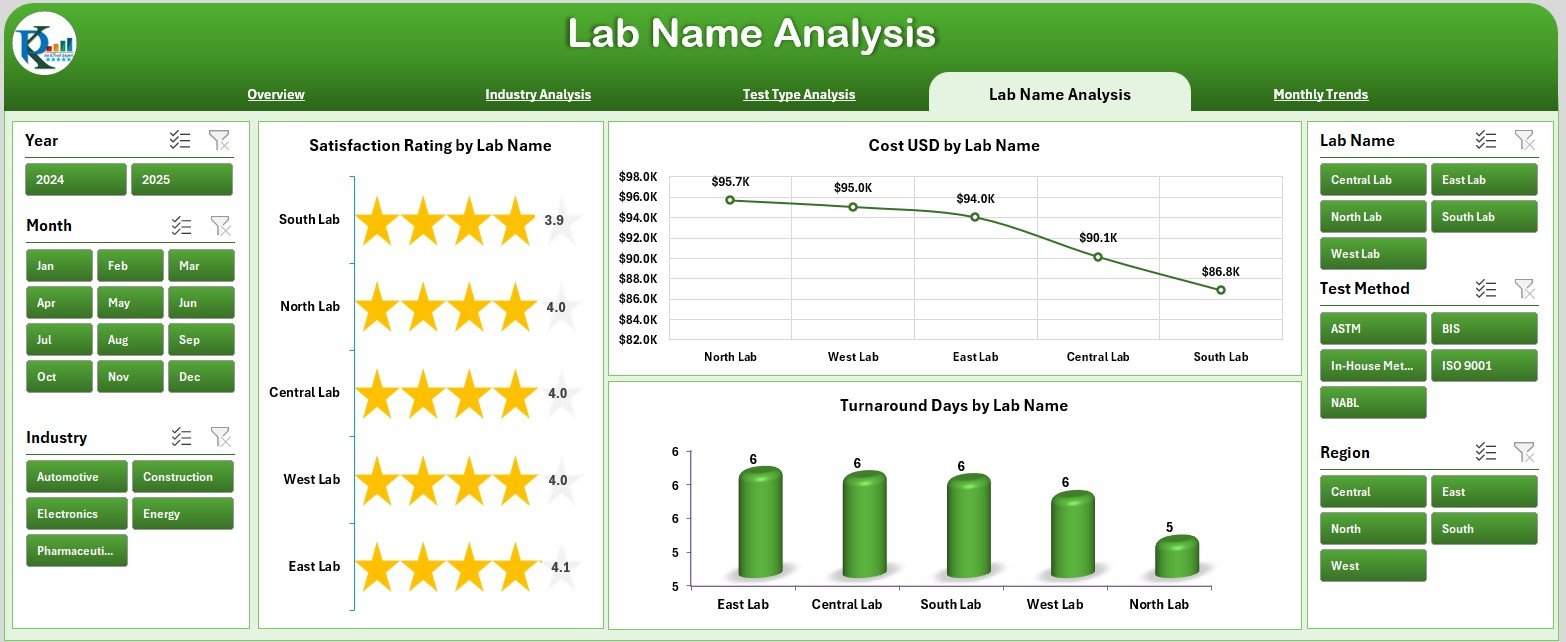
🏢 4. Lab Name Analysis: Compare labs based on satisfaction, cost, and turnaround days to identify performance gaps.
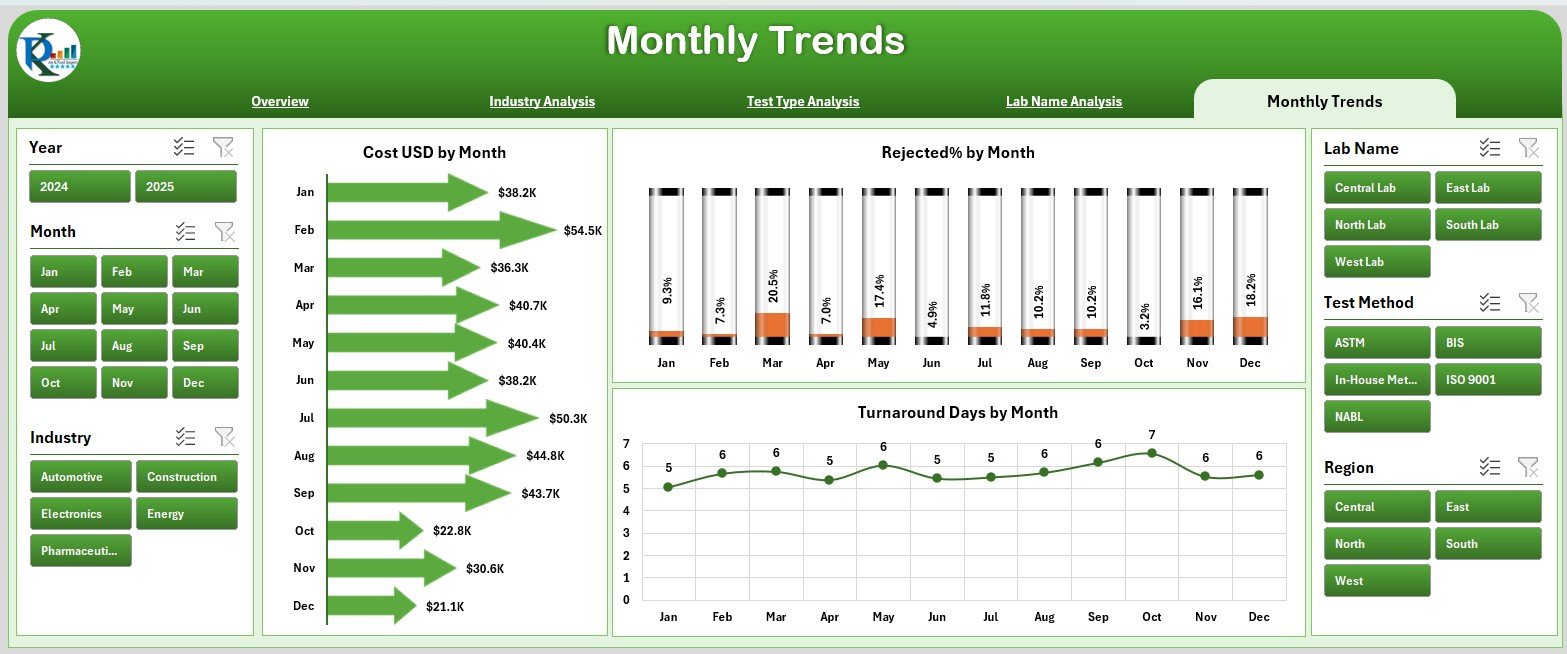
📆 5. Monthly Trends Page: Review monthly fluctuations in cost, rejection %, and turnaround times for forecasting.
📋 6. Data Sheet: Store raw certification data — including lab name, test type, industry, and satisfaction scores.
🧾 7. Support Sheet: Manage dropdown lists and KPIs for consistent data entry and clean visuals.
This structured design ensures your workflow remains smooth, reliable, and fully automated within Excel.
🧭 How to Use the Test Lab Certifications Dashboard in Excel
1️⃣ Input Data: Enter or paste your lab certification data into the Data Sheet.
2️⃣ Refresh Pivot Tables: Use Excel’s refresh feature to update visuals instantly.
3️⃣ Filter Data: Use slicers to view performance by month, lab, or industry.
4️⃣ Analyze Performance: Check interactive cards and trend charts to monitor KPIs.
5️⃣ Share Reports: Export visuals as images or PDFs for management reporting or client updates.
💡 No macros, no add-ins, no hassle — just clean Excel analytics ready to impress your stakeholders.
👩🔬 Who Can Benefit from This Dashboard
🏭 Quality Managers: Maintain quality standards by tracking approval %, rejections, and turnaround time.
🧫 Lab Supervisors: Identify bottlenecks across test types and manage workloads efficiently.
📊 Business Leaders: Gain financial visibility with cost analysis by industry and test type.
🔍 Compliance Officers: Prepare audit-ready visual reports with traceable certification data.
💼 Consultants & Analysts: Use this dashboard for client reporting, KPI benchmarking, and presentations.
No matter your role, this tool empowers you with instant data insights to make confident, evidence-based decisions.
🔗 Click here to read the Detailed blog post
📺 Visit our YouTube channel to learn step-by-step video tutorials
Watch the step-by-step video tutorial:
Compatibility and Requirements
- Works in Microsoft Excel desktop (Excel 2016 or later, or Microsoft 365).
- The dashboard uses slicers for Industry, Lab Name, Test Type and Month. Microsoft explains them in Use slicers to filter data.
Frequently Asked Questions
Which pages does the dashboard include?
It has an Overview page, Industry Analysis, Test Type Analysis, Lab Name Analysis and Monthly Trends. A Data Sheet holds your raw certification records and a Support Sheet holds the dropdown lists and KPIs.
Which KPIs does the Overview page show?
It shows cards for total certificates, approval rate, pending %, rejection % and average satisfaction rating. Four charts sit next to them: Approved %, Satisfaction by Industry, Pending % by Test Method and Rejected by Test Method.
How do I filter the data?
Use the slicers for Industry, Lab Name, Test Type and Month. The cards and charts update to match your selection.
Does it need macros or add-ins?
No. It runs on Excel formulas and pivot tables, with no coding required.
Is there a Power BI version?
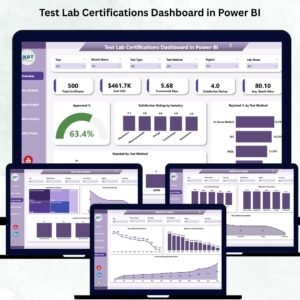
Yes. See the Test Lab Certifications Dashboard in Power BI.
Related Laboratory Templates
- Test Lab Certifications Dashboard in Power BI: the same topic as a Power BI report
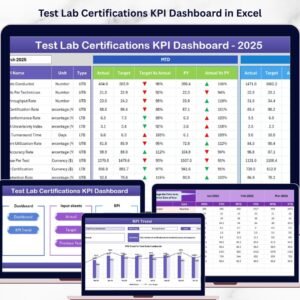
- Test Lab Certifications KPI Dashboard in Excel: a KPI-focused Excel view of lab certifications
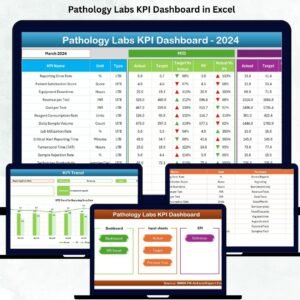
- Pathology Labs KPI Dashboard in Excel: lab performance tracking for pathology labs
- Laboratory Instruments KPI Dashboard in Excel: KPIs for lab instruments
- Training Completion Certification Tracker in Excel: track staff certifications
Browse all Excel dashboards.








Reviews
There are no reviews yet.