

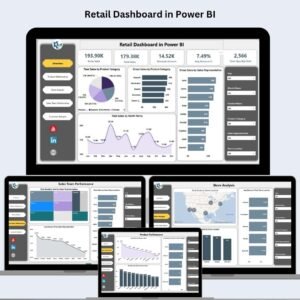
Whether you’re managing a chain of retail stores or a single outlet, gaining real-time insight into sales, product performance, and customer behavior is the key to driving profitability. The Retail Dashboard in Power BI is a ready-to-use business intelligence solution that gives you a 360-degree view of your retail operations.
This interactive dashboard brings together your sales, inventory, team performance, and customer data in one visually dynamic interface, empowering you to make faster, data-driven decisions.
🔍 Key Features of the Retail Dashboard in Power BI
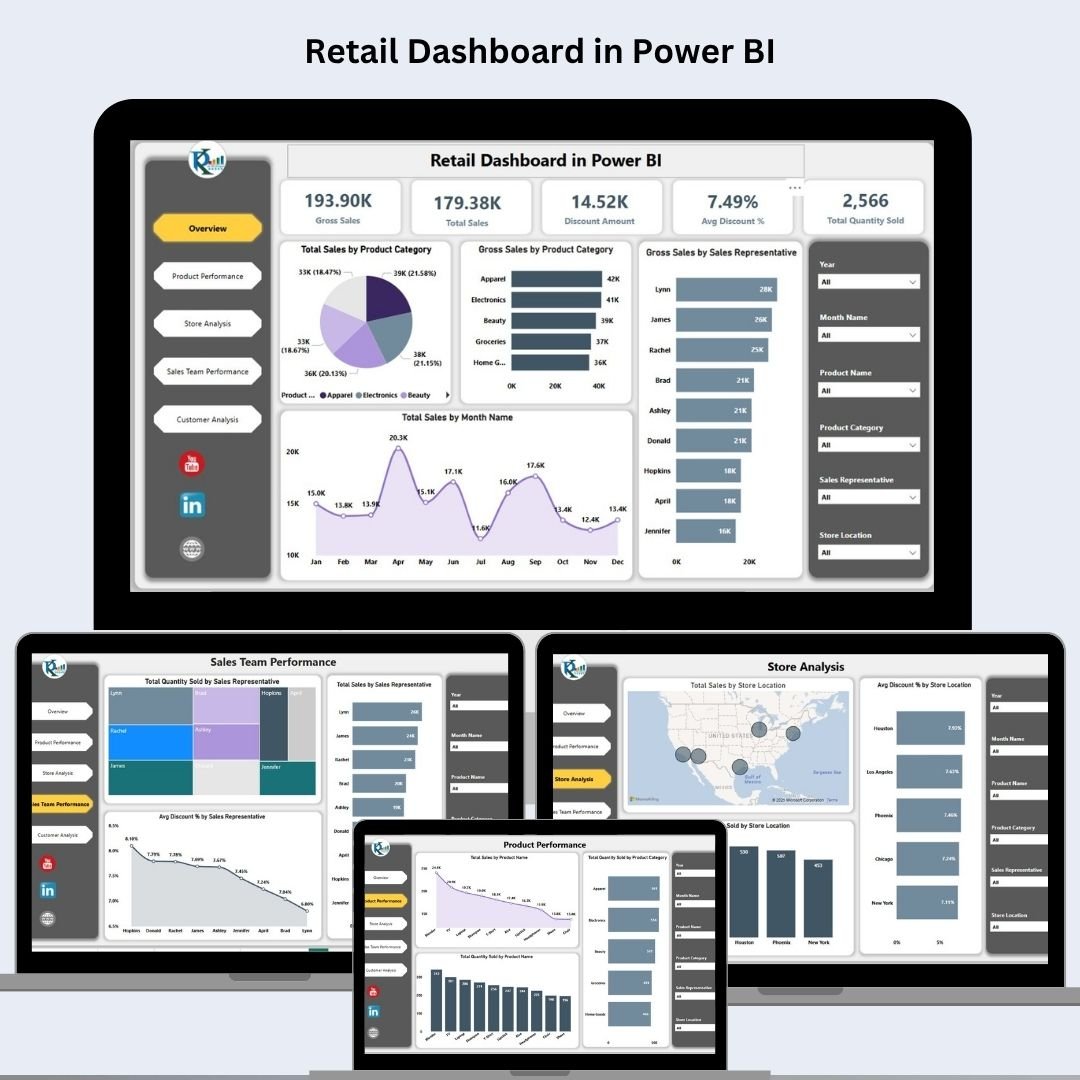
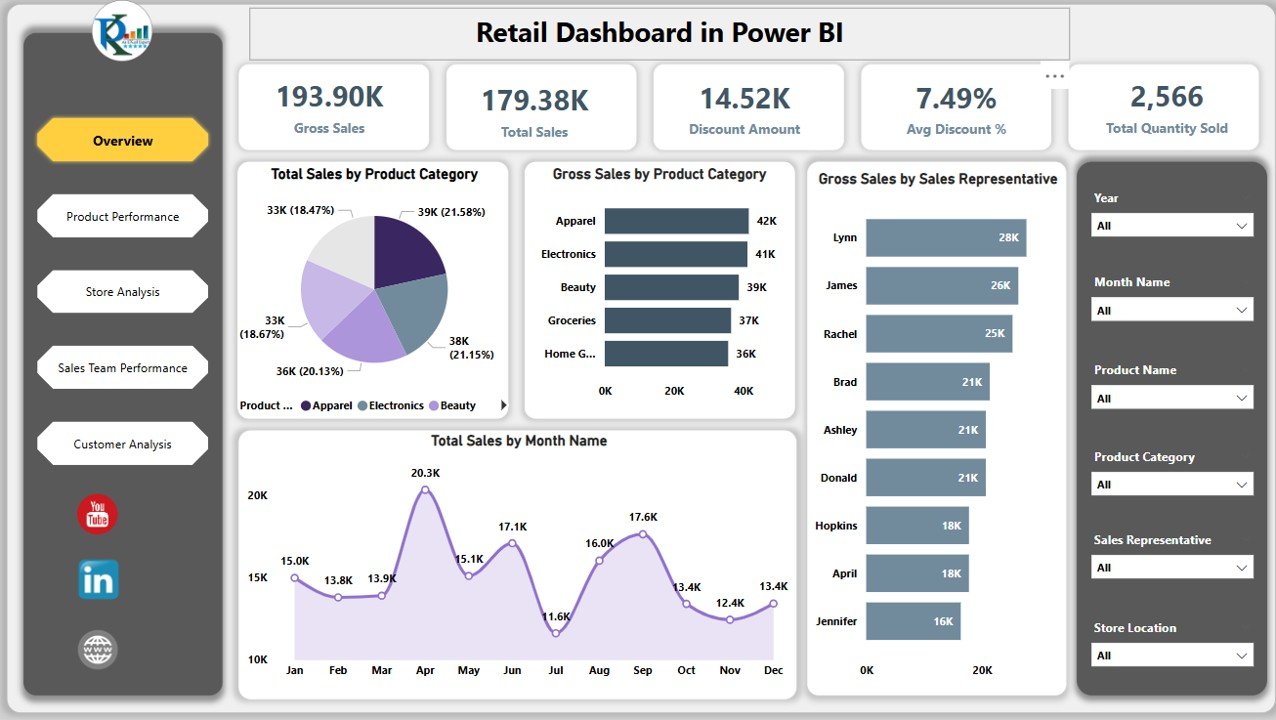
🧭 1. Overview Page
Get an instant summary of your retail KPIs:
📌 Cards:
Gross Sale
Total Sale
Discount Amount
Avg. Discount %
Total Quantity Sold
📈 Charts:
Sales by Product Category
Gross Sales by Sales Representative
Sales Trends by Month
🎯 Ideal for executives seeking a high-level snapshot of business health.
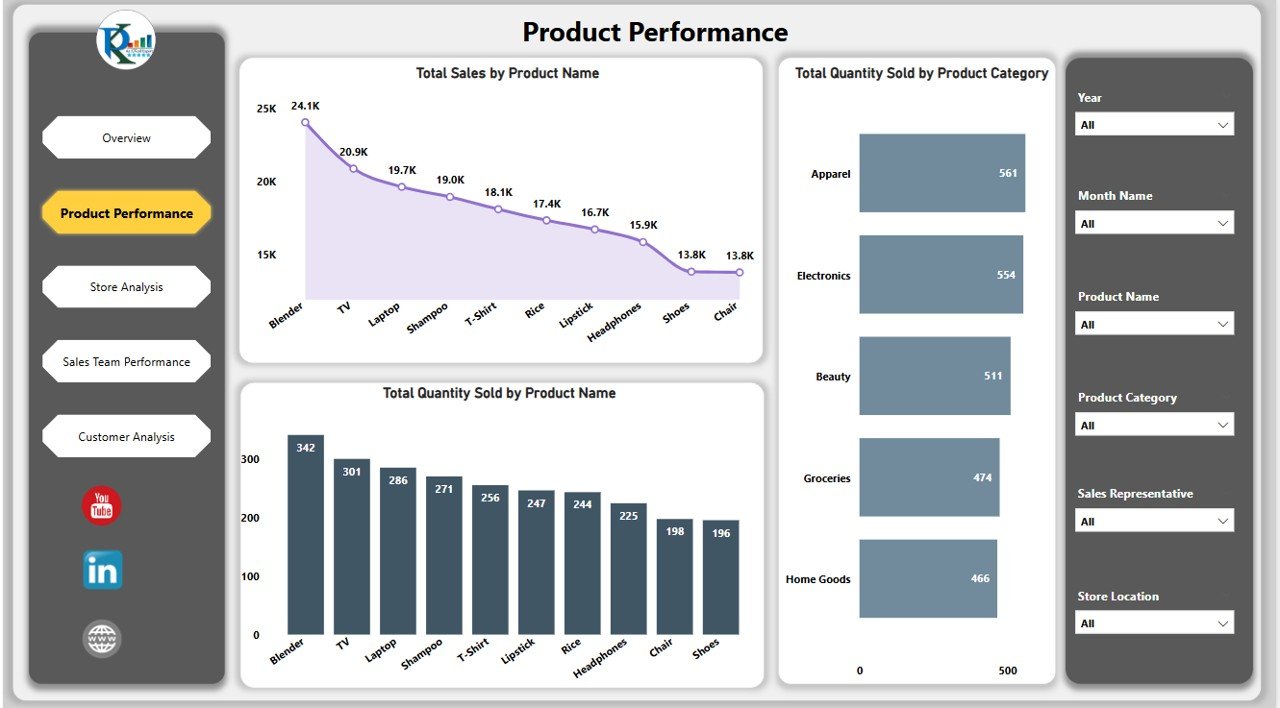
📦 2. Product Performance Page
Dive deep into individual product metrics:
Total Sales by Product
Quantity Sold by Product Category
Quantity Sold by Product
🎯 Uncover top-performing and slow-moving products instantly.
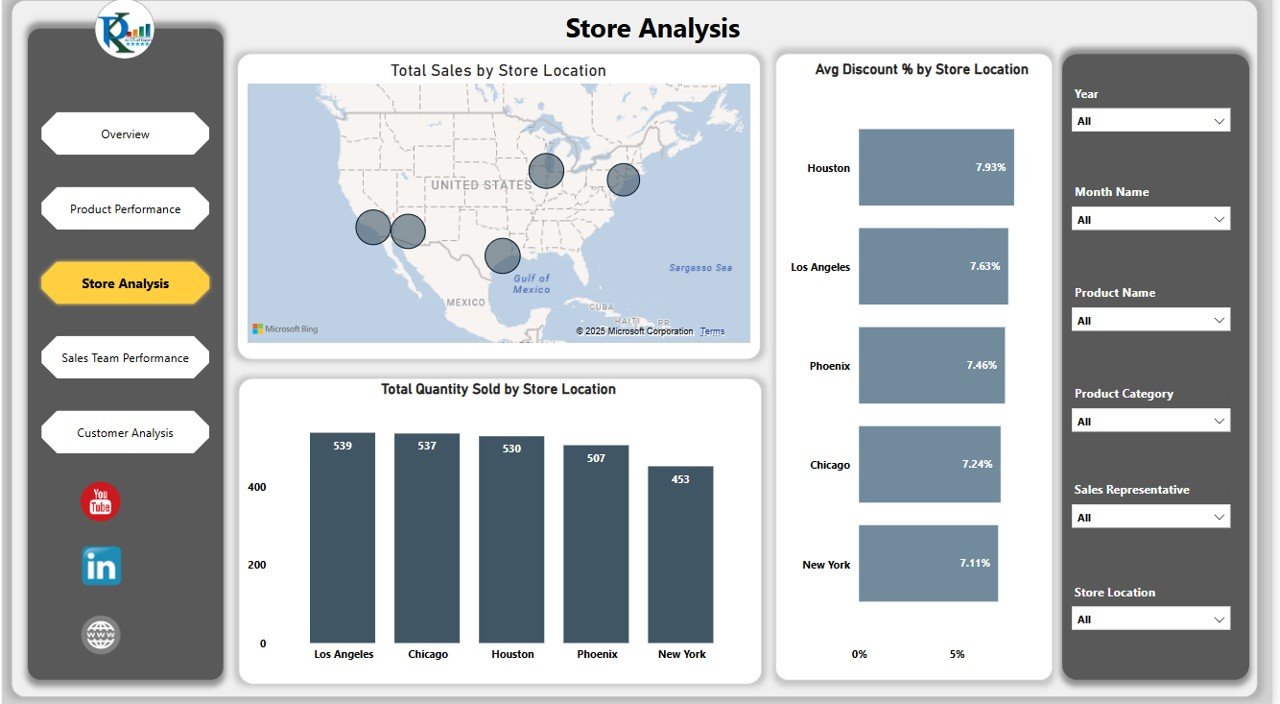
🏬 3. Store Analysis Page
Track store-level performance with powerful visuals:
Total Sales by Store
Avg. Discount % by Store
Quantity Sold by Location
🎯 Compare store performance and identify high/low-performing branches.
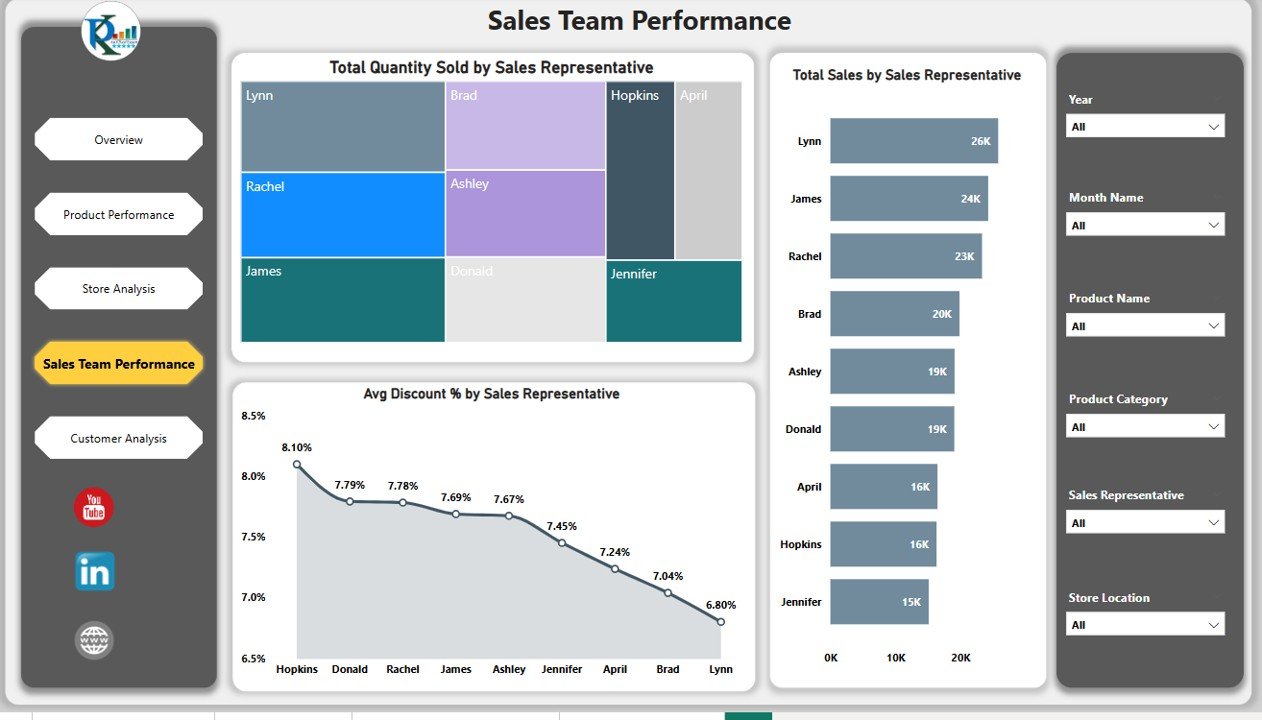
👥 4. Sales Team Performance Page
Evaluate individual sales reps with precision:
Total Sales by Sales Rep
Quantity Sold by Sales Rep
Avg. Discount % by Sales Rep
🎯 Monitor who’s outperforming and who needs support.
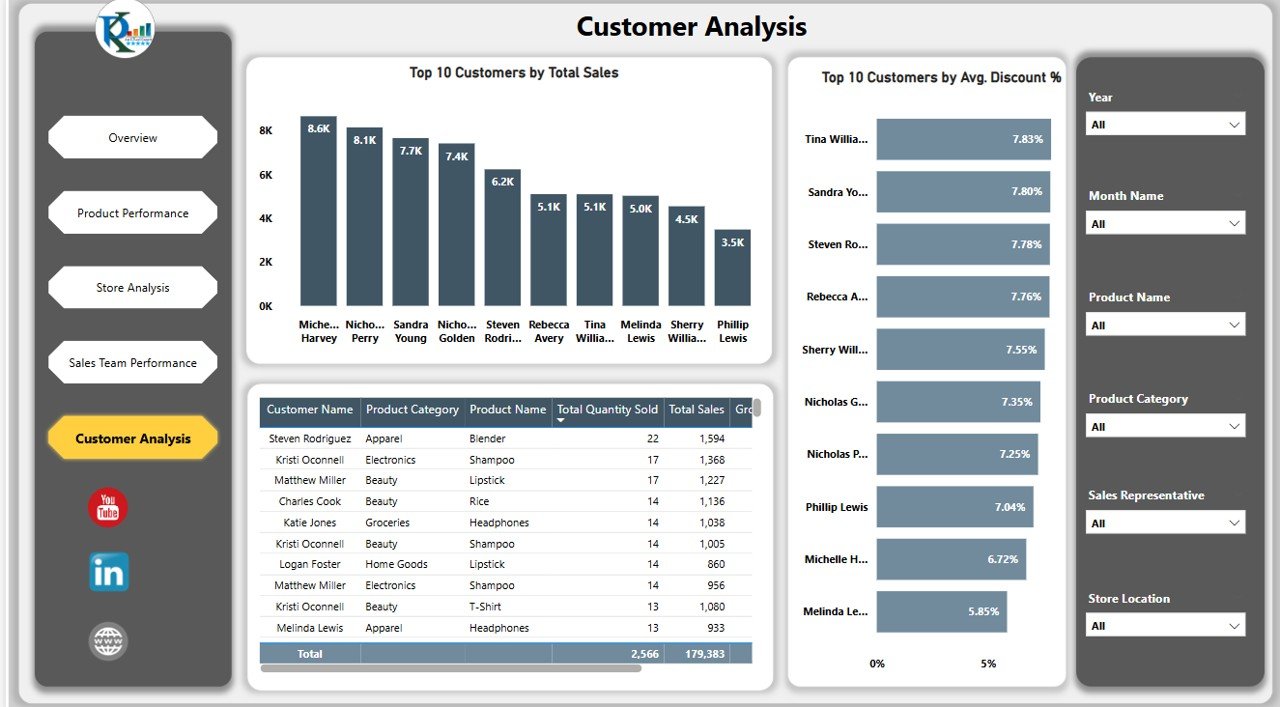
👤 5. Customer Analysis Page
Understand your customer base like never before:
🏆 Top 10 Customers by Total Sales
🎁 Top 10 by Avg. Discount %
📋 Detailed Table of Customer-Wise Sales
🎯 Identify loyal customers and adjust discount strategies effectively.
🚀 Benefits of the Retail Dashboard
🧠 Data-Driven Decision-Making: Make smarter marketing, stocking, and staffing choices.
🔍 Comprehensive Overview: Monitor sales, teams, and customers in one place.
📊 Visual Intelligence: Interactive charts and slicers for fast filtering.
🔧 Fully Customizable: Add KPIs, change layouts, or integrate with other tools.
⏱️ Real-Time Updates: Stay on top of daily, weekly, or monthly performance.
🌍 Store-Level Optimization: Benchmark locations and allocate resources better.
🛠️ How to Use the Dashboard
🔁 Import your retail data into Power BI
🎯 Use filters/slicers to explore categories, dates, locations, and reps
📊 Monitor performance metrics across pages
🔄 Update data regularly to reflect real-time insights
🔧 Customize visuals or KPIs as per your business model
👨💼 Who Is This For?
Retail Chains & Franchise Owners
Sales Managers & Retail Planners
Store Supervisors & Marketing Teams
Business Analysts & Decision-Makers
Whether you’re running physical stores or omnichannel setups, this dashboard adapts to your needs.
Read the detailed blog post
Watch the step-by-step video Demo:
🎥 Visit our YouTube Channel for easy-to-follow tutorials and walkthroughs.











Reviews
There are no reviews yet.