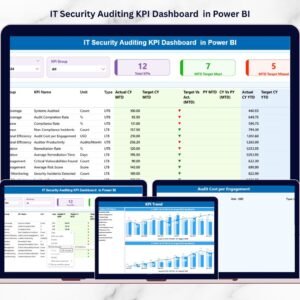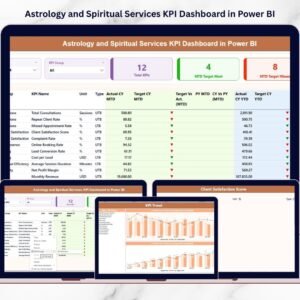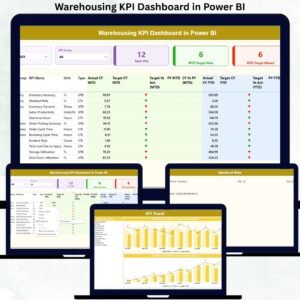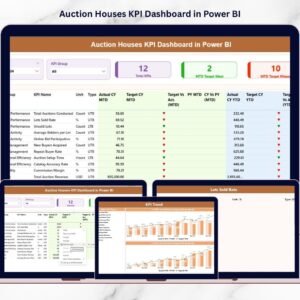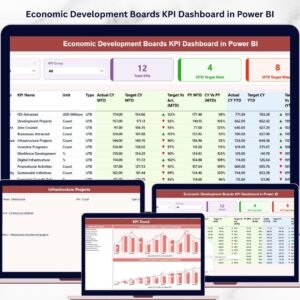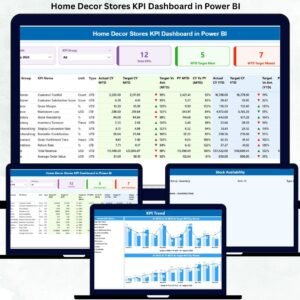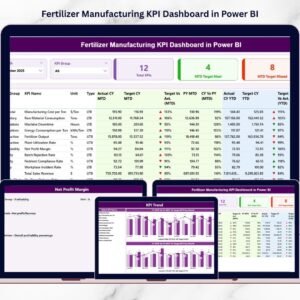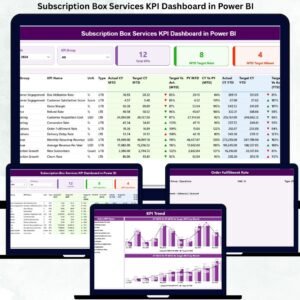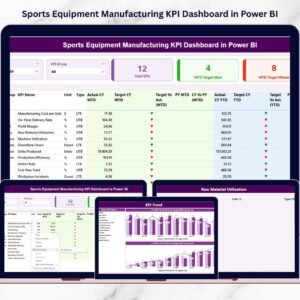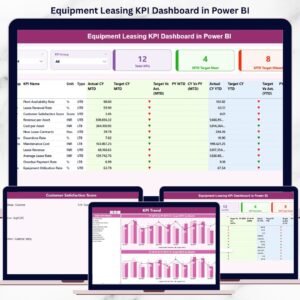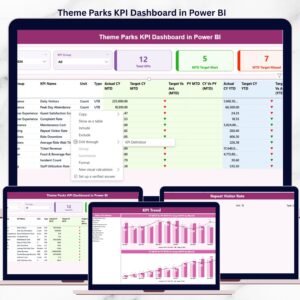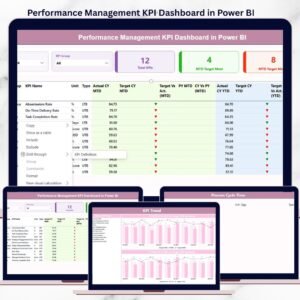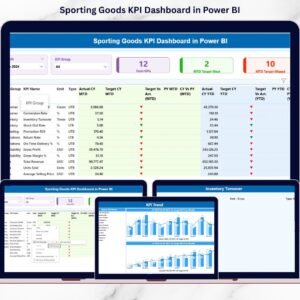
In retail, your inventory is your engine—and to keep that engine running efficiently, you need real-time insights. The Retail Inventory KPI Dashboard in Power BI is a smart, interactive tool designed to help you track your key inventory metrics with visual clarity and zero spreadsheet chaos.
Whether you’re managing stock levels, tracking sell-through rates, or analyzing returns, this dashboard empowers your retail team to make data-backed decisions, reduce stockouts, and boost efficiency. Built with sleek Power BI visuals and linked directly to an Excel data source, it’s automation made simple.
📊 What’s Inside the Dashboard?
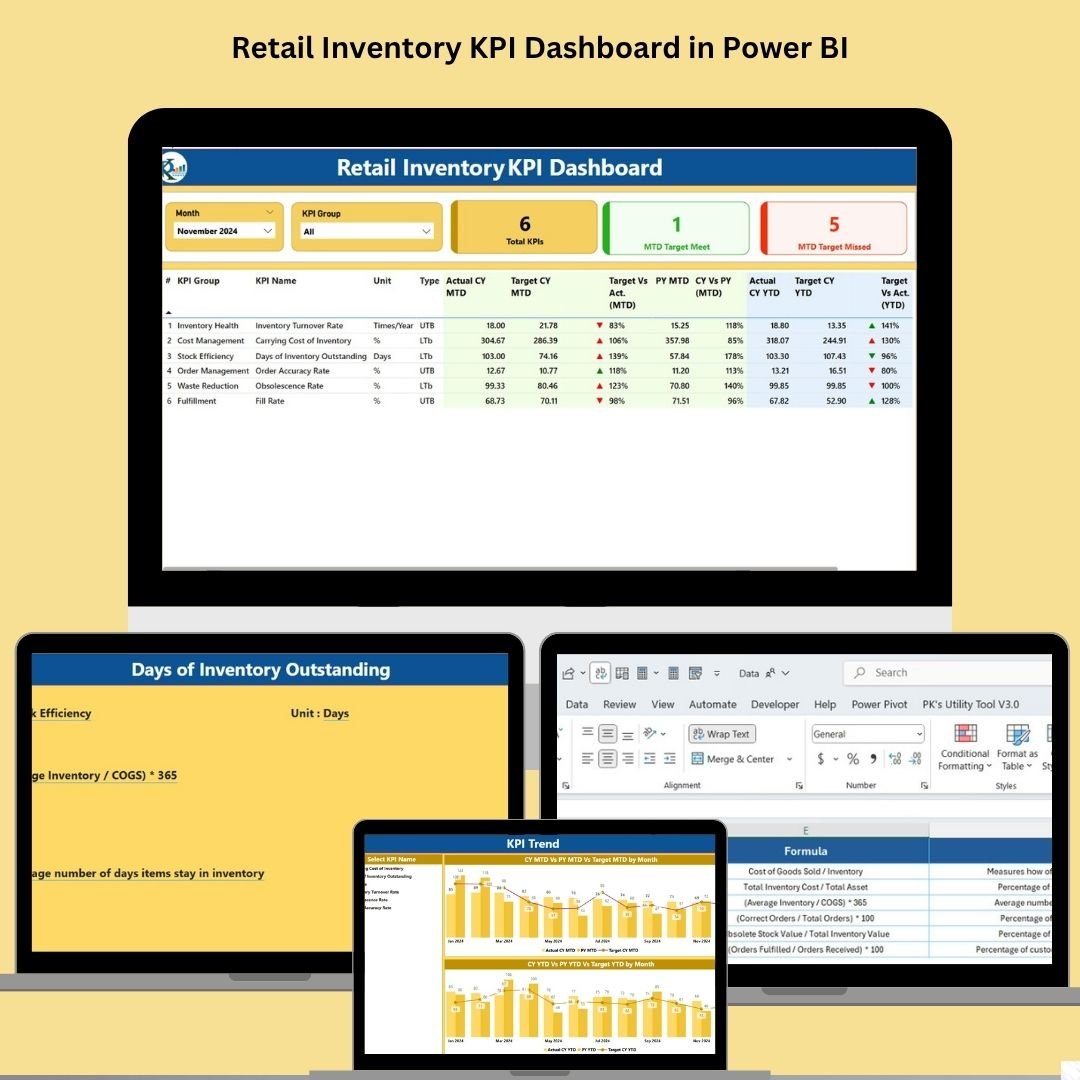
This Power BI template features three dynamic pages, each tailored to a specific analytical need:
🧩 1. Summary Page
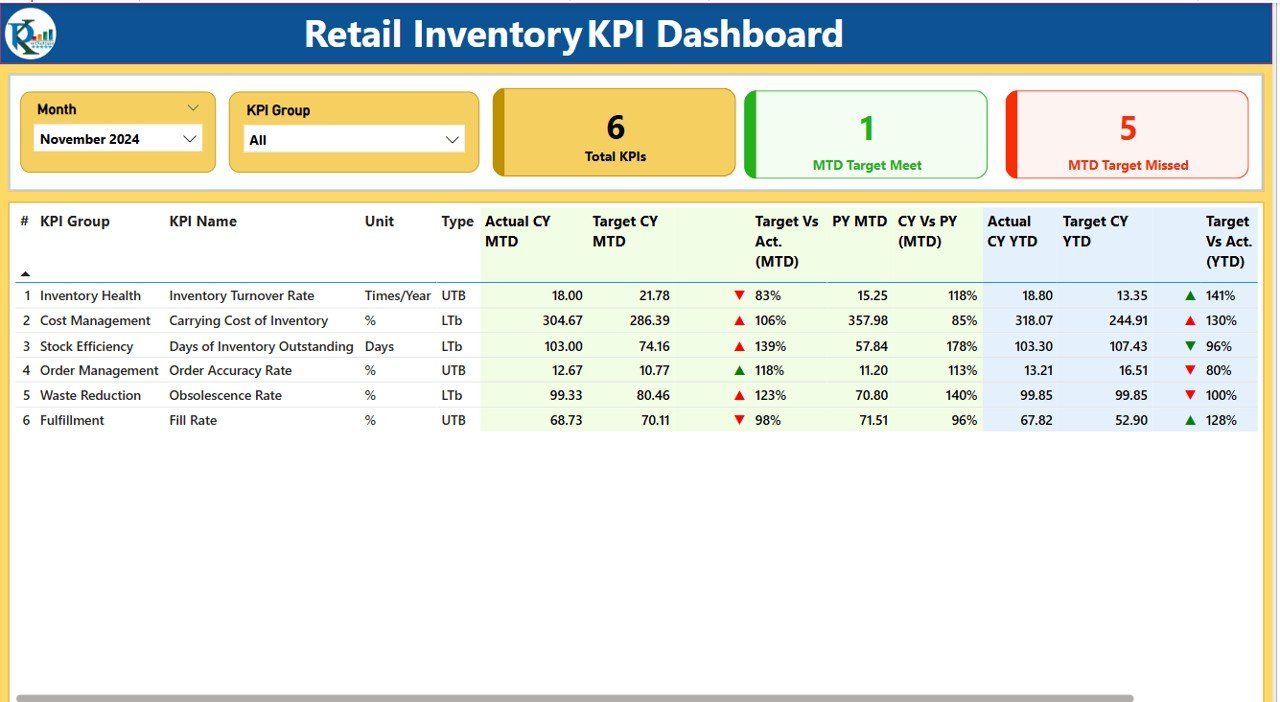
Your high-level control panel, featuring:
Slicers to filter by month and KPI Group
Summary Cards:
Total KPIs
MTD Target Met
MTD Target Missed
Detailed KPI Table: View actuals, targets, and comparisons in one place
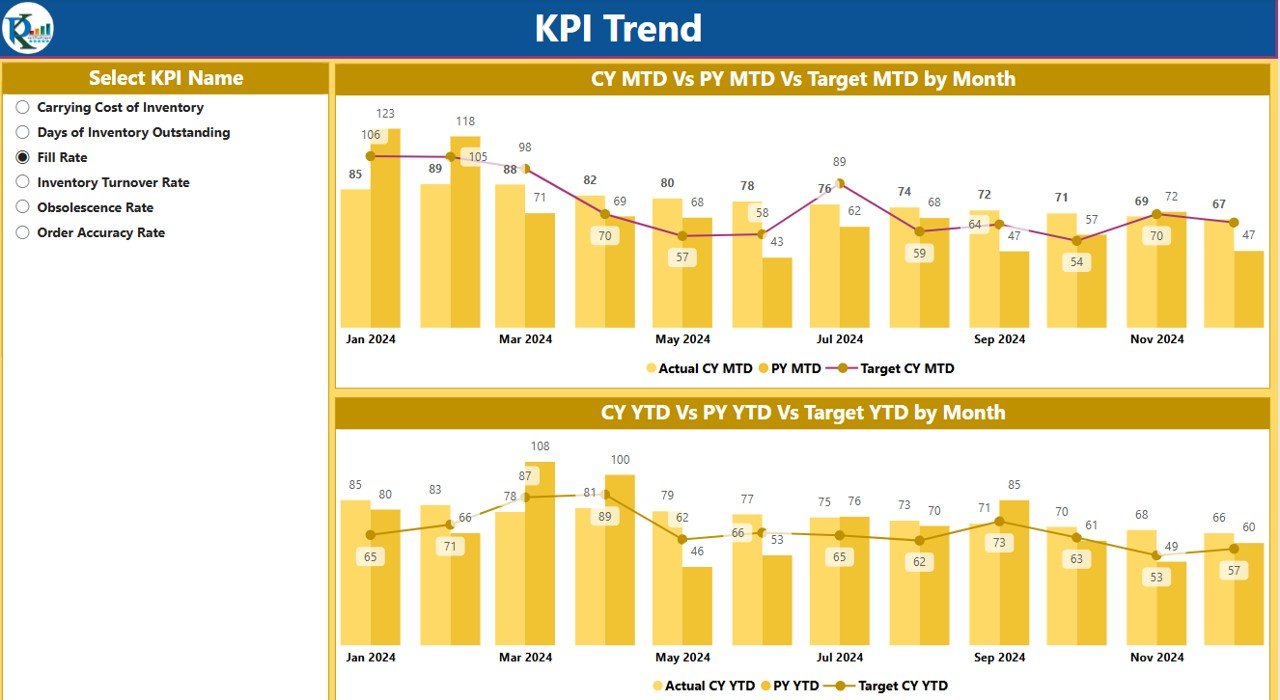
📈 2. KPI Trend Page
See the full picture with trend lines and comparisons for:
MTD vs. Target vs. Previous Year
YTD vs. Target vs. Previous Year
KPI Selector for focused analysis
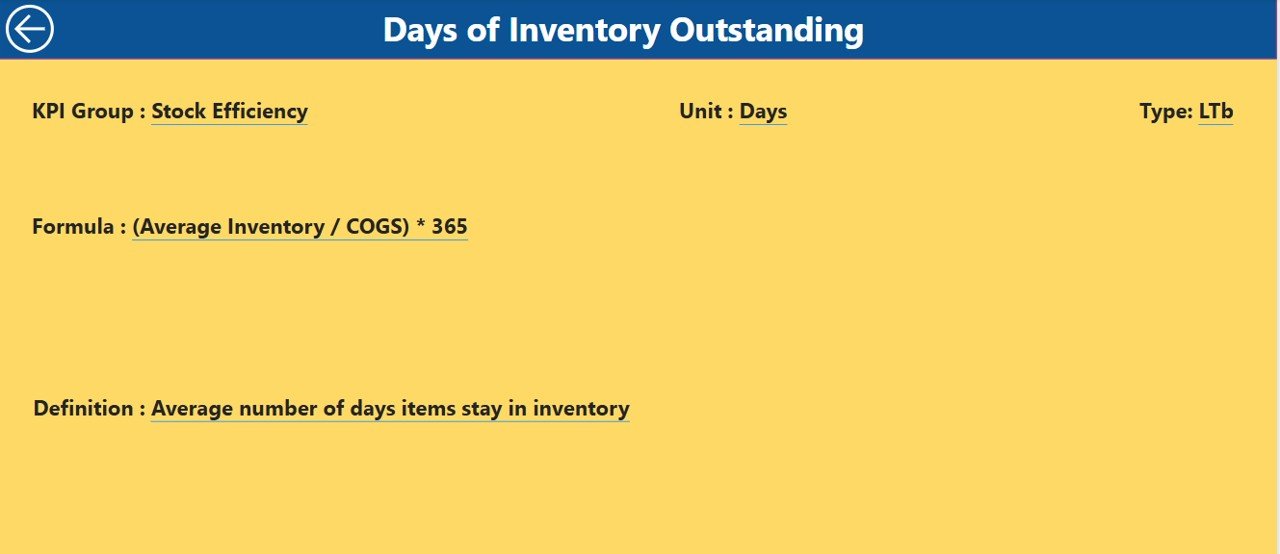
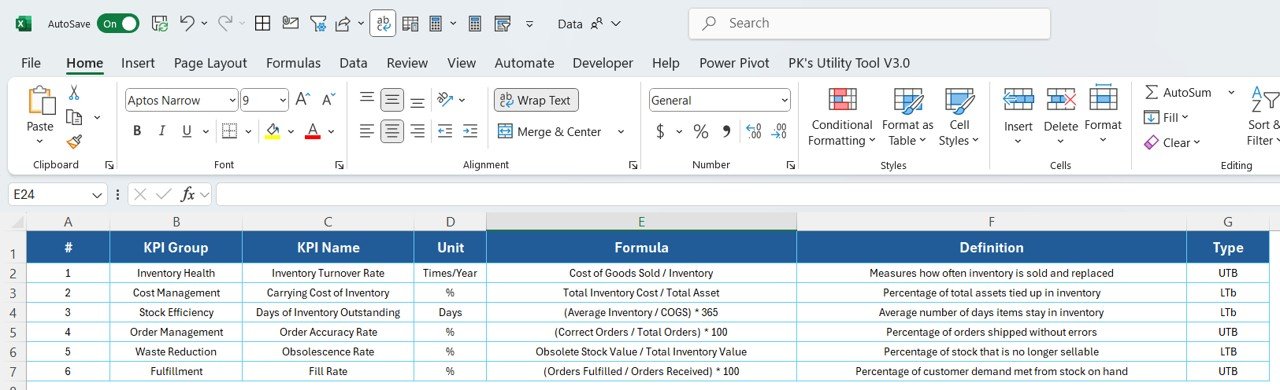
🧠 3. KPI Definition Page (Drillthrough Enabled)
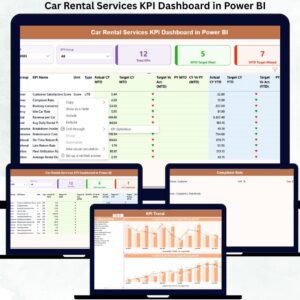
Right-click any KPI and dive deep into:
KPI Formula
Clear, concise Definitions
Performance Type: Lower-the-Better (LTB) or Upper-the-Better (UTB)
🗂 How the Data Works
All visuals are powered by a connected Excel data source, making it easy to update:
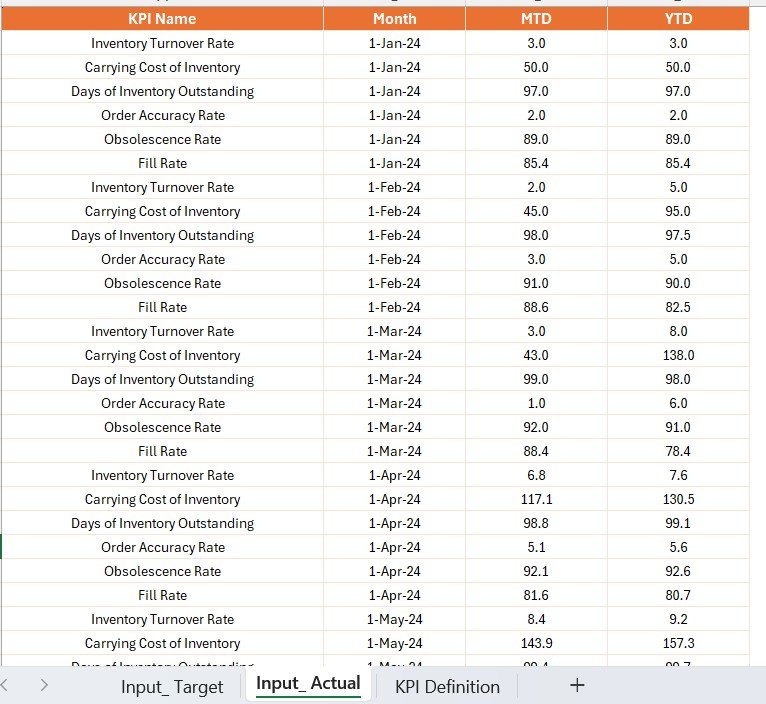
Input_Actual Sheet: Actual KPI values (MTD & YTD)
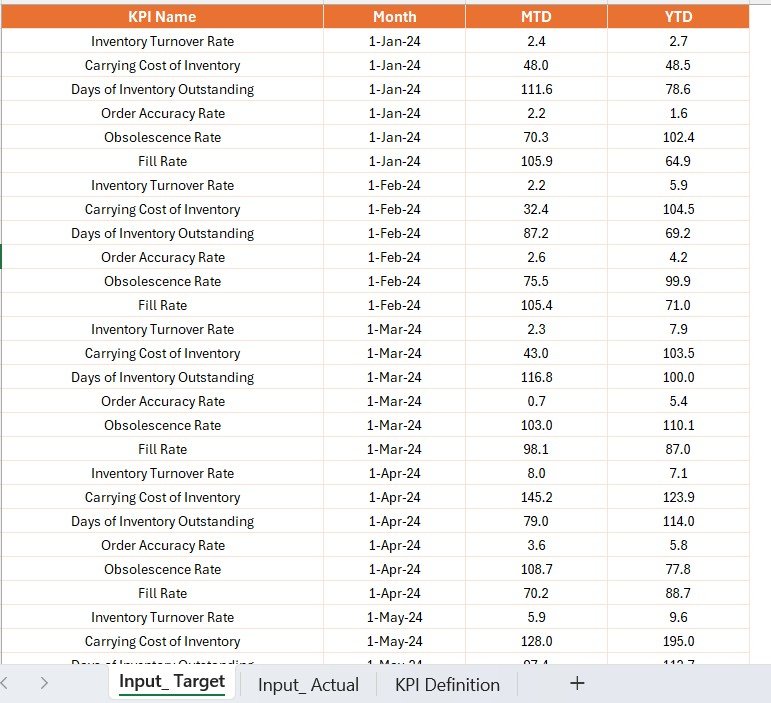
Input_Target Sheet: Target goals for each KPI
KPI Definition Sheet: KPI name, formula, definition, and measurement type
This structured backend keeps your dashboard clean, flexible, and scalable.
🚀 Key Benefits
📊 Real-Time KPI Monitoring
Track inventory performance with a single click—no more toggling between spreadsheets.
📉 Spot Issues Early
Visual cues, icons, and red/green status help you act before small issues become big losses.
📈 Smarter Decisions
Review trends, analyze gaps, and identify overstock or understock patterns instantly.
🔁 Zero Manual Effort
Simply update the Excel file and refresh Power BI—your visuals update automatically.
🧭 KPI Drilldowns
Gain context behind every metric using built-in drillthrough functionality.
🎨 Interactive Design
Use slicers, filters, and tooltips to create a personalized analytical experience.
🧠 Best Practices for Retailers
✅ Keep data formats consistent (especially dates and KPI names)
✅ Refresh your data daily or weekly for maximum accuracy
✅ Use KPI groups (e.g., Stock, Returns, Delivery) to streamline visuals
✅ Add tooltips for better usability by all team members
✅ Set up Power BI Service for automated sharing and publishing
🛒 Who Can Use This?
This dashboard is ideal for:
Retail Managers & Inventory Planners
E-commerce Operations Teams
Chain Store Analysts
Warehouse Heads
Procurement Teams
Category Managers
📈 Common Inventory KPIs to Track
Stock Turnover Rate
Days of Inventory on Hand
Inventory Accuracy
Sell-Through Rate
Stock-Out Frequency
Shrinkage Rate
🔧 Customization Options
Add or remove KPI groups
Connect to cloud sources (SQL, Azure, Google Sheets, etc.)
Modify visuals, color themes, or branding
Build summary views using custom bookmarks
🎯 Conclusion
If you want to make smarter, faster retail inventory decisions, this Power BI Dashboard is your perfect companion. It replaces guesswork with actionable insight, chaos with clarity, and manual effort with automation.
🎬 Learn how to set it up:
youtube.com/@PKAnExcelExpert