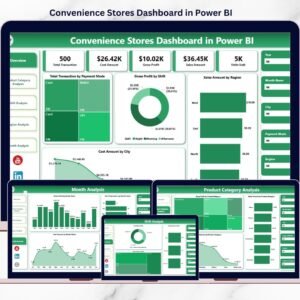
Discount Stores Dashboard in Power BI gives discount-store owners, retail managers, finance analysts, and regional leaders a ready Power BI report for tracking transactions, revenue, cost, gross profit, discount rate, product mix, region performance, store behavior, and customer trends. Retail margins can change quickly when discounts, category mix, and store location performance move in different directions, so this dashboard is built to help teams spot those changes earlier. It includes 5 report pages, 5 executive cards, interactive slicers, and visual analysis across sales trend, store insights, product performance, and customer behavior. Download the PBIX file once, connect your own source, and review performance without a monthly retail analytics subscription.
Key Features of Discount Stores Dashboard in Power BI
- 5 Power BI report pages covering Overview, Sales Trend, Store Insights, Product Analysis, and Customer Trends.
- Executive KPI cards for Total Transactions, Total Cost, Total Revenue, Net Gross Profit, and Discount Rate %.
- Interactive slicers so users can filter the report quickly by available retail fields and compare selected segments.
- Revenue, cost, discount, and margin visuals to connect promotional activity with business profitability.
- Store and regional insights for reviewing region performance, store type, and store location margin behavior.
- Product analysis views for category, brand, and customer-type profitability.
- Customer trend visuals for payment method, region, and salesperson revenue analysis.
- Editable Power BI model that can be adapted for your own discount-store reporting workflow.
What’s Inside the Discount Stores Dashboard in Power BI
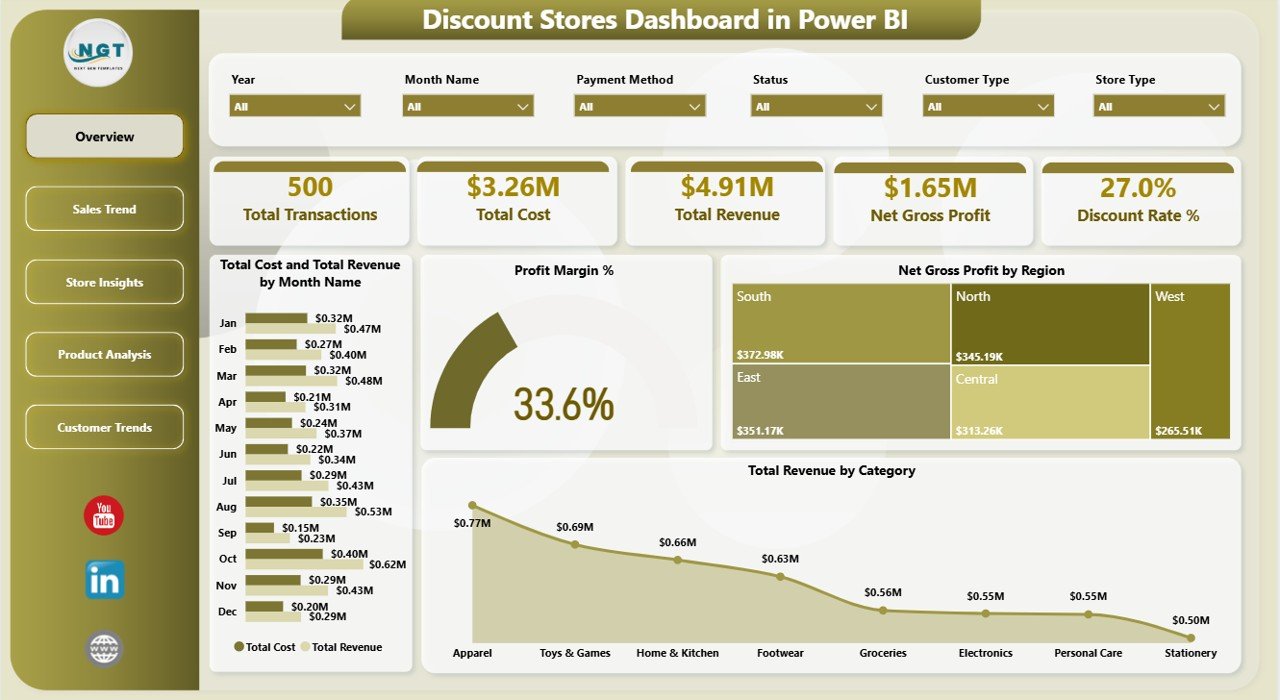
1. Overview Page
The Overview page presents high-level cards for Total Transactions, Total Cost, Total Revenue, Net Gross Profit, and Discount Rate %. These cards help decision-makers understand store performance before moving into detailed charts.
Total Cost and Total Revenue by Month Name compares spending and sales across months, making it easier to detect periods where cost growth outpaces revenue. Profit Margin % gives a fast view of profitability after cost and discount impact.
Net Gross Profit by Region shows which regions protect profit most effectively. Total Revenue by Category highlights the product categories contributing the largest sales value.
Discount Stores Dashboard in Power BI
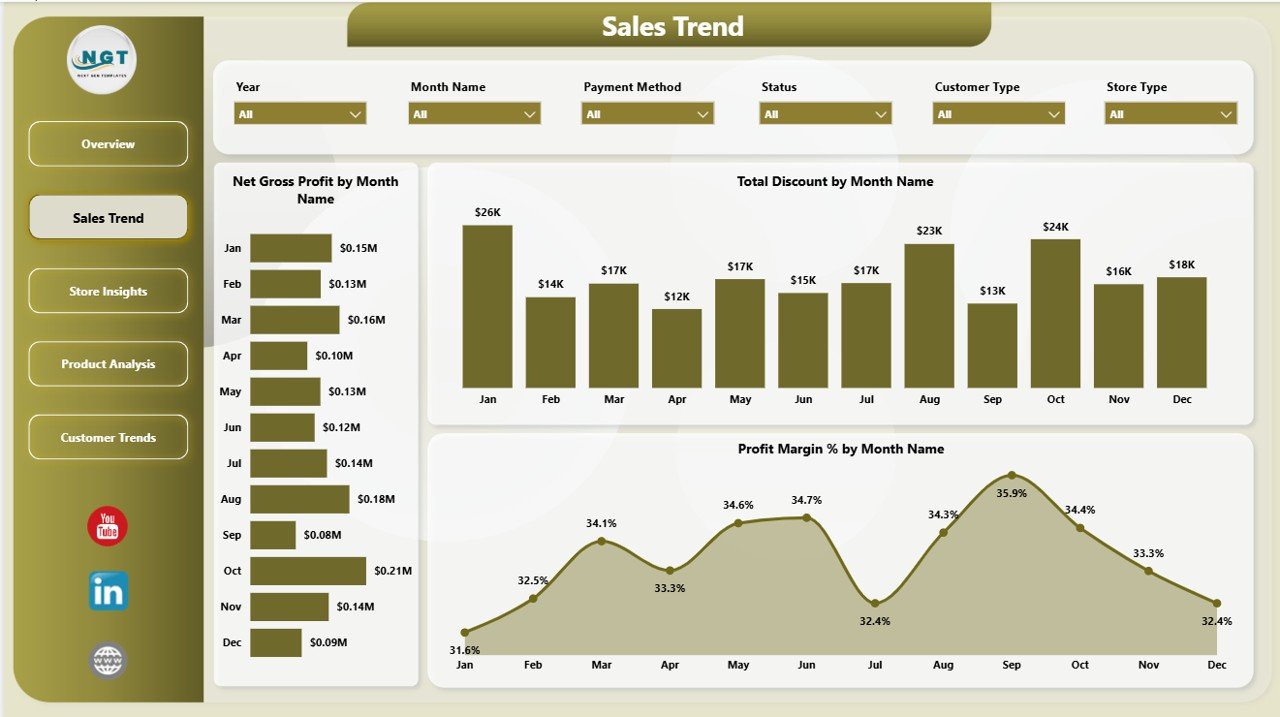
2. Sales Trend
The Sales Trend page focuses on month-level movement in profit, discounting, and margin. It is useful for checking whether promotions are supporting growth or reducing profitability.
Net Gross Profit by Month Name reveals month-over-month profit changes. Total Discount by Month Name tracks how discount value changes over time, while Profit Margin % by Month Name shows whether each period remains profitable.
Sales Trend
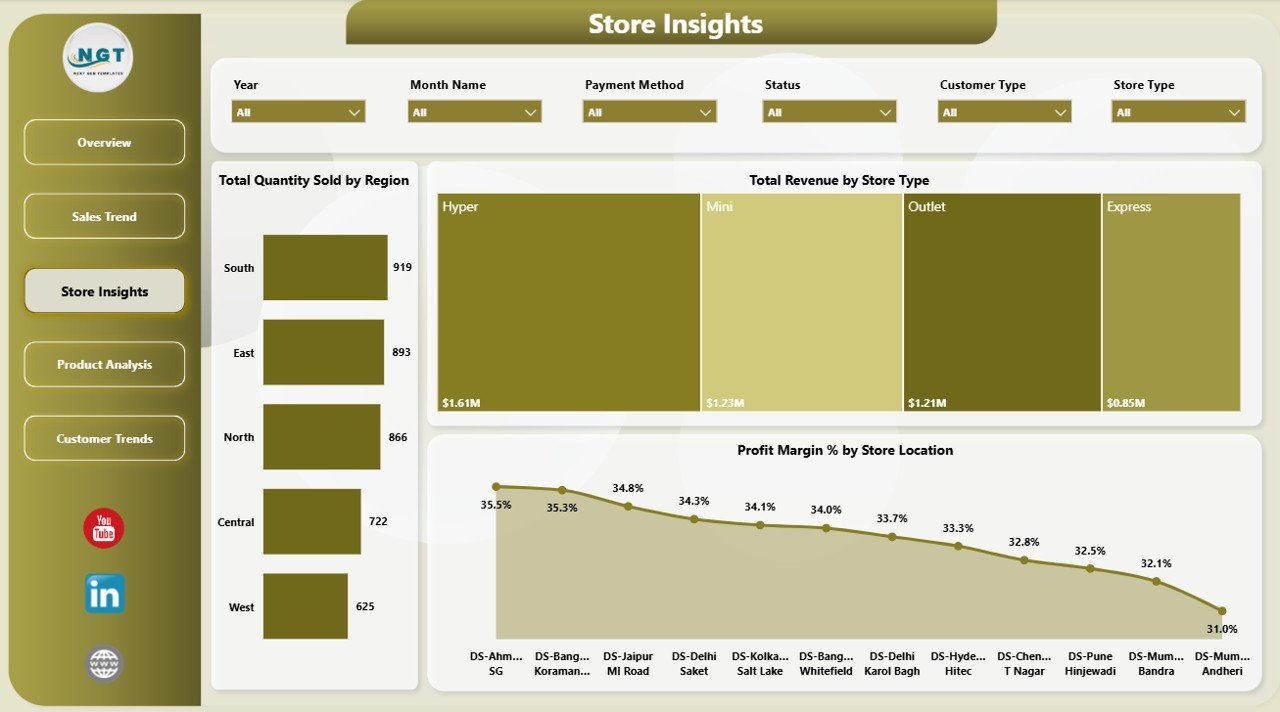
3. Store Insights
The Store Insights page compares performance by region, store type, and store location. It helps managers understand which formats and locations produce the strongest sales volume and margin.
Total Quantity Sold by Region identifies where unit movement is strongest. Total Revenue by Store Type compares store formats, while Profit Margin % by Store Location helps flag locations that may be discounting too heavily.
Store Insights
4. Product Analysis
The Product Analysis page reviews profitability by customer type, brand cost, and product category. This helps category managers understand which brands and categories deserve closer pricing review.
Profit Margin % by Customer Type compares customer groups after discounts and cost. Total Cost by Brand highlights brands with the largest cost exposure, while Profit Margin % by Category shows where profit is strongest or weakest.
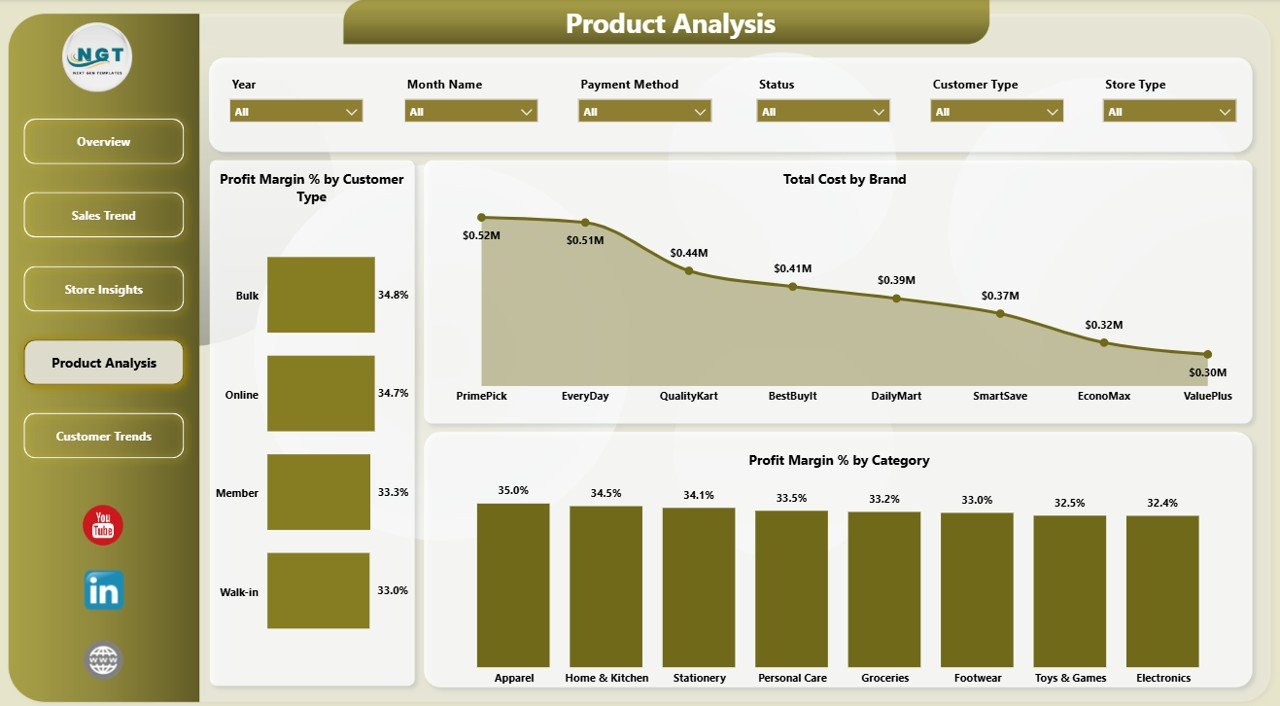
Product Analysis
5. Customer Trends
The Customer Trends page connects sales behavior with payment method, region, and salesperson performance. It supports customer and team-level review from one reporting page.
Total Revenue by Payment Method shows which payment channels contribute most to sales. Profit Margin % by Region provides a regional margin lens, and Total Revenue by Salesperson helps compare individual sales contribution.
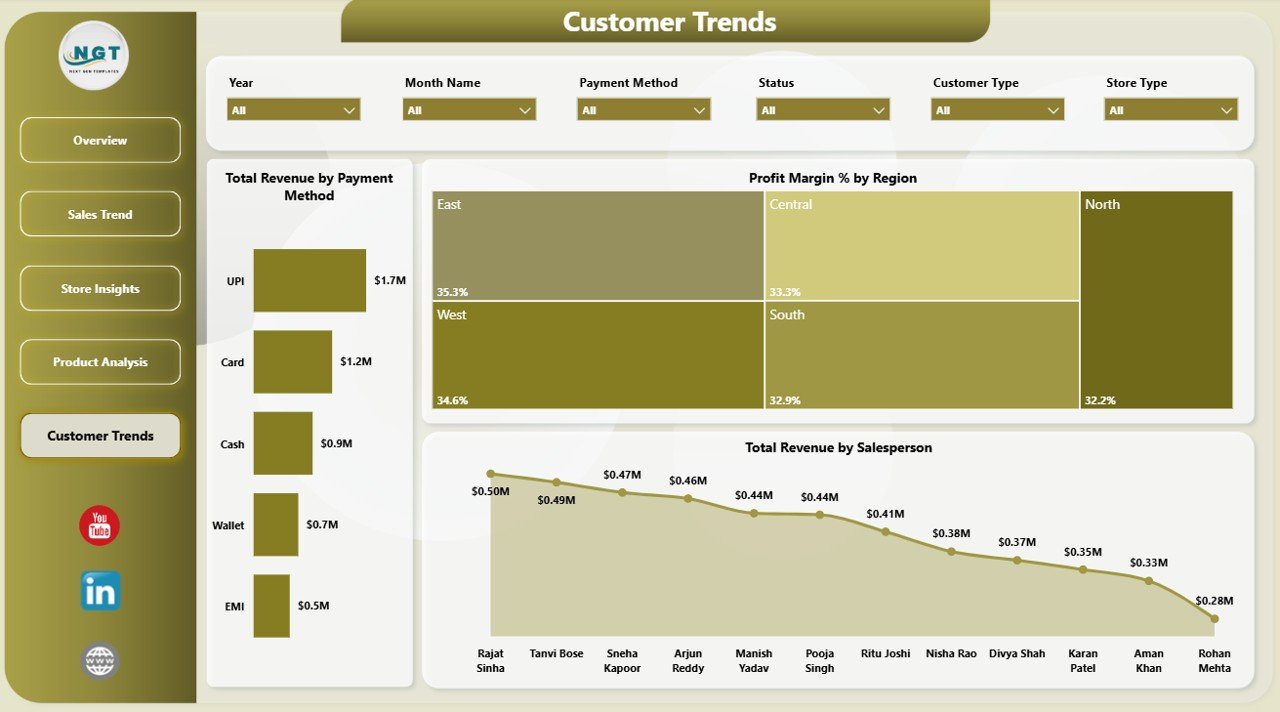
Customer Trends
Discount Stores Dashboard in Power BI vs. Tableau vs. Paid Retail SaaS – Where This Fits
| Feature | Discount Stores Dashboard in Power BI | Tableau alternative | Paid retail SaaS |
|---|---|---|---|
| Cost | $17.99 one-time | Requires separate licensing | Usually monthly or annual subscription |
| Platform | Power BI Desktop and Power BI Service | Tableau Desktop or Cloud | Vendor cloud platform |
| Setup time | Fast PBIX-based setup | Needs report rebuilding | Often requires onboarding |
| Real-time team collaboration | Available through Power BI Service | Available with Tableau Cloud | Usually included by plan |
| Mobile access | Available through Power BI apps after publishing | Available through Tableau apps | Usually included |
| Customizable fields | Editable data model and visuals | Editable if rebuilt in Tableau | Limited by vendor settings |
| Share with link | Available after publishing to Power BI Service | Available after publishing | Usually available |
| Year-1 cost at 5 users | $17.99 plus any Microsoft licensing you use | Often much higher licensing cost | Often hundreds or thousands of dollars |
| Discount and margin tracking | Pre-built retail visuals | Requires dashboard build work | Vendor-specific |
Who This Template Is For – and Who It’s Not For
Best for: discount-store owners, retail managers, regional managers, category analysts, finance teams, Power BI learners, and consultants who want a ready visual model for retail performance reporting.
Not for: teams that need live POS API integration, enterprise data warehouse governance, automated inventory replenishment, or a fully custom Power BI implementation with role-level security already configured.
How to Use the Discount Stores Dashboard in Power BI
- Download and unzip the file.
- Open the PBIX file in Power BI Desktop.
- Review the sample data structure and report pages.
- Replace or connect your own discount-store data source.
- Refresh the model and check KPI cards, charts, and slicers.
- Customize fields, colors, or visuals if needed.
- Publish to Power BI Service if your team wants browser or mobile access.
Real-World Use Cases
Maria, a regional retail manager, uses Net Gross Profit by Region and Profit Margin % by Store Location to spot stores that sell well but lose profit through heavy discounts.
Ravi, a category analyst, reviews Total Revenue by Category, Total Cost by Brand, and Profit Margin % by Category before recommending pricing changes.
Emma, a finance analyst, compares Total Discount by Month Name with Net Gross Profit by Month Name to understand whether promotional campaigns are profitable.
Frequently Asked Questions
What does the Discount Stores Dashboard in Power BI track?
It tracks transactions, total cost, total revenue, net gross profit, discount rate, monthly trends, regional profit, category revenue, store type, brand cost, payment method, and salesperson revenue.
Do I need advanced Power BI skills?
No. The report pages and visuals are already built. Basic Power BI Desktop knowledge is helpful when replacing data sources or publishing the report.
Can I customize the dashboard?
Yes. You can edit visuals, measures, colors, data model fields, and page layout inside Power BI Desktop.
Can I use it with my own store data?
Yes, if your data contains compatible retail fields or you map your source fields to the model structure.
Is Power BI Desktop required?
Yes. Open and edit the PBIX file in Power BI Desktop. Microsoft provides Power BI Desktop as a free download.
Is this a subscription?
No. This is a one-time downloadable template. Power BI Service sharing may require Microsoft licensing depending on your use case.
About the Author
Built by PK – Microsoft Certified Professional with 15+ years of Excel, Google Sheets, and Power BI experience. Founder of NextGenTemplates, reaching 300K+ subscribers across YouTube channels. Every template is hand-built and tested before release.
Explore Related Templates
Pair this template with Discount Stores Dashboard in Excel, Digital Microloans Dashboard in Power BI, or Dairy Industry Dashboard in Power BI. You can also browse the Power BI Dashboard Templates category.
Download the Discount Stores Dashboard in Power BI today and start reviewing retail revenue, discount, margin, product, store, and customer trends from one editable PBIX file.
Watch the step-by-step video tutorial:


Reviews
There are no reviews yet.