

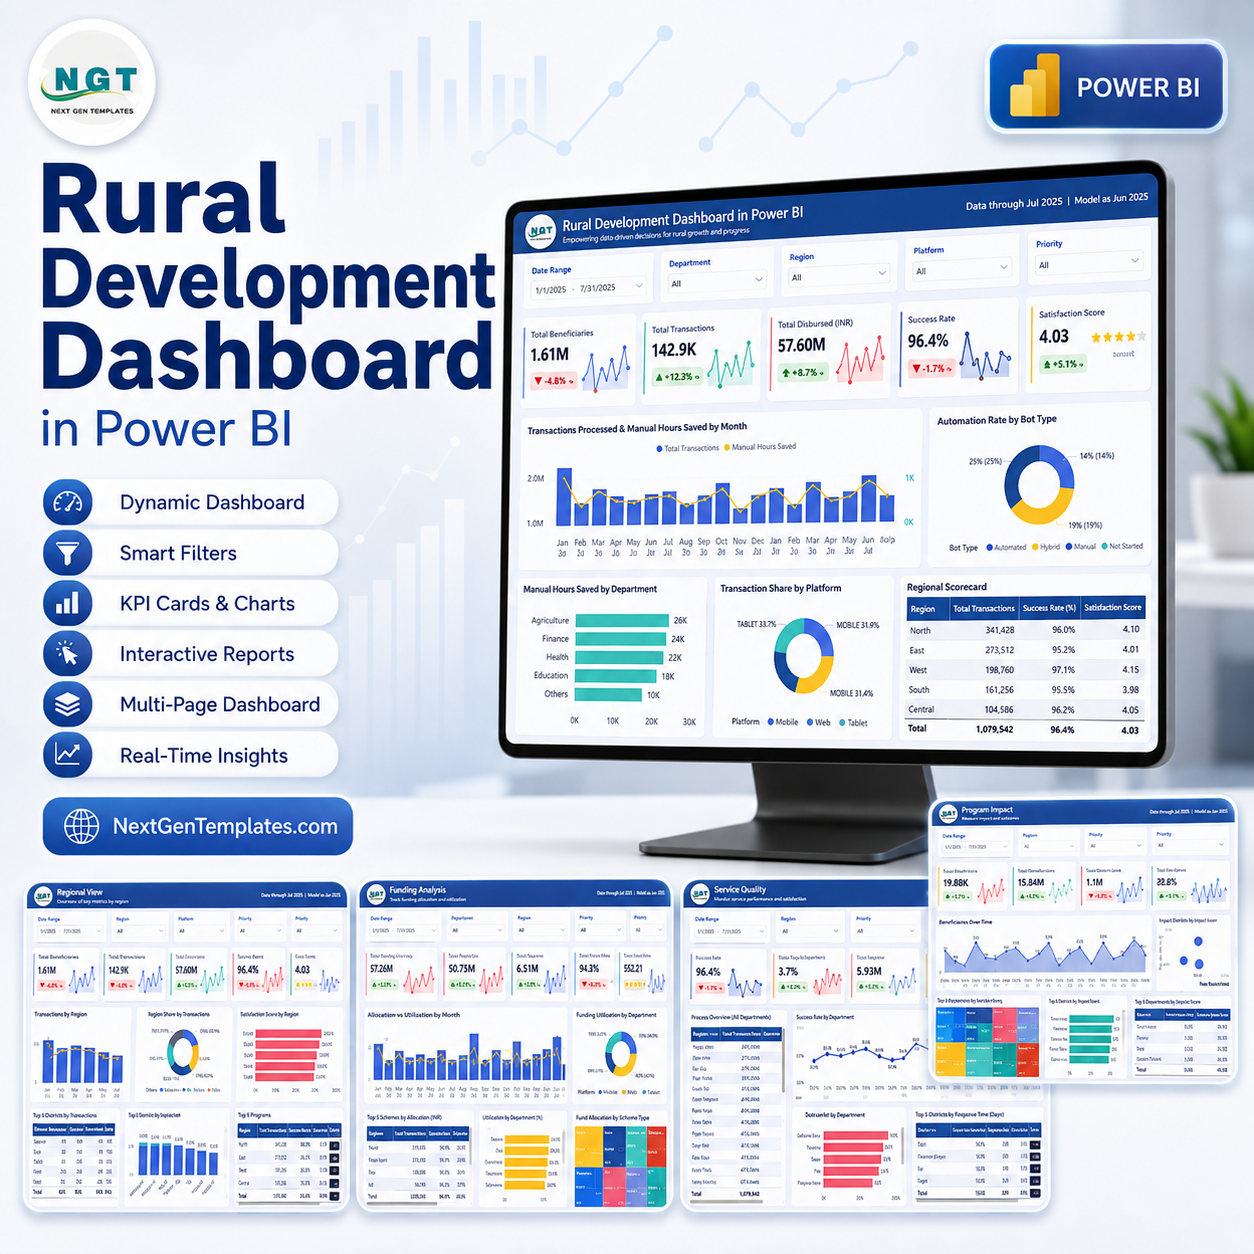

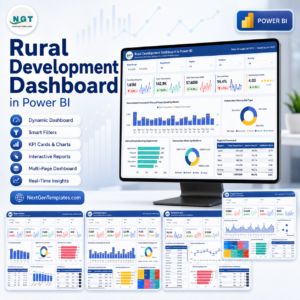
Rural Development Dashboard in Power BI gives program teams a ready-to-use reporting file with 5 Power BI pages, 5 executive KPI cards, 25 chart views, and slicers for fast filtering. Track transactions processed, manual hours saved, program cost, success rate, satisfaction, regional performance, funding spend, service quality, and process-owner accountability in one editable PBIX report. Built by PK for a 300K+ subscriber learning audience, this is a one-time $17.99 download with no recurring SaaS reporting fee. Replace the sample data, refresh the report, and review rural development performance with confidence.

Key Features of Rural Development Dashboard in Power BI
- 5 Power BI pages: Overview, Program Impact, Regional View, Funding Analysis, and Service Quality.
- 5 executive KPI cards: Transactions Processed, Manual Hours Saved, Total Program Cost, Success Rate, and Satisfaction Score.
- 25 chart views: Review operational, funding, regional, departmental, process, and quality performance.
- Multiple slicers: Filter the dashboard quickly using the available report dimensions.
- Impact analysis: Track hours saved, bot runtime, department contribution, and top process outcomes.
- Regional and funding visibility: Compare regions, departments, platforms, spend, and cost per hour saved.
- Editable PBIX file: Customize visuals, measures, fields, colors, slicers, and source connections in Power BI Desktop.
What’s Inside the Rural Development Dashboard in Power BI
1. Overview Page
The Overview page gives leaders a quick summary of rural development operations and service delivery. Cards show Transactions Processed, Manual Hours Saved, Total Program Cost, Success Rate, and Satisfaction Score.
Transactions Processed and Manual Hours Saved by Month: This chart compares activity volume with time saved across months. It helps identify whether higher program throughput is also reducing manual workload.
Automation Mix by Bot Type: This visual shows how different automation types contribute to the program. It helps teams understand whether work is handled by attended, unattended, API, or other bot categories.
Manual Hours Saved by Department: This chart ranks departments by time savings. It highlights where rural service teams are receiving the strongest productivity benefit.
Transaction Share by Platform: This chart shows how transactions are distributed across delivery platforms. It helps compare platform dependency and workload concentration.
Regional Scorecard by Region: This view compares regional performance in one scorecard-style visual. It supports quick review of which areas are performing well and which need attention.
2. Program Impact
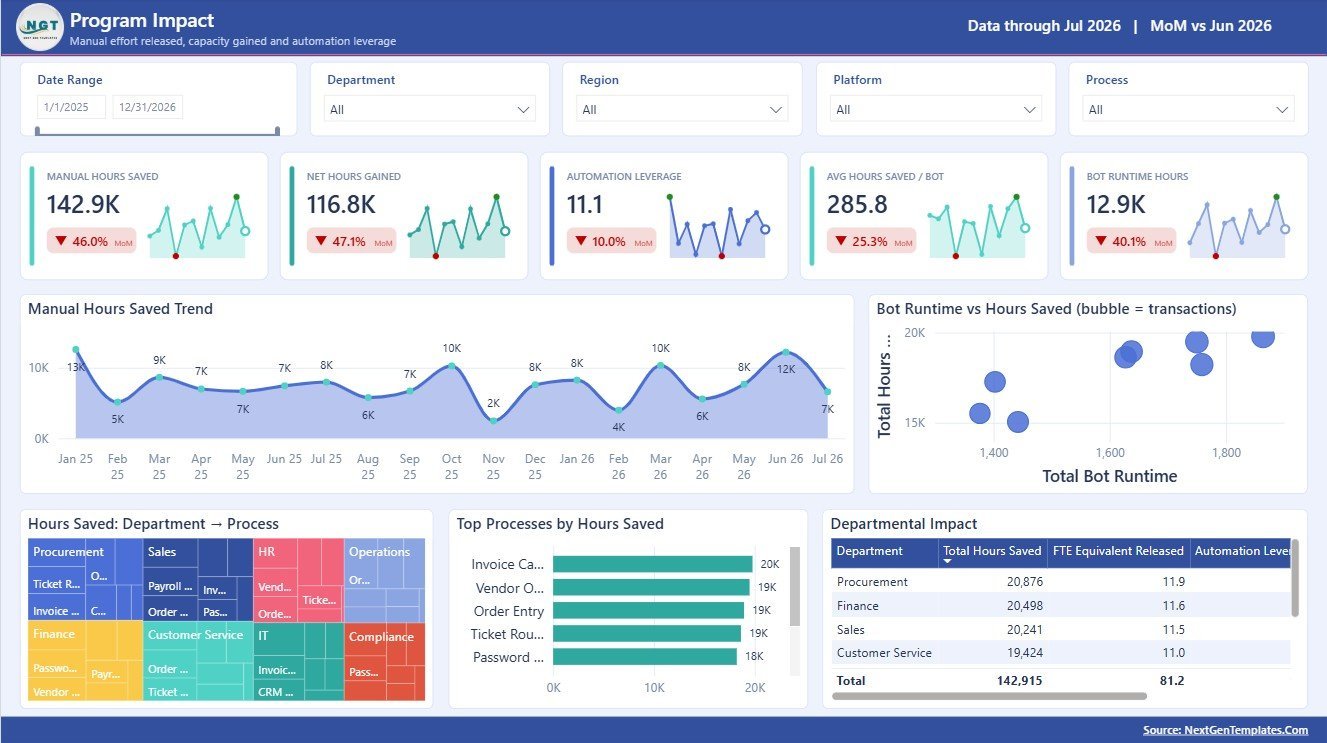
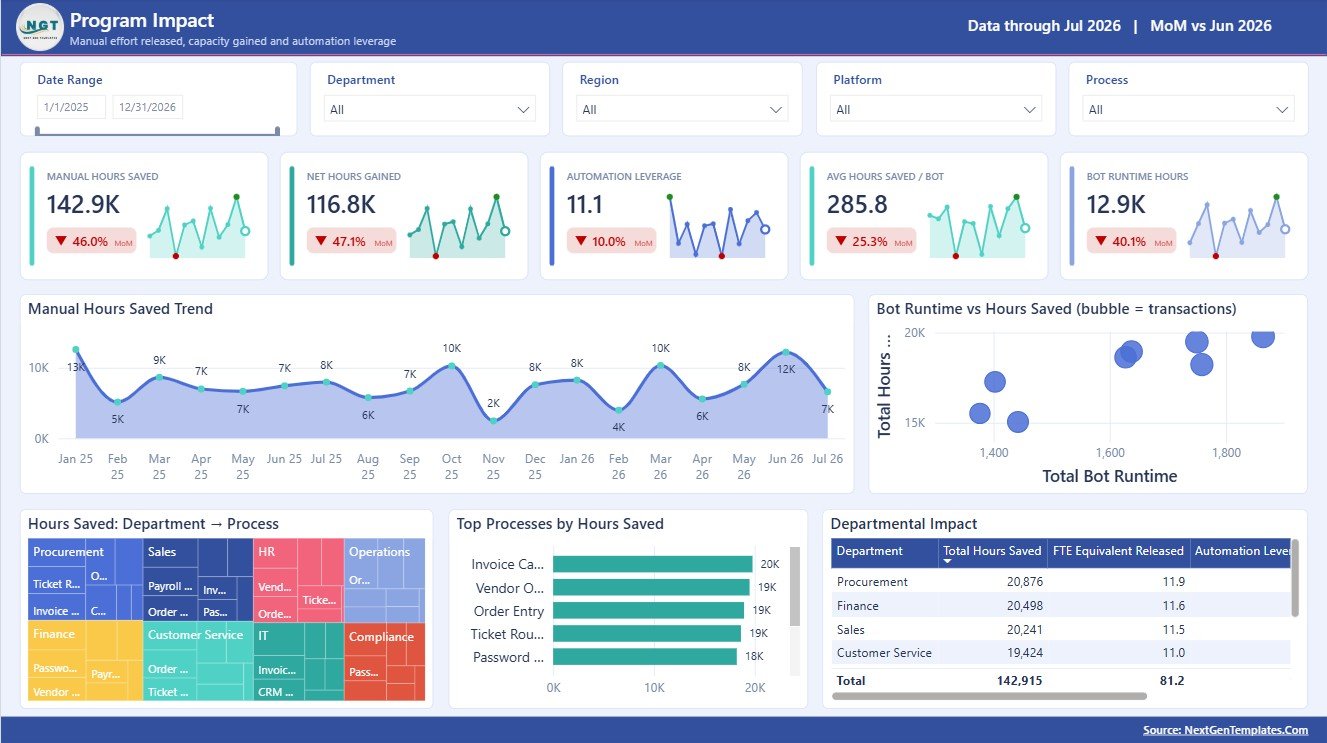
The Program Impact page focuses on operational value and department-level results.
Manual Hours Saved by Month: This chart tracks monthly time savings from rural program automation and process improvement. It helps leaders verify whether operational benefits are increasing over time.
Bot Runtime vs Hours Saved: This chart compares runtime with saved effort. It helps identify whether automation effort is producing practical time savings.
Hours Saved by Department and Process: This visual breaks savings into department and process combinations. It helps teams find the processes creating the highest productivity gain.
Top Processes by Hours Saved: This chart ranks the best-performing processes. It is useful for prioritizing scale-up, documentation, and replication.
Departmental Impact by Department: This visual compares impact across departments. It helps program owners see where rural service improvement is strongest.
3. Regional View
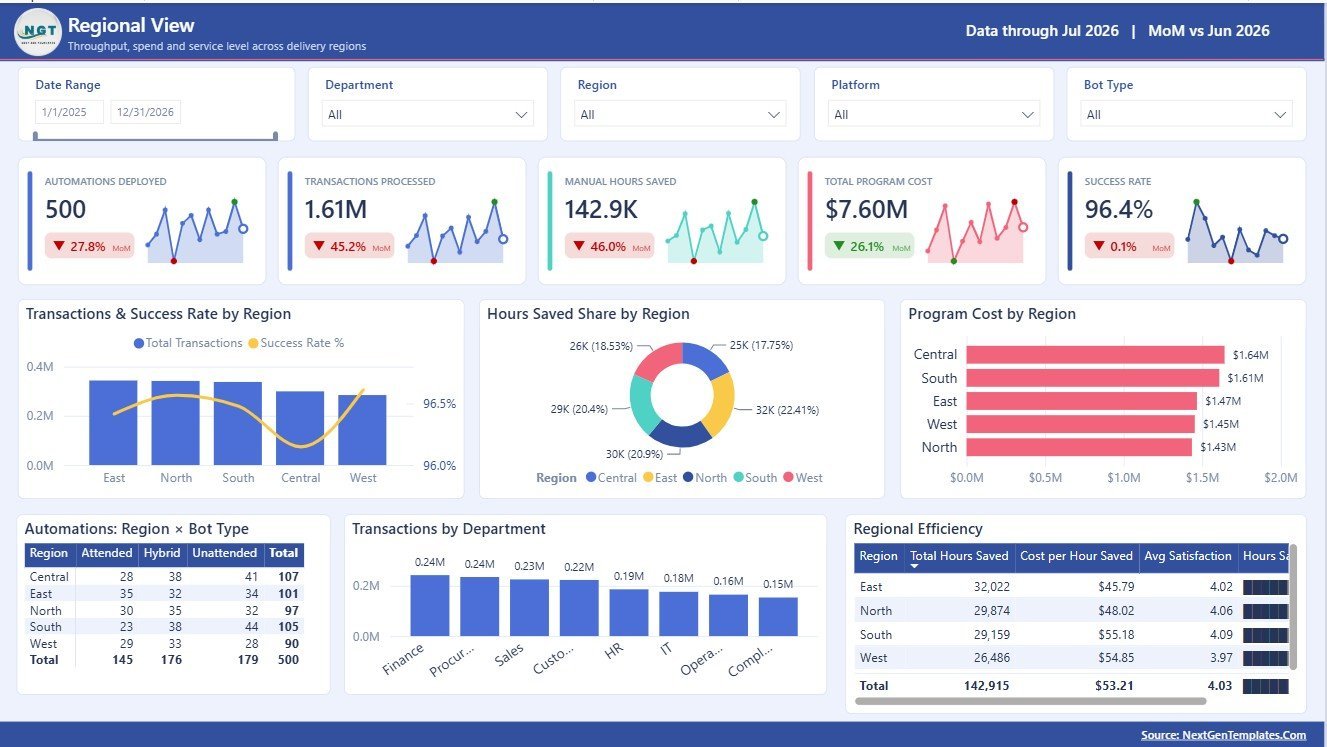
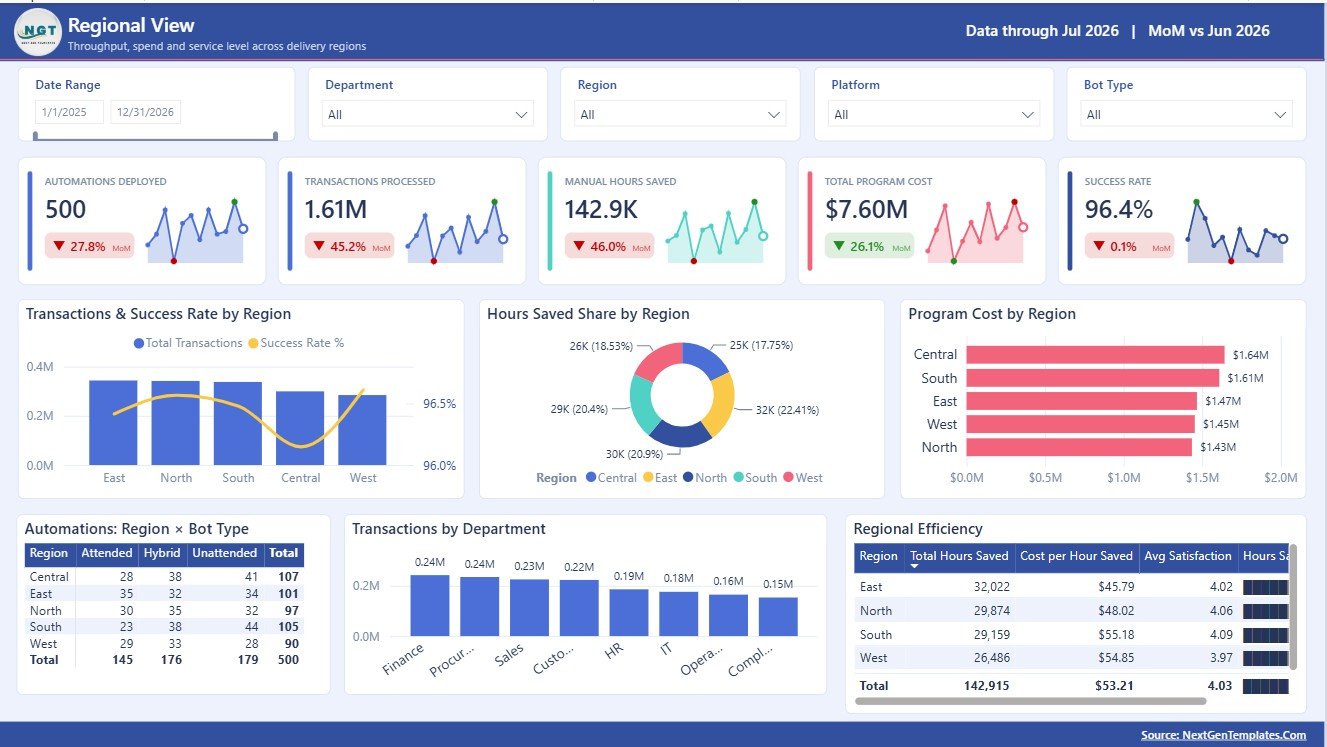
The Regional View page compares service delivery and efficiency across locations.
Transactions and Success Rate by Region: This chart compares volume with reliability by region. It helps identify high-volume regions that also need quality monitoring.
Hours Saved Share by Region: This visual shows how total saved time is distributed across regions. It helps highlight areas receiving the largest operational benefit.
Program Cost by Region: This chart compares spending by region. It supports budget review and funding allocation discussions.
Automations by Region and Bot Type: This chart shows automation coverage by region and bot category. It helps compare maturity and technology mix across areas.
Transactions by Department: This visual ranks departments by transaction load. It helps identify heavy service areas and potential staffing pressure.
Regional Efficiency by Region: This chart compares regional efficiency results. It helps leaders locate regions where cost, workload, or quality needs deeper review.
4. Funding Analysis
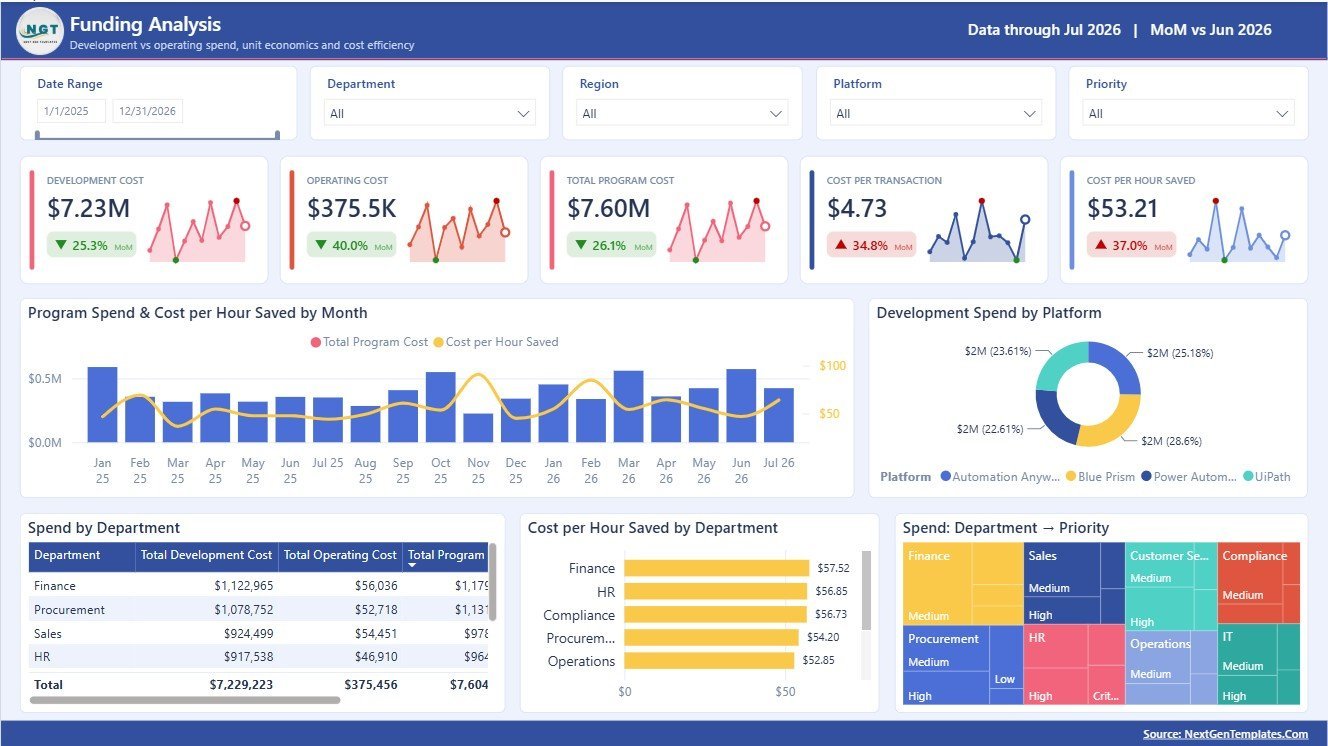
The Funding Analysis page connects spend, cost efficiency, department funding, and priority levels.
Program Spend and Cost per Hour Saved by Month: This chart compares monthly spend with cost efficiency. It helps teams understand whether spending is translating into saved effort.
Development Spend by Platform: This visual breaks development spending by platform. It helps review where technology investment is concentrated.
Spend by Department: This chart compares department-level spend. It supports budget control and department funding review.
Cost per Hour Saved by Department: This chart shows the efficiency of spend by department. Lower cost per hour saved can indicate better operational return.
Spend by Department and Priority: This visual combines spend with priority. It helps verify whether high-priority work is receiving suitable funding.

5. Service Quality
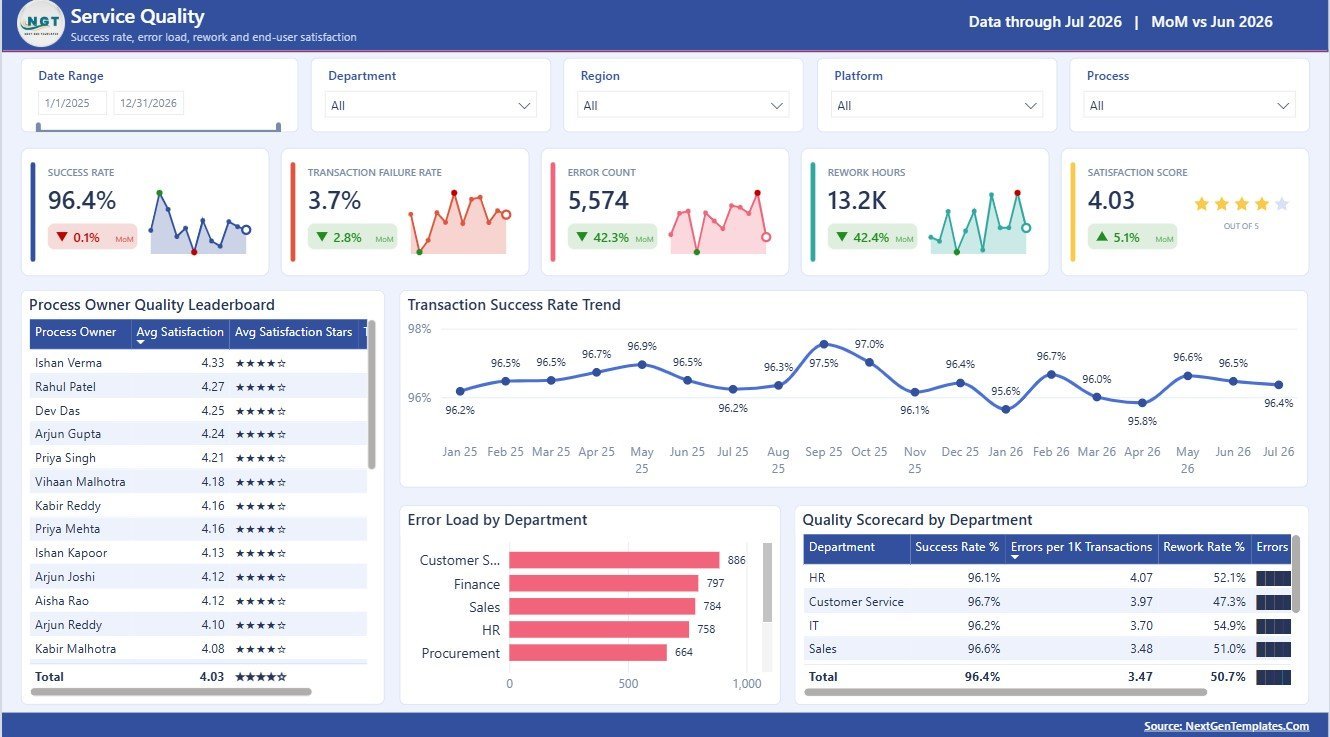
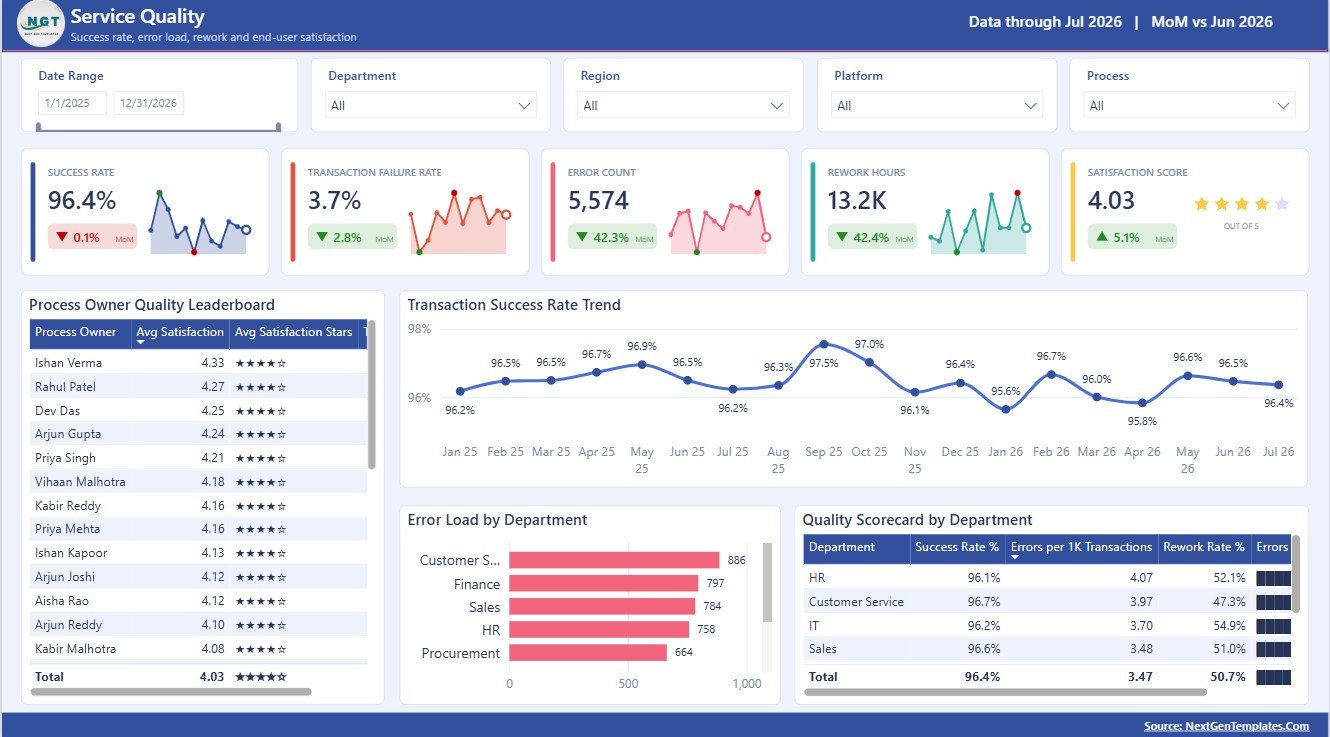
The Service Quality page focuses on quality, errors, process ownership, and department scorecards.
Process Owner Quality Leaderboard by Process Owner: This chart ranks process owners by quality performance. It supports accountability and best-practice sharing.
Transaction Success Rate by Month: This chart tracks service reliability over time. It helps detect months where success rate improves or declines.
Error Load by Department: This visual shows where errors are concentrated. It helps prioritize correction, training, and process redesign.
Quality Scorecard by Department: This scorecard compares department-level quality metrics. It gives leaders a quick view of service health across teams.
Rural Development Dashboard in Power BI vs. Tableau vs. Paid CRM/SaaS – Where This Fits
| Feature | This Power BI dashboard | Tableau alternative | Paid SaaS alternative |
|---|---|---|---|
| Cost | $17.99 one-time sale price | Requires Tableau access and build time | Recurring subscription or implementation fee |
| Platform | Power BI Desktop and Power BI Service | Tableau Desktop or Tableau Cloud | Vendor cloud system |
| Setup time | Download, review sample data, replace source, refresh | Build calculations and visuals manually | Onboarding, configuration, and user setup |
| Real-time team collaboration | Available through Power BI Service | Available through Tableau Cloud | Usually role-based |
| Customizable fields | Edit model, measures, visuals, and slicers | Editable with Tableau skills | Limited by vendor configuration |
| Share with link | Available through Power BI publishing | Available through Tableau sharing | Usually login controlled |
| Year-1 cost at 5 users | $17.99 template plus Power BI access | Software plus build effort | Often much higher with licenses |
| Rural development fit | Best for reusable program reporting and Power BI teams | Best for teams already standardized on Tableau | Best for live case management or workflow operations |
Who This Template Is For – and Who It’s Not For
This template is for rural development departments, government program teams, NGOs, CSR teams, public-sector analysts, grant managers, and consultants who need repeatable Power BI reporting for program operations, regional performance, funding, efficiency, and service quality.
It is not a live case management system, mobile data collection app, beneficiary registry, approval workflow, or replacement for a full government MIS. Use it when your rural development data can be connected to Power BI or prepared in a source file for reporting.
How to Use the Rural Development Dashboard in Power BI
- Download and unzip the product package.
- Open the PBIX file in Power BI Desktop.
- Review the sample model, pages, cards, charts, and slicers.
- Replace or connect your own rural development data source.
- Refresh the report and validate cards, charts, and filters.
- Customize visuals, fields, colors, and measures as needed.
- Publish to Power BI Service if you want to share the report with your team.
Real-World Use Cases
Anika, rural program director: reviews transactions processed, total cost, satisfaction, and regional scorecards before the monthly governance meeting.
Rohit, public-sector analyst: uses Program Impact and Regional View to compare hours saved, department workload, region efficiency, and success rate.
Meera, NGO funding manager: uses Funding Analysis to compare spend, cost per hour saved, department funding, and priority allocation for donor reporting.
Frequently Asked Questions
What is included in the Rural Development Dashboard in Power BI?
The PBIX report includes Overview, Program Impact, Regional View, Funding Analysis, and Service Quality pages with KPI cards, charts, and slicers.
Can I connect my own rural development data?
Yes. You can replace or connect your own data source in Power BI Desktop and refresh the report.
Do I need Power BI Desktop?
Yes. Open the PBIX file in Power BI Desktop, which is available from Microsoft.
Can I customize the report?
Yes. You can edit visuals, model fields, measures, slicers, colors, and source connections if you are comfortable with Power BI.
Is this a live government MIS?
No. It is a reporting dashboard, not a workflow, beneficiary enrollment, or live transaction processing system.
Can I publish it online?
Yes, if you have the required Microsoft Power BI account and sharing permissions, you can publish it to Power BI Service.
About the Author
Built by PK – Microsoft Certified Professional with 15+ years of Excel, Google Sheets, and Power BI experience. Founder of NextGenTemplates, reaching 300K+ subscribers across YouTube channels. Every template is hand-built and tested before release.
Explore Related Templates
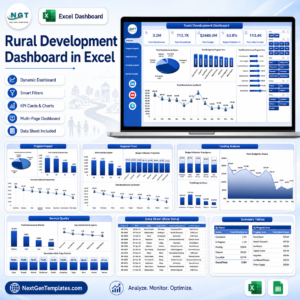
- Rural Development Dashboard in Excel
- Rural Development KPI Dashboard in Power BI
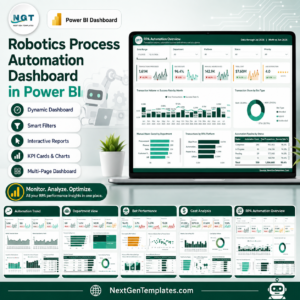
- Robotics Process Automation Dashboard in Power BI
- Power BI templates
- Power BI dashboard templates
Download the Rural Development Dashboard in Power BI to turn program transactions, savings, funding, regional efficiency, and service quality data into a clear Power BI reporting experience.
Last updated: August 8, 2026.
Watch the demo video:
Compatibility and Requirements
- Works in Power BI Desktop, which is free from Microsoft. Open the PBIX file there to edit the model, visuals and data source. Microsoft explains the install in Get Power BI Desktop.
- Publishing to Power BI Service needs a Microsoft Power BI account with sharing permissions.











Reviews
There are no reviews yet.