Are you struggling to track sales, profit, and customer insights in your baby products business? Still relying on messy spreadsheets that slow down your decisions?
👉 It’s time to upgrade to the Baby Products Retail Dashboard in Power BI – your all-in-one solution to monitor, analyze, and grow your retail business with confidence.
This powerful and interactive dashboard transforms your raw retail data into clear, actionable insights. Instead of wasting time on manual reports, you get real-time visibility into sales performance, profitability, customer behavior, and delivery trends.
💡 Whether you are managing an online baby store or a multi-location retail chain, this dashboard helps you make smarter decisions, boost profits, and stay ahead of the competition.
🚀 Key Features of Baby Products Retail Dashboard in Power BI
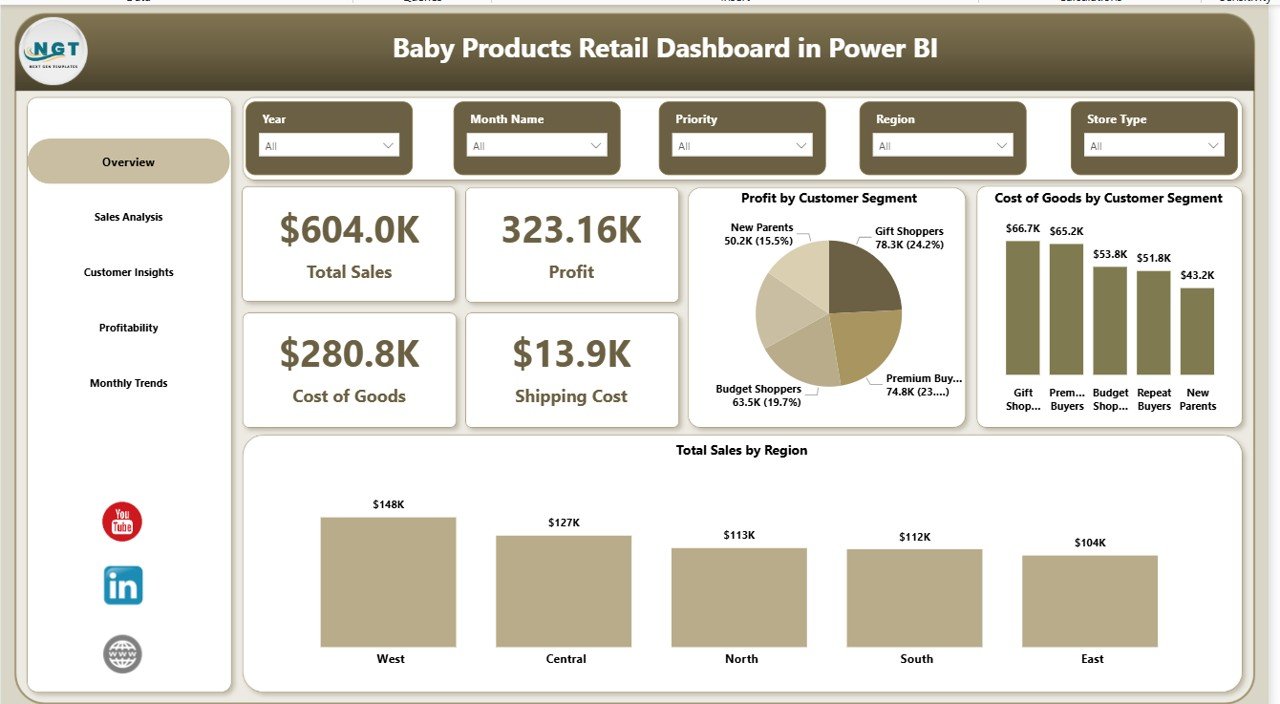
✨ 📊 Real-Time KPI Tracking – Monitor total sales, profit, cost of goods, and shipping costs instantly.
✨ 🌍 Region-Wise Sales Analysis – Identify top-performing regions and optimize your market strategy.
✨ 🛍️ Customer Segment Insights – Understand buying behavior across different customer segments.
✨ 📦 Store Type Performance – Analyze sales and quantity sold by different store types.
✨ 💳 Payment Method Analysis – Discover which payment methods drive the highest revenue.
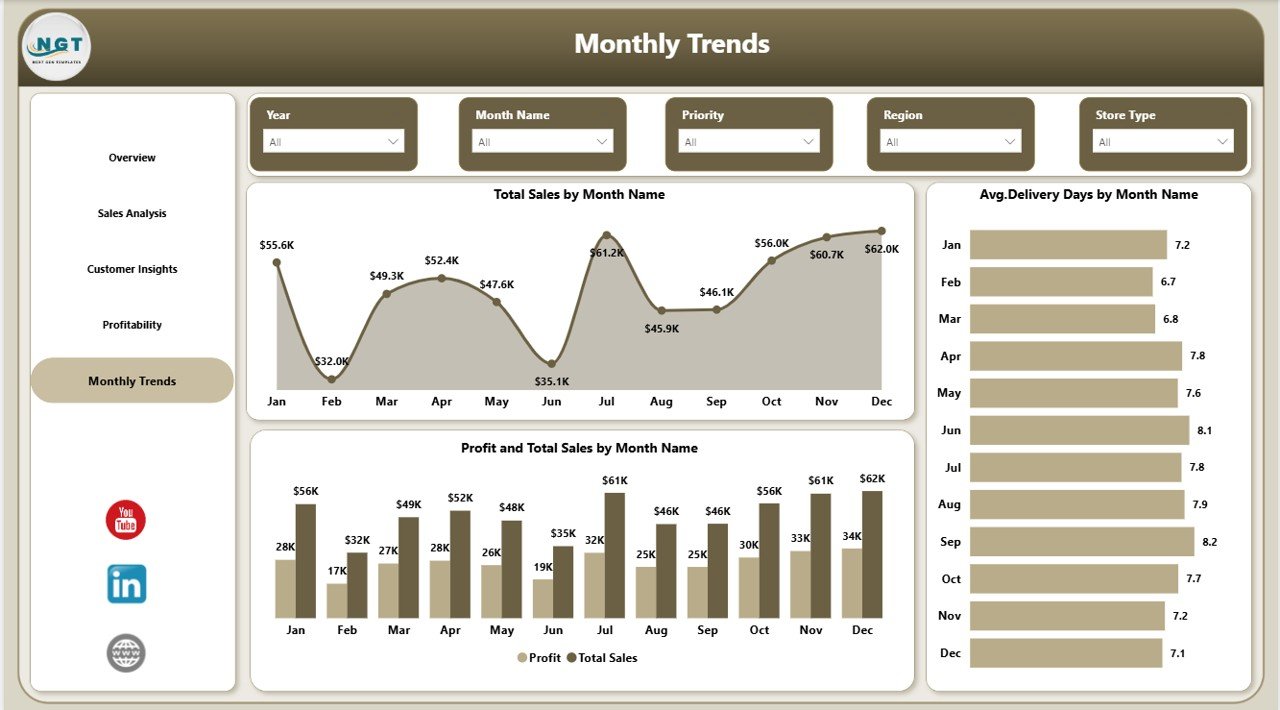
✨ 📈 Monthly Trend Analysis – Track performance trends and growth over time.
✨ 🚚 Delivery Performance Monitoring – Evaluate delivery efficiency with average delivery days.
✨ 💡 Profitability Insights – Identify high-profit product categories and cost-heavy areas.
✨ 🎯 Interactive Filters (Slicers) – Easily drill down into specific data for deeper insights.
✨ ⚡ Automated Data Visualization – Convert complex data into simple and interactive visuals.
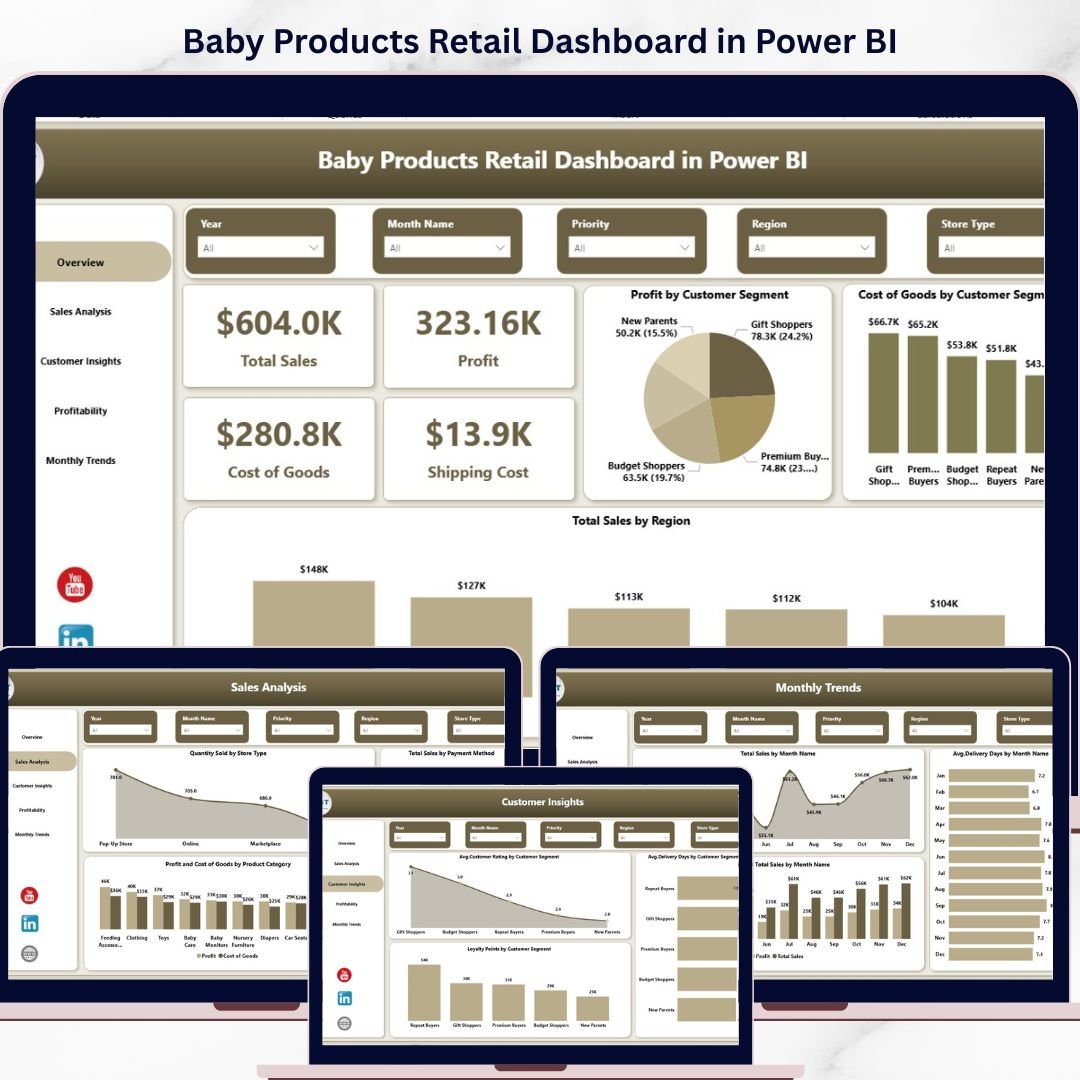
📂 What’s Inside the Baby Products Retail Dashboard in Power BI
This ready-to-use dashboard includes 5 powerful pages designed for complete business analysis:
📊 Overview Page – Snapshot of key KPIs like Total Sales, Profit, Cost of Goods, and Shipping Cost along with region and segment insights.
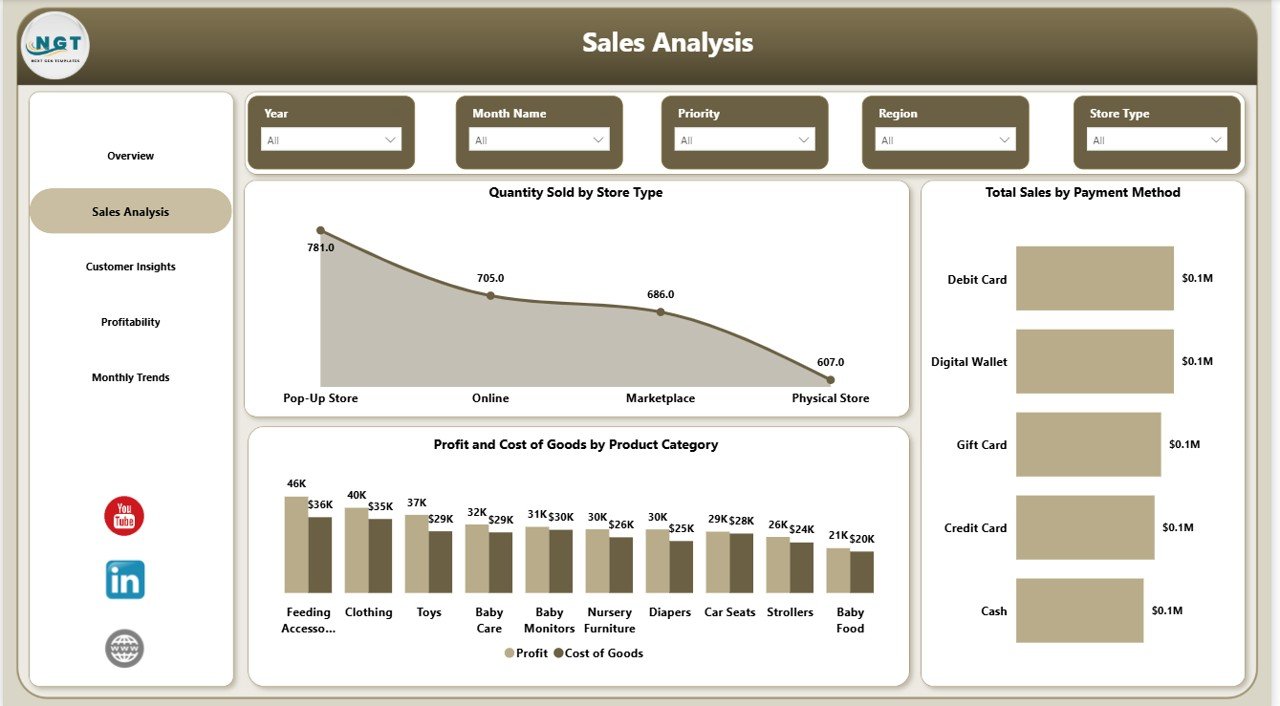
📈 Sales Analysis Page – Detailed analysis of quantity sold, payment methods, and product category performance.
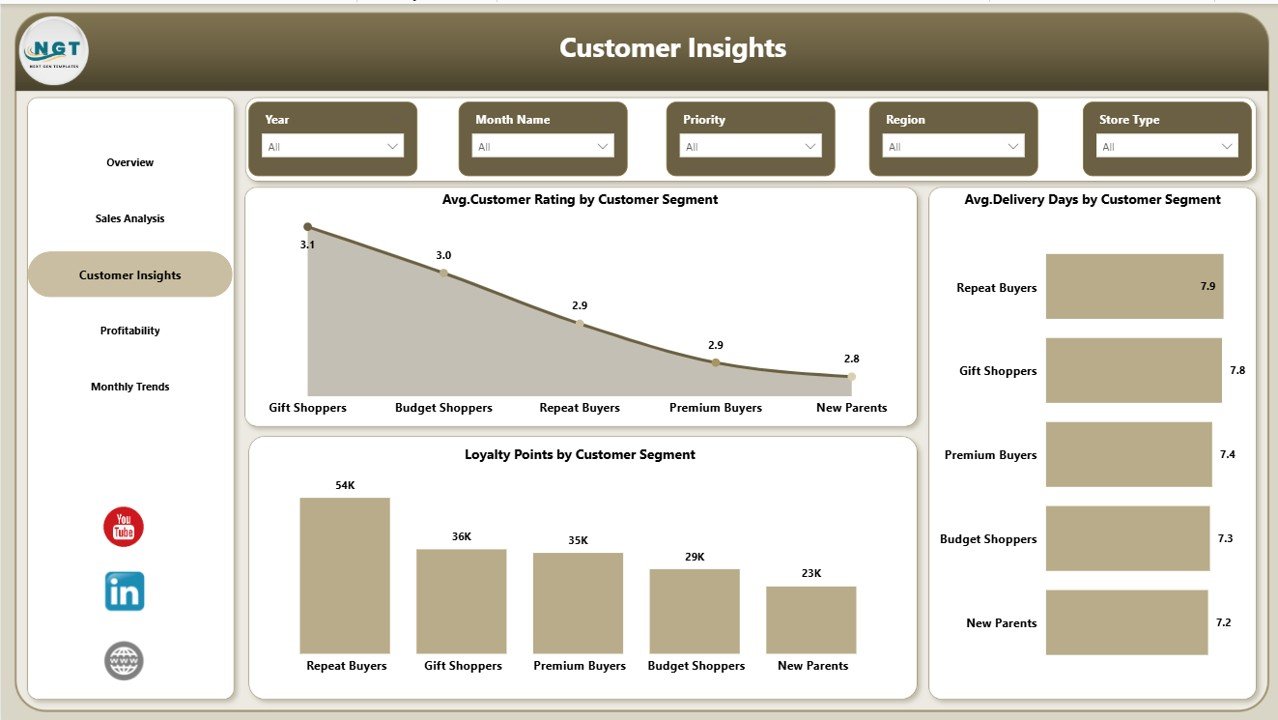
👶 Customer Insights Page – Understand customer ratings, delivery experience, and loyalty behavior.
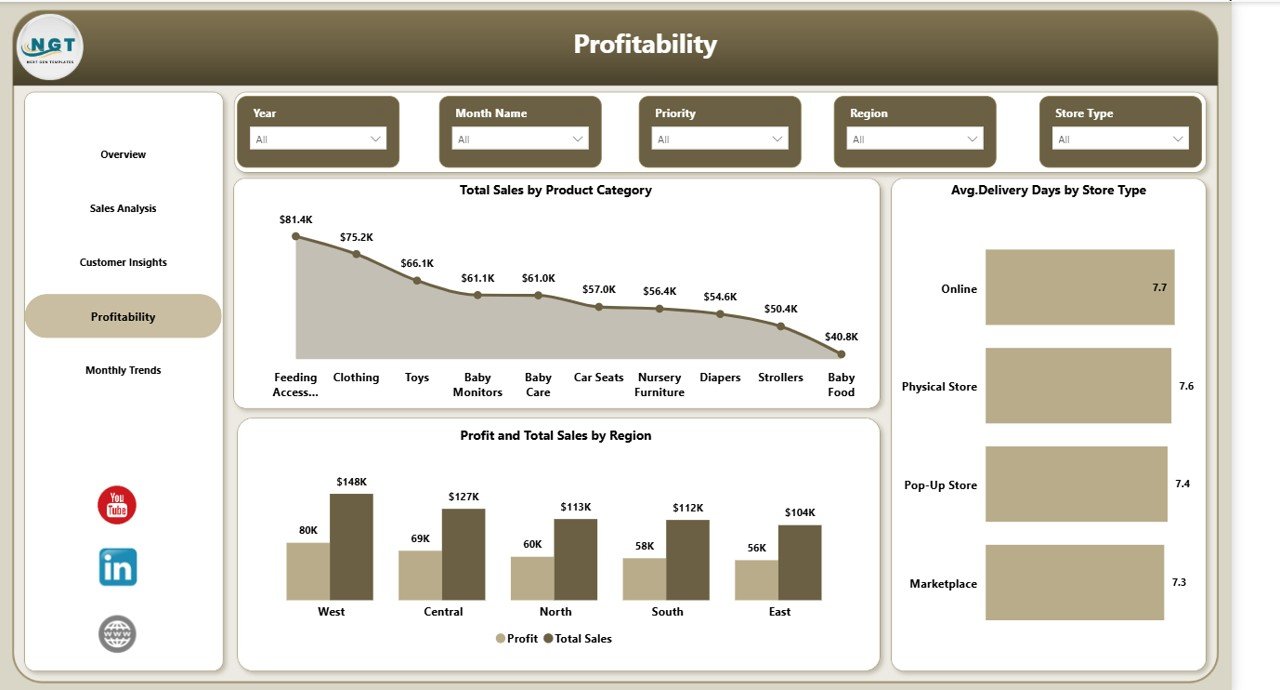
💰 Profitability Page – Identify profitable areas and optimize cost efficiency across regions and categories.
📅 Monthly Trend Page – Track sales, profit, and delivery trends over time to plan future strategies.
⚙️ How to Use the Baby Products Retail Dashboard in Power BI
Using this dashboard is simple and beginner-friendly:
1️⃣ Import your retail data into Power BI
2️⃣ Connect your data source with the dashboard
3️⃣ Refresh the data to update insights
4️⃣ Use slicers to filter and analyze specific data
5️⃣ Review charts and take data-driven decisions
👉 Within minutes, you can turn raw data into powerful business insights.
👨💼 Who Can Benefit from This Baby Products Retail Dashboard in Power BI
This dashboard is perfect for:
👶 Baby product retailers
🏬 Store managers
📊 Business analysts
🛒 E-commerce sellers
🚚 Supply chain managers
💡 If you deal with retail data, this dashboard will help you optimize performance and increase profitability.
💥 Why This Dashboard is a Game-Changer?
✔️ Eliminates manual reporting
✔️ Provides real-time insights
✔️ Improves decision-making speed
✔️ Helps identify growth opportunities
✔️ Enhances customer satisfaction
👉 In short, this dashboard gives you complete control over your retail business.
Click here to read the Detailed blog post
Watch the step-by-step video tutorial:


