

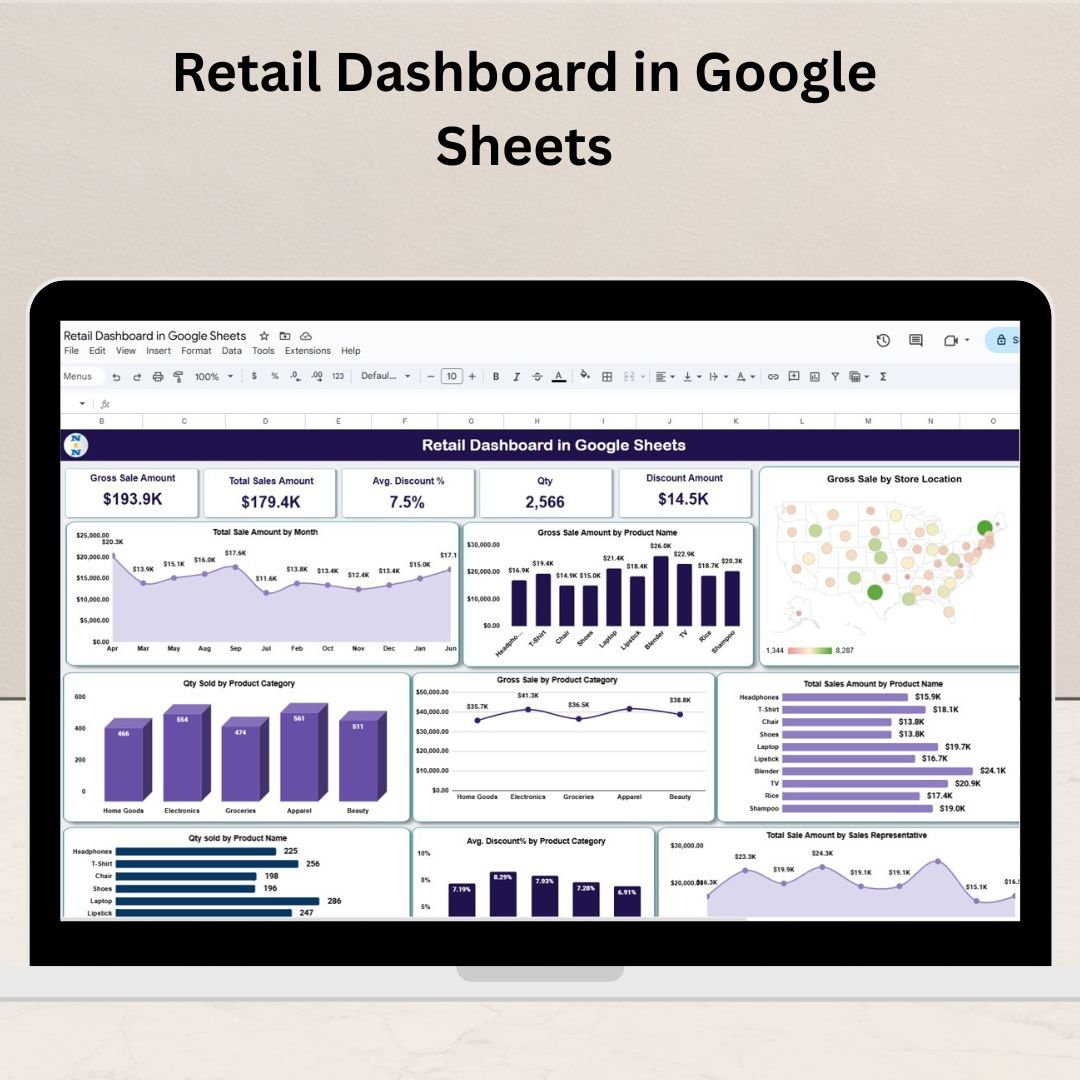


Managing a retail business means juggling multiple metrics every day—sales, discounts, inventory, and team performance. The Retail Dashboard in Google Sheets gives you a powerful, visual, and easy-to-use solution to monitor all these key performance indicators (KPIs) from one clean interface. Whether you’re a store owner, manager, or sales analyst, this dashboard helps you make faster, smarter decisions.
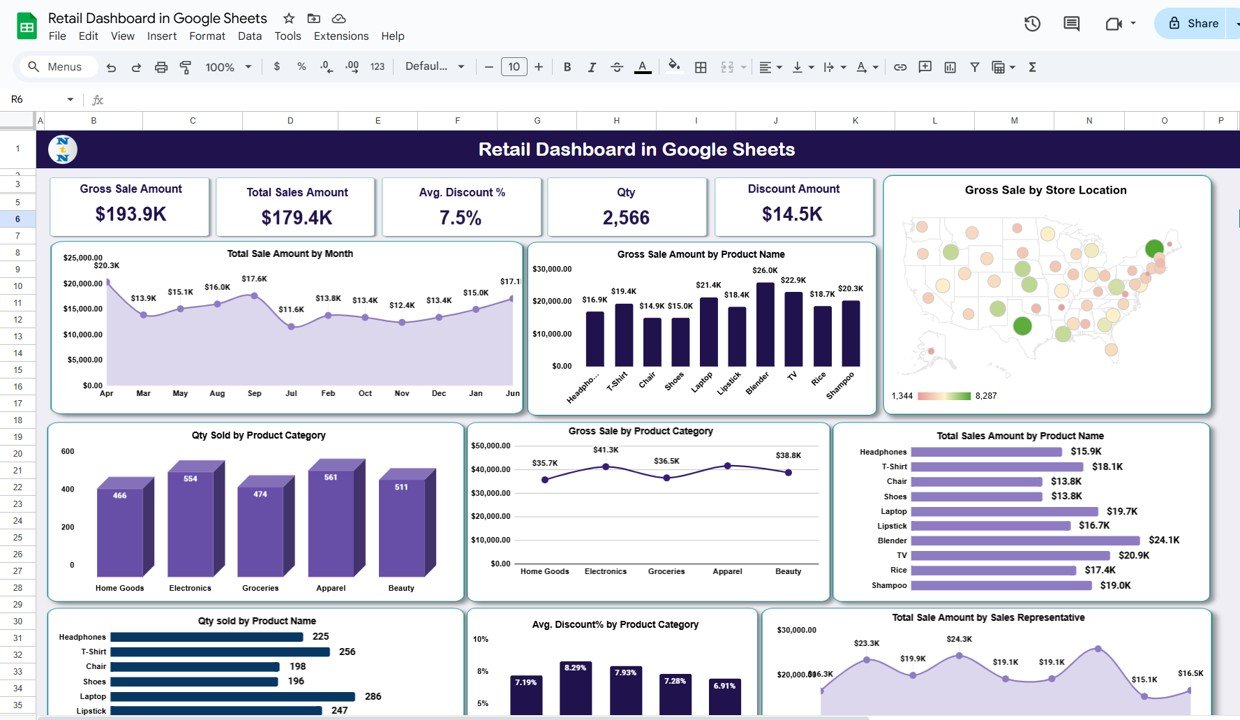
✨ Key Features of Retail Dashboard in Google Sheets
🔹 Interactive Dashboard Sheet:
- 5 KPI Cards: Gross Sale Amount, Total Sales Amount, Average Discount %, Quantity Sold, and Discount Amount.
- 10+ Dynamic Charts: Visual breakdowns by store location, month, product name, product category, and sales rep.
- Auto Updating Progress: Charts and cards refresh as you update your data.
📈 Visualizations That Drive Decisions:
- Gross Sale by Location
- Sales Amount by Month
- Qty Sold by Product Category
- Discount % by Product Category
- Sales Amount by Sales Rep and more!
📄 Data Sheet Tab:
- Easy data entry section for adding daily/monthly sales data
- Automatically feeds charts and KPIs with accurate data
📆 What’s Inside the Retail Dashboard
- Dashboard Sheet Tab: Real-time visual insights at a glance
- Data Sheet Tab: Raw data entry section for sales input
- Automated KPIs: Calculates Gross Sales, Total Sales, Discounts, and Quantity Sold
- Charts: Pre-built analytics covering locations, products, and team performance
- Customization Options: Add your own KPIs or modify visuals as needed
🔧 How to Use the Retail Dashboard in Google Sheets
- 📆 Input Sales Data: Head to the Data Sheet and enter sales transactions regularly.
- 🔄 Watch It Update: The dashboard updates all charts and KPI cards automatically.
- 📊 Analyze Trends: Use visual graphs to identify sales spikes, underperformers, and discount effectiveness.
- 💼 Share With Team: Share the file with your team to keep everyone aligned and data-driven.
🤝 Who Can Benefit from This Retail Dashboard?
- 💼 Store Managers: Get a snapshot of overall performance in seconds
- 🚗 Retail Business Owners: Make data-driven decisions to boost profits
- 🤵 Sales Executives: Track sales rep performance and product trends
- 📅 Franchise Owners: Compare store location performances with ease
- 🚀 Startups & Small Businesses: Begin data tracking without costly software
☑️ Click here to read the Detailed blog post
📽️ Visit our YouTube channel to learn step-by-step video tutorials
Watch the step-by-step video tutorial:
Compatibility and Requirements
- Works in Google Sheets with a free Google account and a web browser.
- The KPI cards and charts are built with standard Google Sheets features. Google explains charts in Add & edit a chart or graph.
Frequently Asked Questions
Which KPI cards are on the dashboard?
Gross Sale Amount, Total Sales Amount, Average Discount %, Quantity Sold and Discount Amount.
What do the charts break down?
Sales by store location, month, product name, product category and sales rep, with more than 10 charts in total.
Where do I enter my sales?
In the Data Sheet tab. It feeds every chart and KPI card.
Do the charts update by themselves?
Yes. When you add sales data, the charts and KPI cards refresh.
Can I add my own KPIs?
Yes. You can add KPIs or change the visuals as needed.
Related Retail Templates
- Retail Dashboard in Excel: the same topic in Excel
- Retail Dashboard in Power BI: the same topic in Power BI
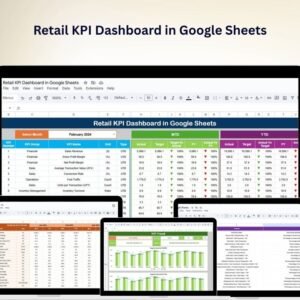
- Retail KPI Dashboard in Google Sheets: retail KPIs with targets
- Retail KPI Scorecard in Excel: a scorecard view of retail KPIs
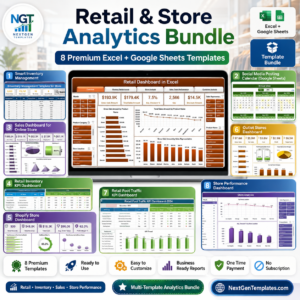
- Retail & Store Analytics Bundle: 8 retail templates in one download
Browse all Google Sheets dashboards or the Google Sheets sales and marketing templates.






Reviews
There are no reviews yet.