

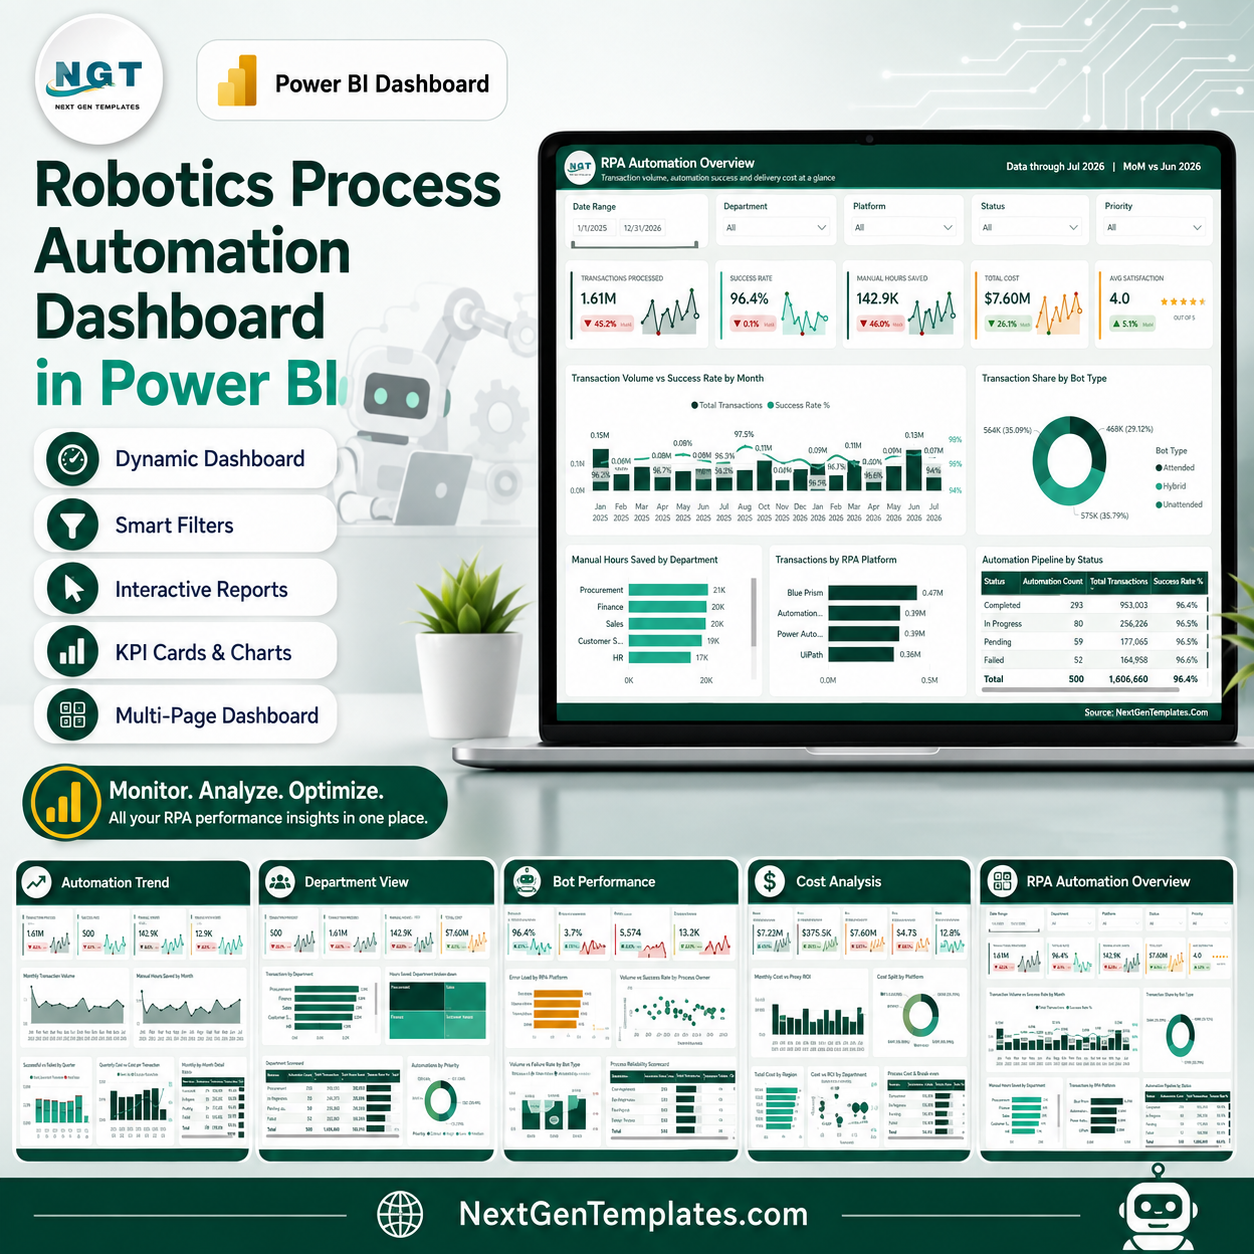
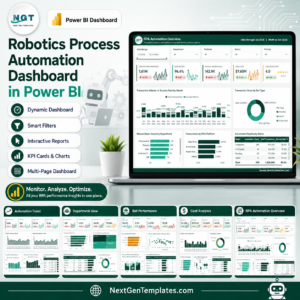
Robotics Process Automation Dashboard in Power BI gives automation leaders a ready-to-use reporting file for RPA transactions, success rate, manual hours saved, cost, satisfaction, bot performance, department usage, and ROI analysis. The report includes 5 Power BI pages, 5 executive KPI cards, more than 30 visual analysis points, and slicers for quick filtering. Built by PK for a 300K+ subscriber learning audience, this is a one-time $17.99 download with no recurring SaaS reporting fee and a clear manual-review workflow before you replace sample data with your own.
Key Features of Robotics Process Automation Dashboard in Power BI
- 5 report pages: Overview, Automation Trend, Department View, Bot Performance, and Cost Analysis.
- Executive KPI cards: Track Transactions Processed, Success Rate, Manual Hours Saved, Total Cost, and Avg Satisfaction.
- RPA performance visuals: Analyze monthly transactions, success rate, bot type share, department savings, RPA platforms, status, and cost.
- Multiple slicers: Filter dashboard pages by the available fields in the data model for quick review.
- Cost and ROI visibility: Compare total cost, cost per transaction, proxy ROI, and break-even by process.
- Editable Power BI structure: Customize visuals, measures, fields, colors, and source connections in Power BI Desktop.
What’s Inside the Robotics Process Automation Dashboard in Power BI
1. Overview Page
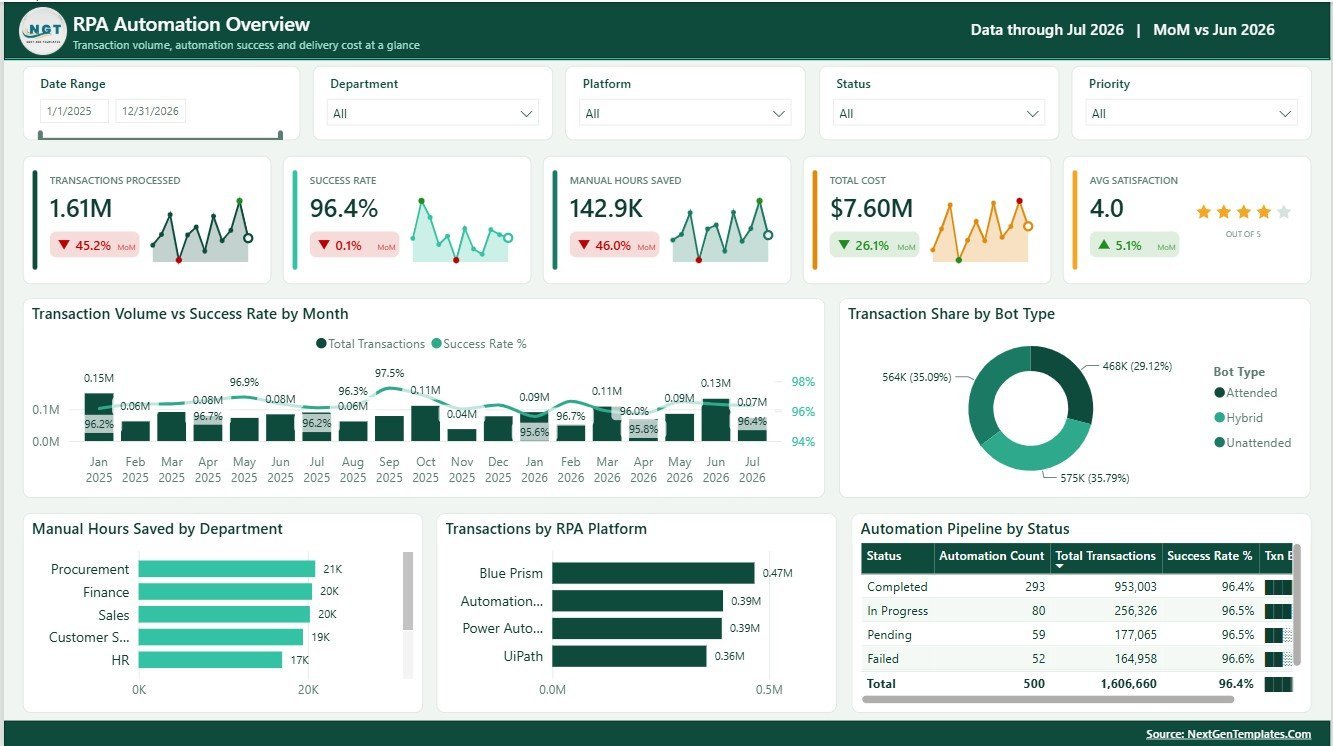
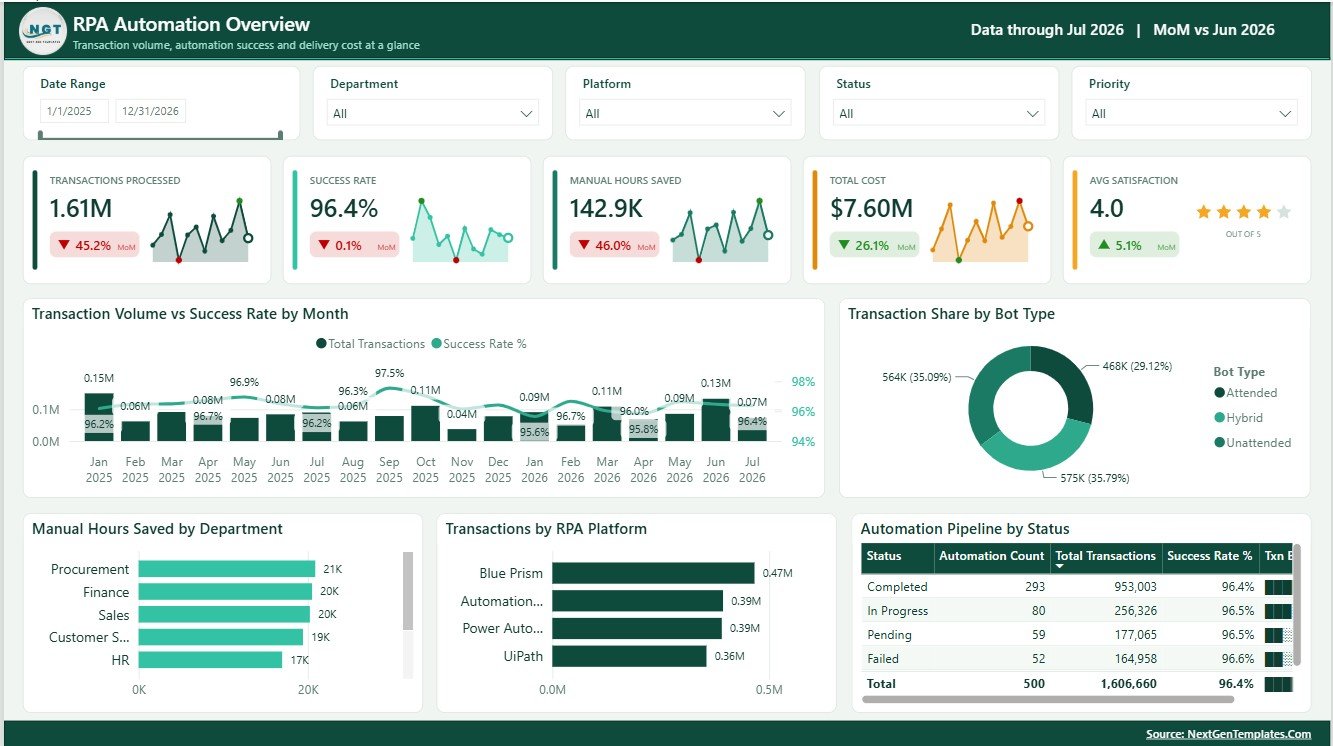
The Overview Page summarizes the RPA program at a leadership level. KPI cards show Transactions Processed, Success Rate, Manual Hours Saved, Total Cost, and Avg Satisfaction, while the visuals explain volume, savings, status, platform usage, and bot type mix.
Transaction Volume and Success Rate by Month: This chart compares monthly automation volume with reliability. It helps teams see whether growing transaction load is also maintaining a healthy success rate.
Transaction Share by Bot Type: This visual shows how total transactions are distributed across bot categories. It helps compare attended, unattended, API, desktop, or other bot types in the RPA portfolio.
Manual Hours Saved by Department: This chart ranks departments by time saved from automation. It helps prove where RPA is removing manual effort and where more automation opportunities may exist.
Transactions by RPA Platform: This chart compares transaction volume across platforms. It helps IT and automation teams understand which RPA platform carries the largest workload.
Automation Count by Status: This visual shows how many automations sit in each lifecycle status. It is useful for reviewing active, planned, paused, completed, or issue-heavy automations.
Total Transactions by Status: This chart links transaction volume to automation status. It helps identify whether the biggest workloads are coming from stable or at-risk processes.
Success Rate by Status: This chart compares reliability by status group. It highlights whether paused, active, or under-review automations are affecting overall quality.
2. Automation Trend
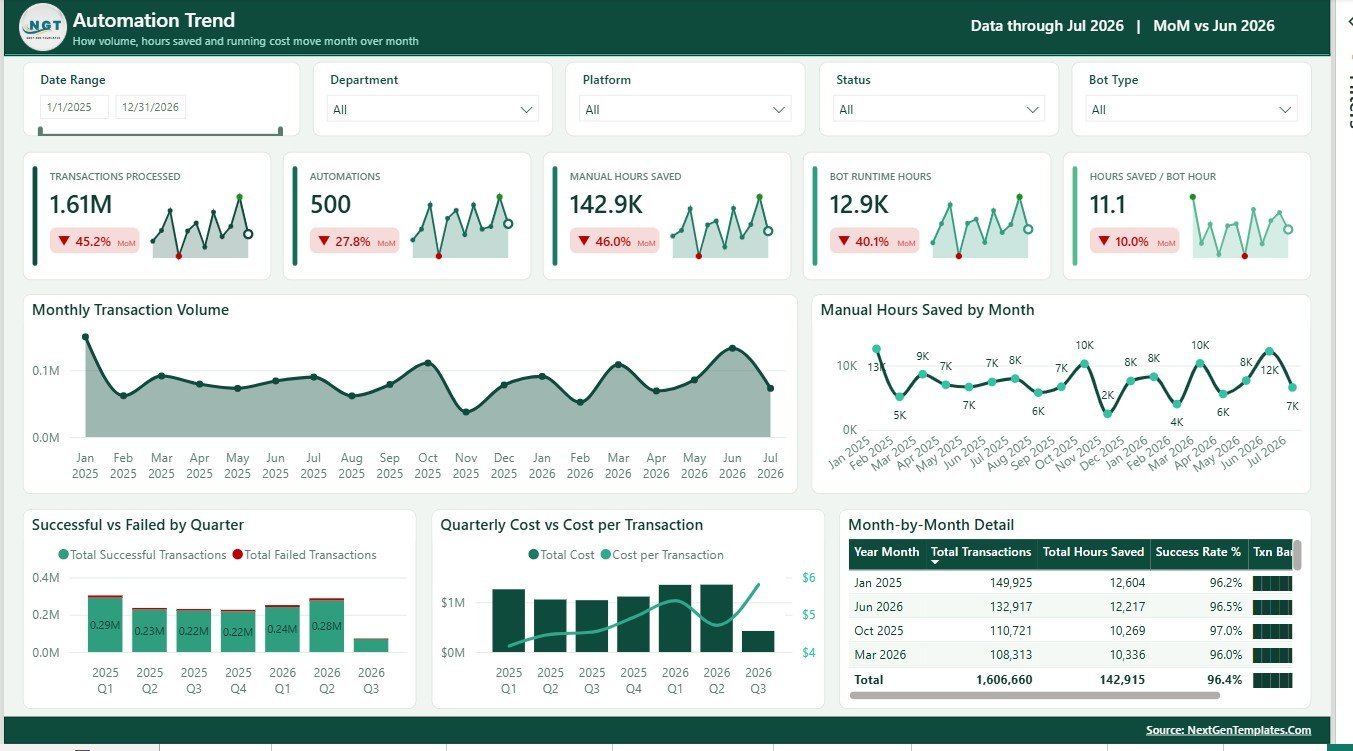
The Automation Trend page focuses on time-series movement across months and quarters. It helps users review transaction growth, success rate, failures, cost, and manual hours saved over time.
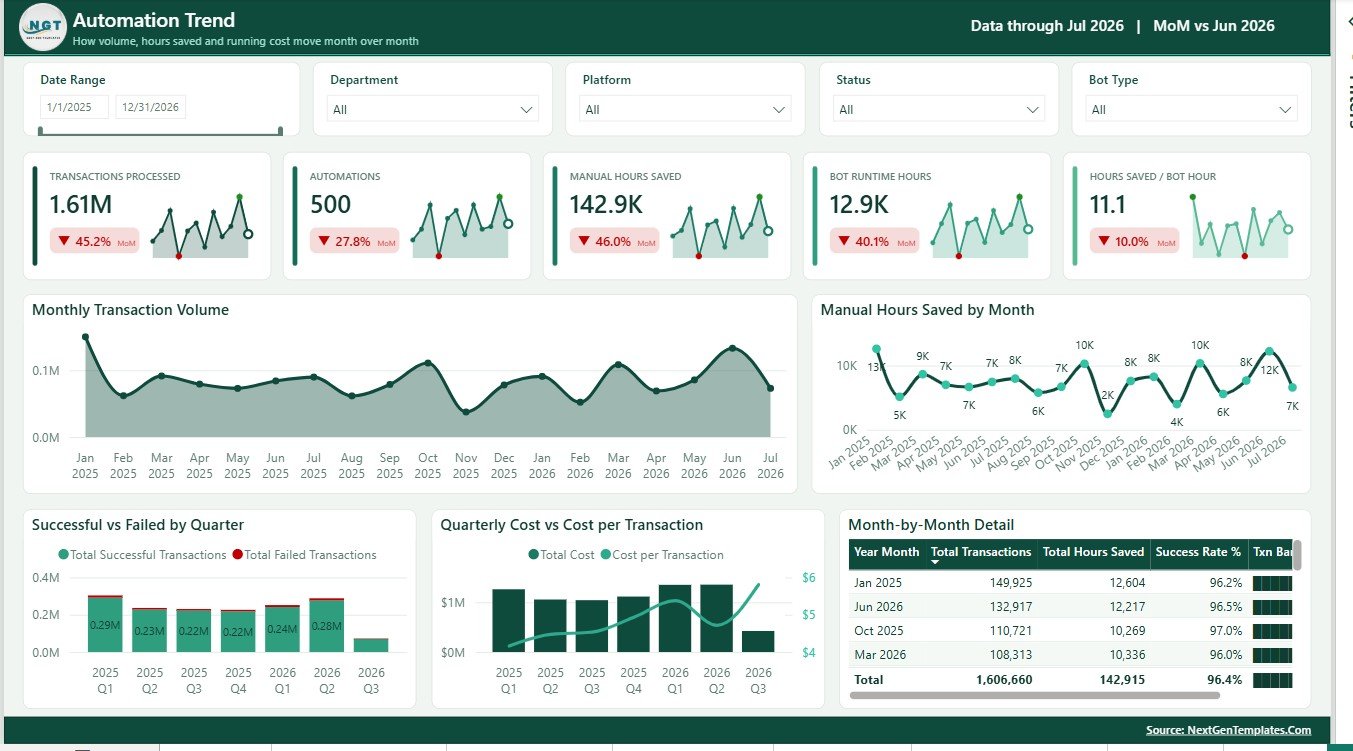
The page includes Monthly Transaction Volume by Month, Manual Hours Saved by Month, Successful Transactions and Failed Transactions by Quarter, Total Cost and Cost per Transaction by Quarter, Total Transactions by Month, Total Hours Saved by Month, and Success Rate by Month.
3. Department View
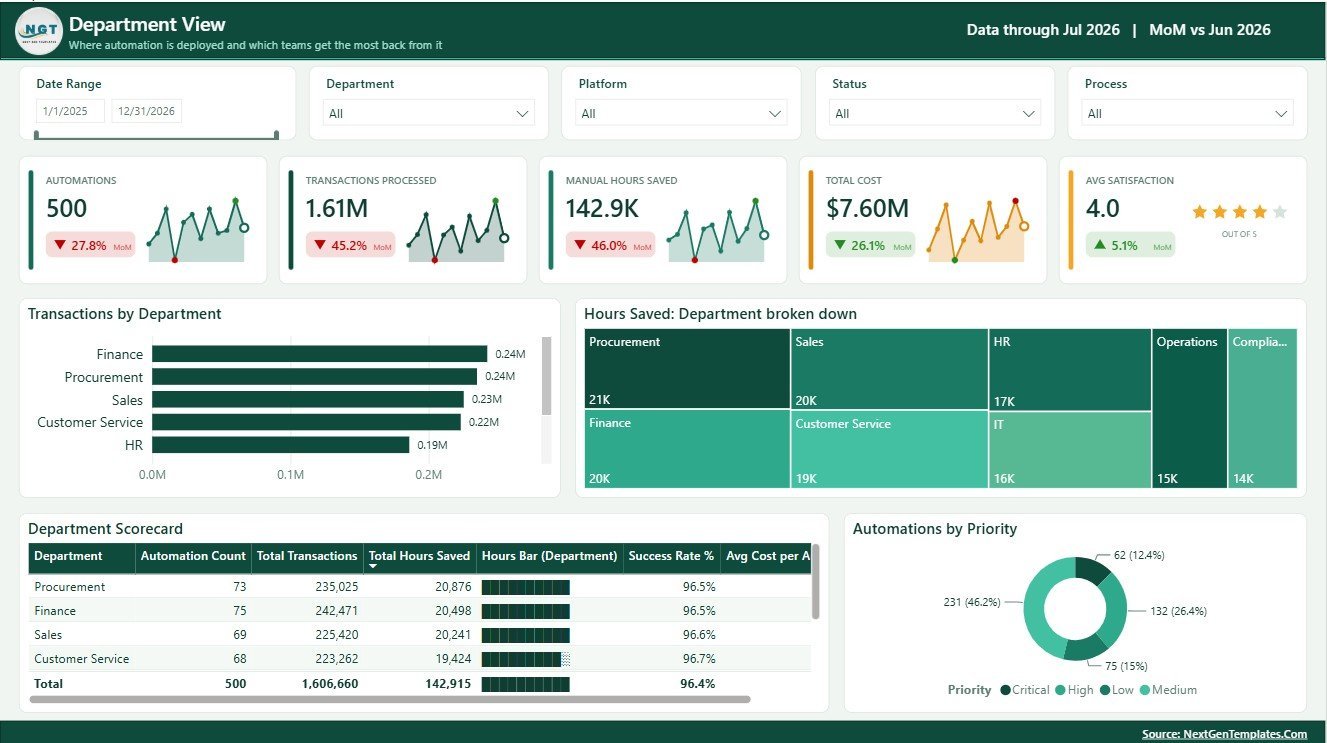
The Department View page compares automation performance across departments and priority levels. It helps business unit leaders understand workload, savings, cost per automation, count of automations, and success rate.
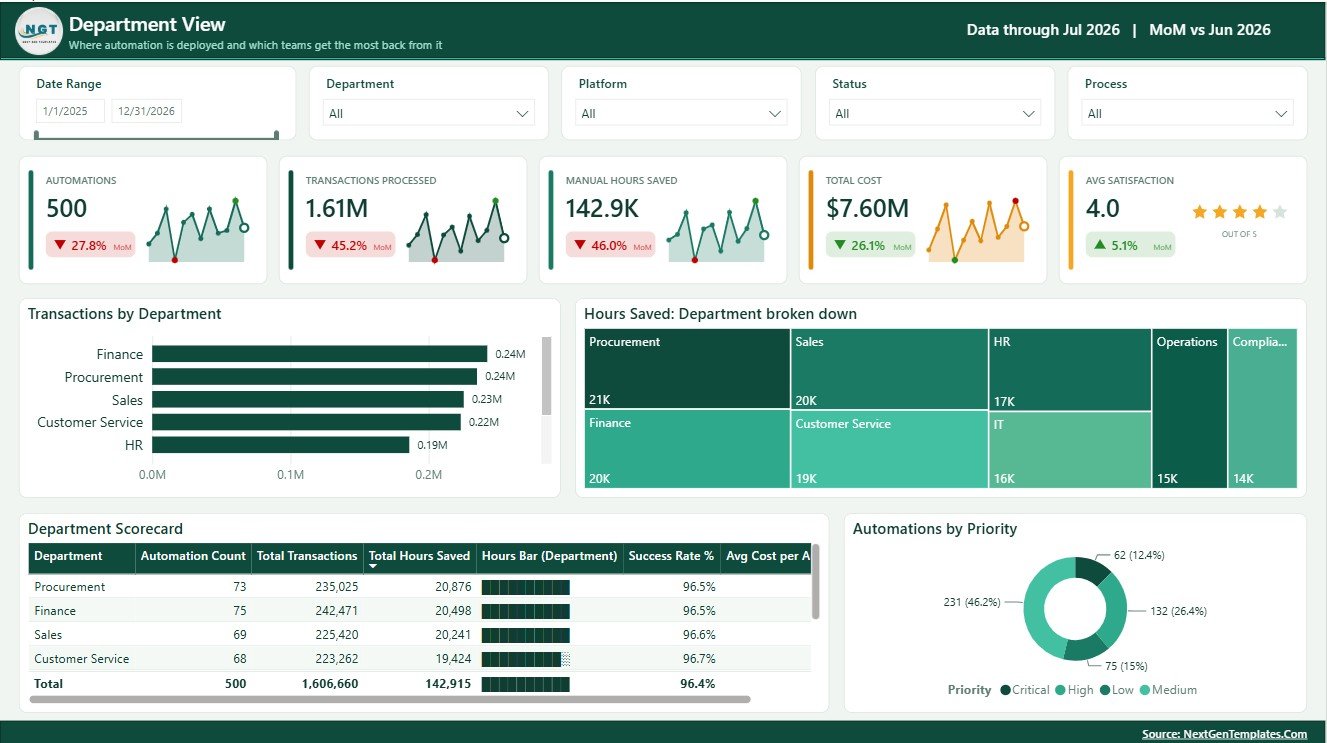
The page includes Transactions by Department, Manual Hours Saved by Department, Automation Count by Department, Total Transactions by Department, Total Hours Saved by Department, Success Rate by Department, Avg Cost per Automation by Department, and Automations by Priority.
4. Bot Performance
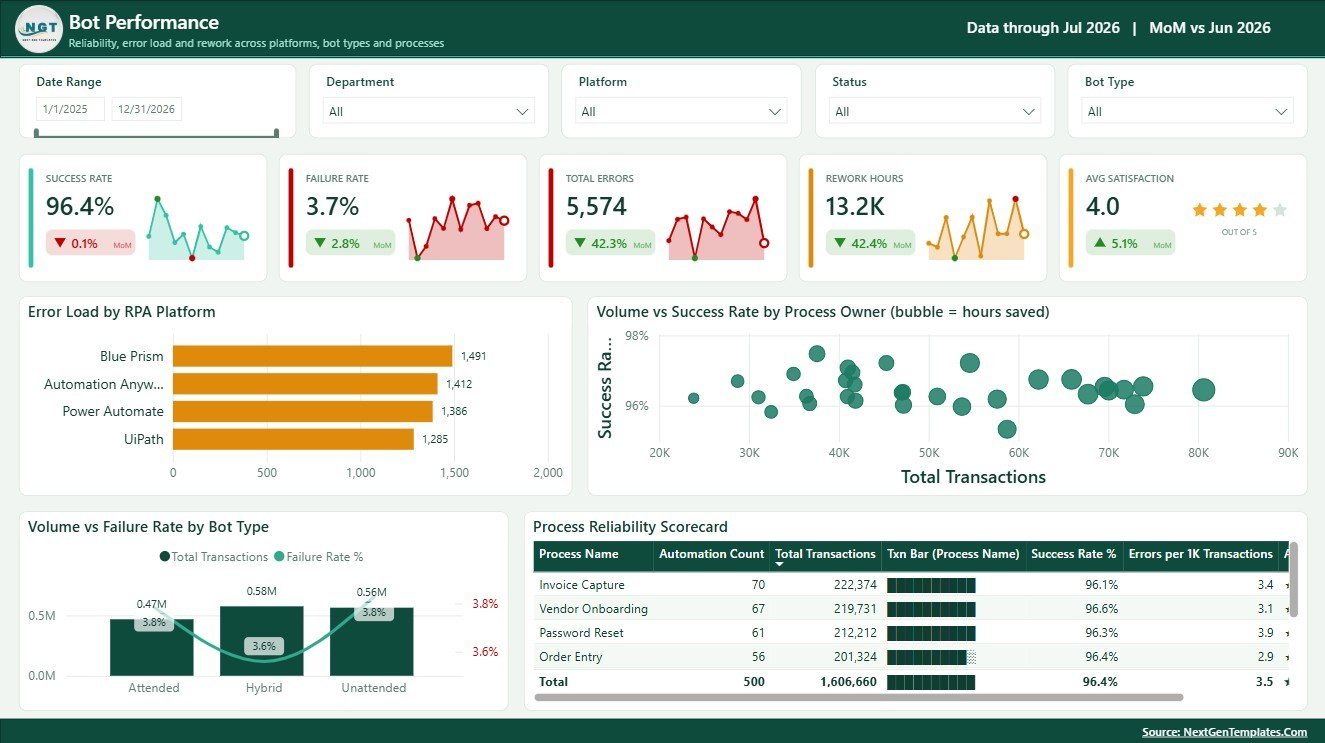
The Bot Performance page is built for RPA support teams and process owners. It highlights platform error load, process owner performance, bot type failure rate, process-level success rate, and errors per 1K transactions.
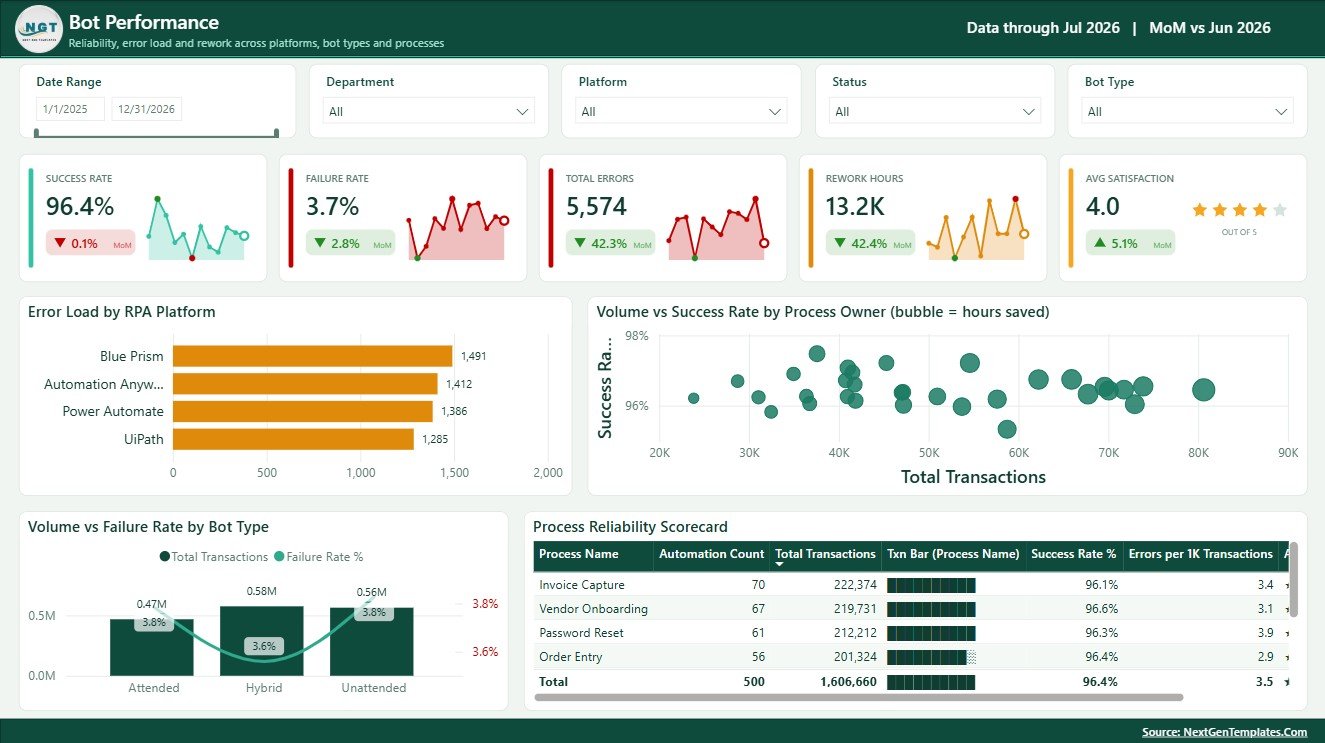
The page includes Error Load by RPA Platform, Success Rate by Process Owner, Total Transactions by Process Owner, Failure Rate by Bot Type, Total Transactions by Bot Type, Success Rate by Process Name, and Errors per 1K Transactions by Process Name.
5. Cost Analysis
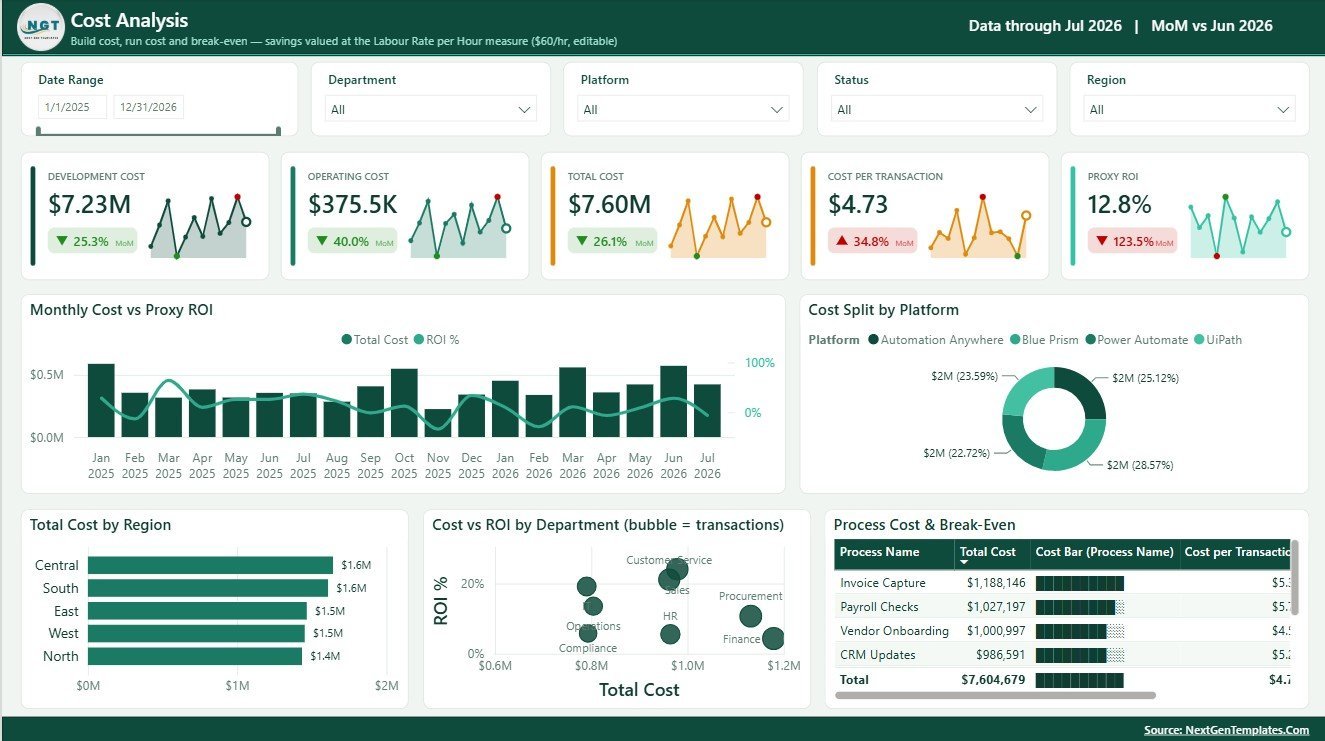
The Cost Analysis page connects RPA spending with return indicators. It helps finance, IT, and automation stakeholders compare total cost, cost per transaction, proxy ROI, department cost, platform split, regional cost, and process break-even.
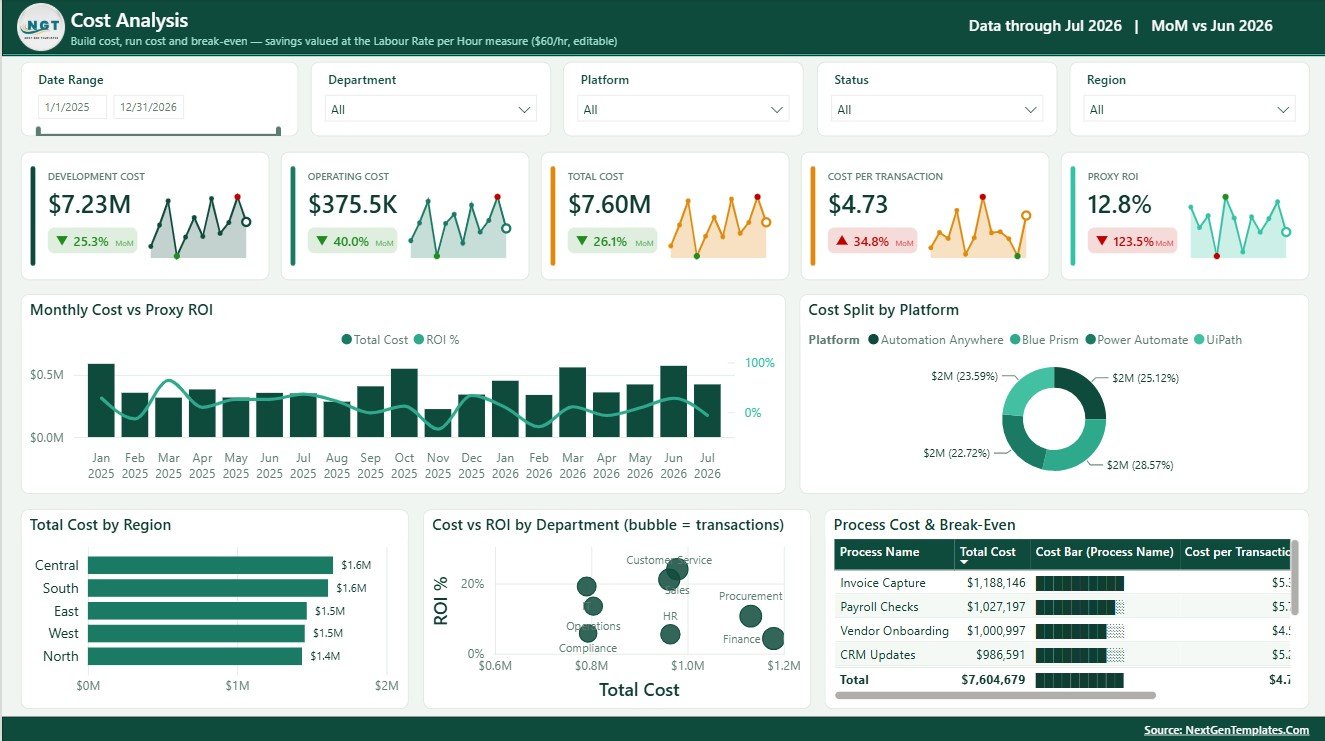
The page includes Total Cost and Proxy ROI by Month, Cost Split by Platform, Total Cost by Region, Cost and ROI by Department, Total Cost by Process Name, Cost per Transaction by Process Name, and Break-Even by Process Name.
Robotics Process Automation Dashboard in Power BI vs. Tableau vs. Paid RPA/SaaS – Where This Fits
| Feature | This Power BI dashboard | Tableau alternative | Paid RPA/SaaS analytics |
|---|---|---|---|
| Cost | $17.99 one-time sale price | Requires Tableau access and build time | Recurring subscription or enterprise contract |
| Platform | Power BI Desktop and Power BI Service | Tableau Desktop/Cloud | Vendor cloud platform |
| Setup time | Download, review model, replace data source | Build visuals and calculations | Implementation and configuration |
| Real-time team collaboration | Available through Power BI Service | Available through Tableau Cloud | Usually role-based |
| Customizable fields | Editable measures, visuals, model, and filters | Editable with Tableau skills | Limited by vendor settings |
| Share with link | Available through Power BI publishing | Available through Tableau sharing | Login controlled |
| Year-1 cost at 5 users | $17.99 template plus Power BI access | Software plus build effort | Often much higher with licenses |
| RPA reporting fit | Best for reusable RPA analytics and executive reporting | Best for teams already standardized on Tableau | Best for live orchestration and enterprise monitoring |
Who This Template Is For – and Who It’s Not For
This template is for RPA managers, automation center-of-excellence teams, IT operations leaders, finance transformation teams, shared services managers, consultants, and process owners who need a reusable Power BI report for automation outcomes.
It is not a bot orchestrator, process mining platform, queue controller, workflow builder, or replacement for UiPath, Automation Anywhere, Power Automate, Blue Prism, or enterprise monitoring tools. Use it when your RPA data can be connected to or loaded into Power BI.
How to Use the Robotics Process Automation Dashboard in Power BI
- Download and unzip the product package.
- Open the PBIX file in Power BI Desktop.
- Review the sample model, pages, cards, slicers, and visuals.
- Replace or connect your own RPA data source.
- Refresh the report and verify measures such as success rate, cost per transaction, and hours saved.
- Customize visuals, colors, fields, and slicers as needed.
- Publish to Power BI Service if you want to share it with your team.
Real-World Use Cases
Anika, RPA program manager: reviews transactions, success rate, and hours saved before the monthly automation governance meeting.
Rohit, automation support lead: uses Bot Performance to identify platforms, owners, bot types, and processes with high error concentration.
Meera, finance transformation analyst: uses Cost Analysis to compare total cost, cost per transaction, proxy ROI, and break-even across automation processes.
Frequently Asked Questions
What is included in the Robotics Process Automation Dashboard in Power BI?
The file includes 5 report pages: Overview, Automation Trend, Department View, Bot Performance, and Cost Analysis.
Can I connect my own RPA data?
Yes. You can replace or connect your own RPA source data in Power BI Desktop and refresh the report.
Does this dashboard run RPA bots?
No. It is a reporting dashboard, not a bot runner or orchestration platform.
Can I customize the dashboard?
Yes. You can edit visuals, measures, slicers, fields, colors, and model relationships if you are comfortable with Power BI.
Do I need Power BI Desktop?
Yes. Open the PBIX file in Power BI Desktop, which is available from Microsoft.
Can I publish it to Power BI Service?
Yes, if you have the right Microsoft Power BI account and sharing permissions.
About the Author
Built by PK – Microsoft Certified Professional with 15+ years of Excel, Google Sheets, and Power BI experience. Founder of NextGenTemplates, reaching 300K+ subscribers across YouTube channels. Every template is hand-built and tested before release.
Explore Related Templates
- Robotics Process Automation Dashboard in Excel
- Robotics Industry KPI Dashboard in Power BI
- Neural Tech Startups Dashboard in Power BI
- Power BI templates
- Power BI dashboard templates
Download the Robotics Process Automation Dashboard in Power BI to turn transactions, bot performance, costs, savings, errors, departments, and ROI indicators into a clear Power BI reporting experience.
Last updated: August 7, 2026.
















Reviews
There are no reviews yet.