

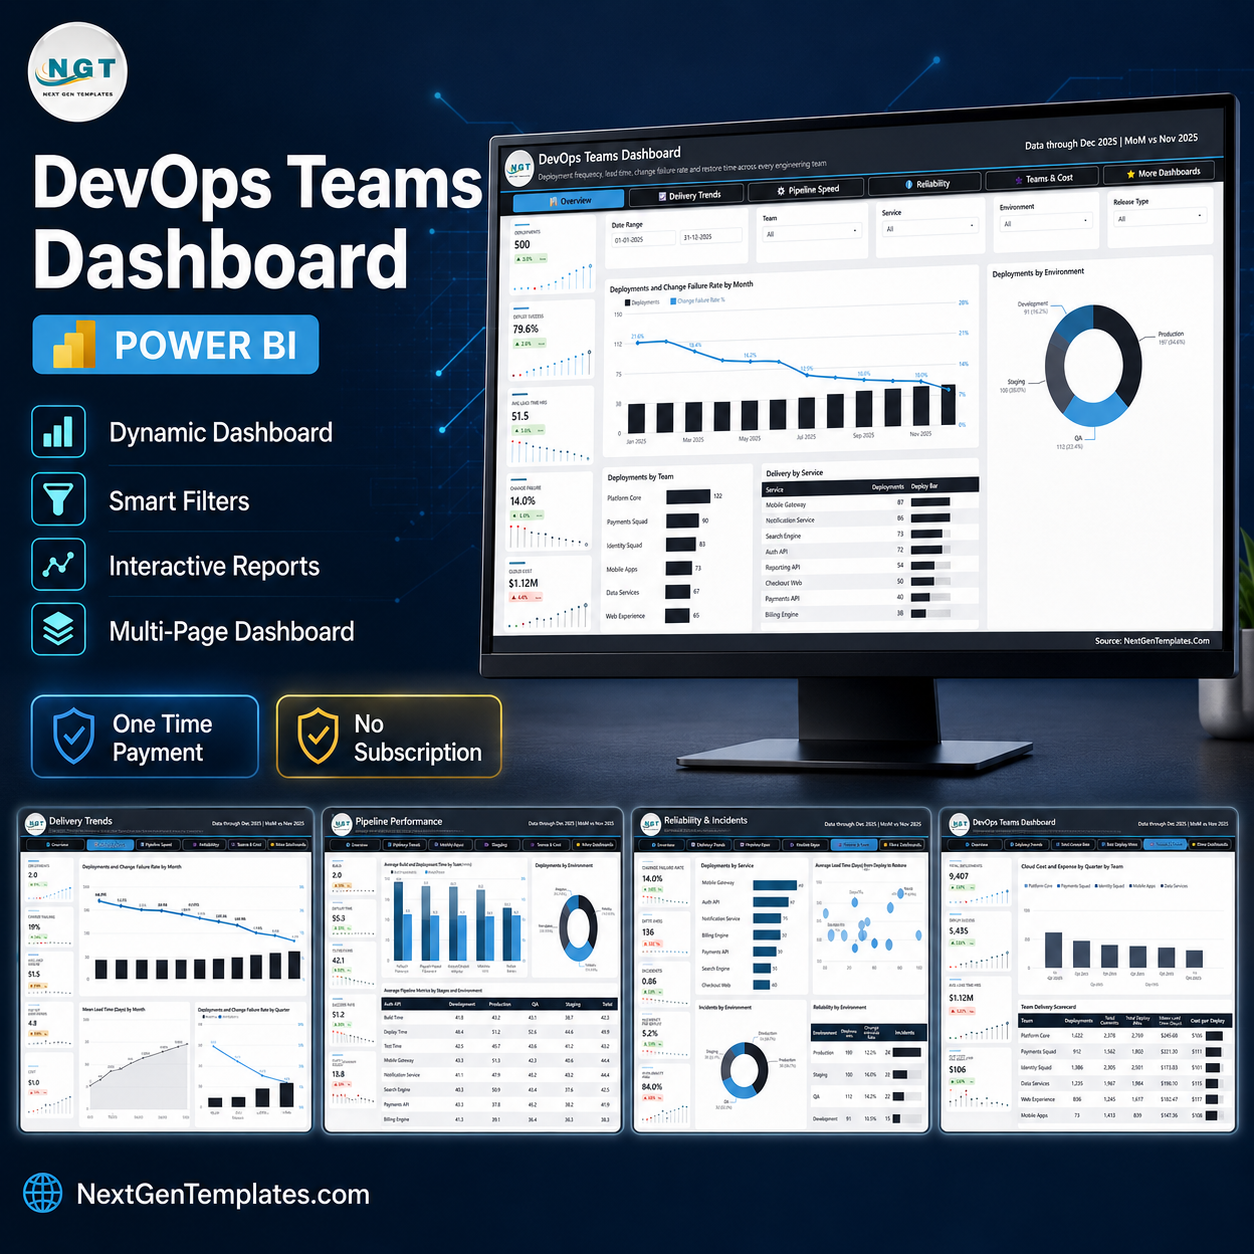

DevOps Teams Dashboard in Power BI is a ready-to-open .pbix report that turns a flat table of deployment records into five linked analysis pages. The sample model carries 500 deployments across 6 engineering teams, 8 services and 4 environments, with 80+ DAX measures already written. Out of the box it reports 500 deployments, 79.6% deploy success, a 51.5-hour average lead time, a 14.0% change failure rate and $1.12M of cloud cost. Built by a Microsoft Certified Professional and downloaded by engineering teams worldwide. One-time payment, no subscription, instant download after checkout.
Key Features of DevOps Teams Dashboard in Power BI
- Five analysis pages, not one crowded canvas. Overview, Delivery Trends, Pipeline Performance, Reliability & Incidents, and Teams & Cost, plus a hidden row-level Details page wired for drillthrough.
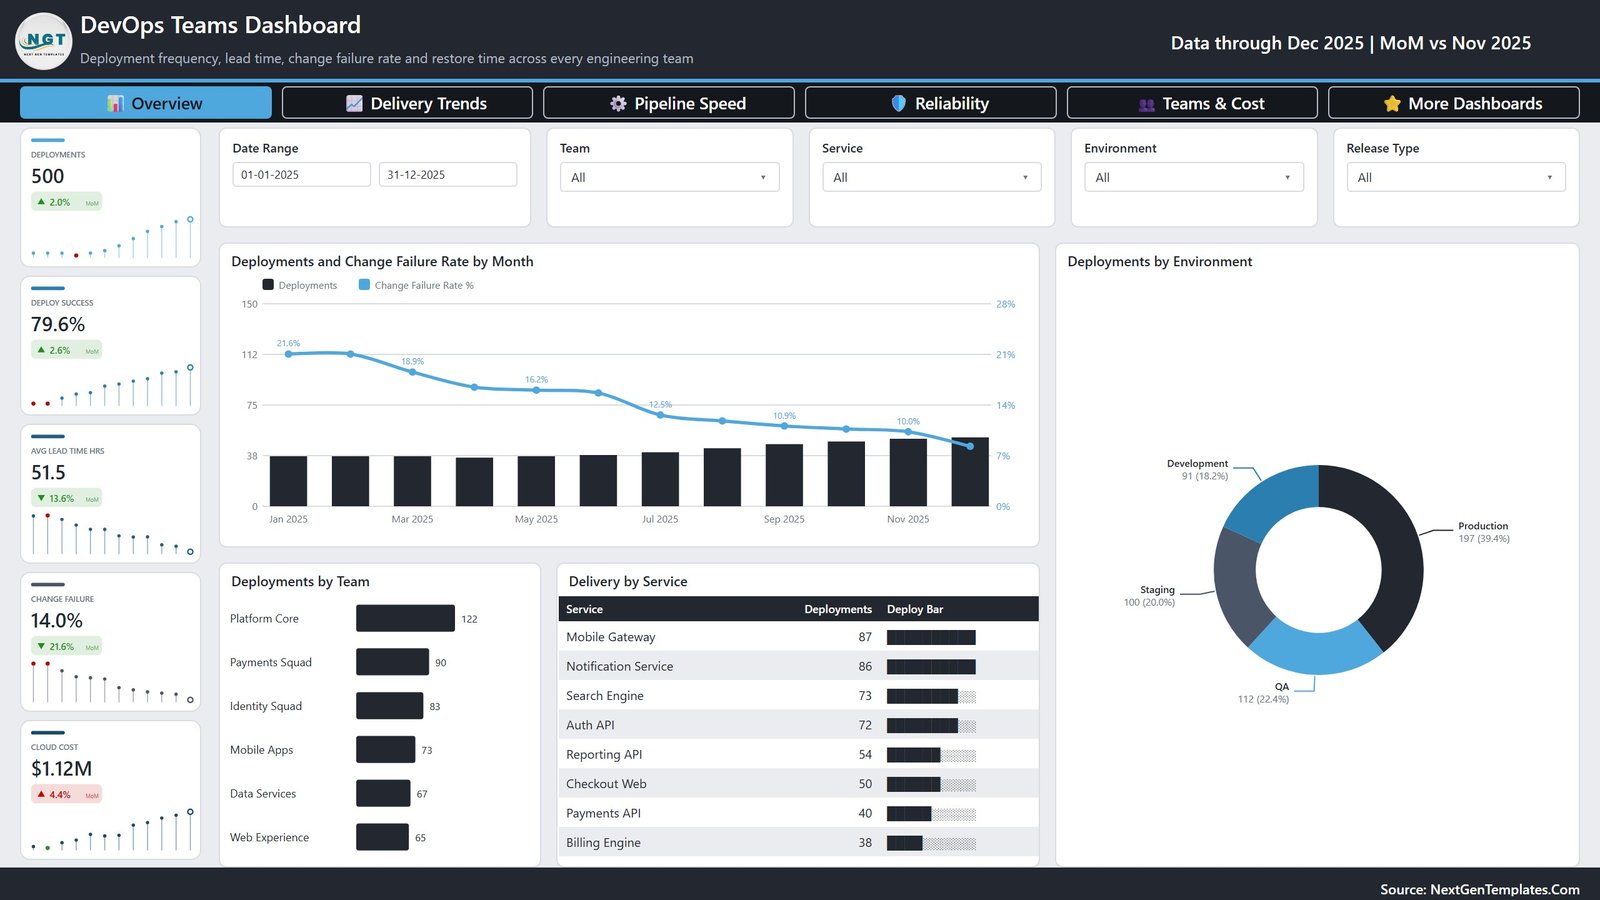
- Twenty-five KPI cards. Every page carries its own five-card rail with a sparkline and a month-on-month delta, so the Overview reads 500 Deployments and 14.0% Change Failure while Pipeline Performance reads 25.8 Avg Build Mins and 42.1 Avg Pipeline Mins.
- The four delivery metrics engineering leaders get asked for. Deploys Per Day (2.0), Avg Lead Time Hrs (51.5), Change Failure (14.0%) and Mean Restore Hrs (0.88) – the DORA-style set, named the way the report labels them.
- Synced slicers on every page. Date Range, Team, Service and Environment follow you across all five pages; each page then adds one filter of its own – Release Type, Deployment Method, Priority or Cloud Region.
- Trend, not just a total. Change failure rate falls from 21.6% in January to under 10% by December on the monthly combo chart, and from 20.7% to 9.4% across the four quarters.
- Cost tied to output. Teams & Cost reports 9,407 code commits, 5,425 story points, $1.12M cloud cost and a $206 cost per story point, with a per-team scorecard underneath.
- Editable everything. No locked visuals, no external image dependencies, no third-party custom visuals to license. Change a colour, a measure or a whole page and it stays changed.
- Commercial licence included. Use it in client work and rebrand it as your own.
What’s Inside the DevOps Teams Dashboard in Power BI
The download is a single ZIP holding the .pbix file, the Data.xlsx sample workbook it reads, and a Power BI user manual PDF. Open the .pbix in the free Power BI Desktop and every page is already populated.
Overview pairs a Deployments and Change Failure Rate by Month combo chart with a Deployments by Environment donut – Production 197, QA 112, Staging 100, Development 91 – then a Deployments by Team bar chart running from Platform Core at 122 down to Web Experience at 65, and a Delivery by Service table led by Mobile Gateway at 87.
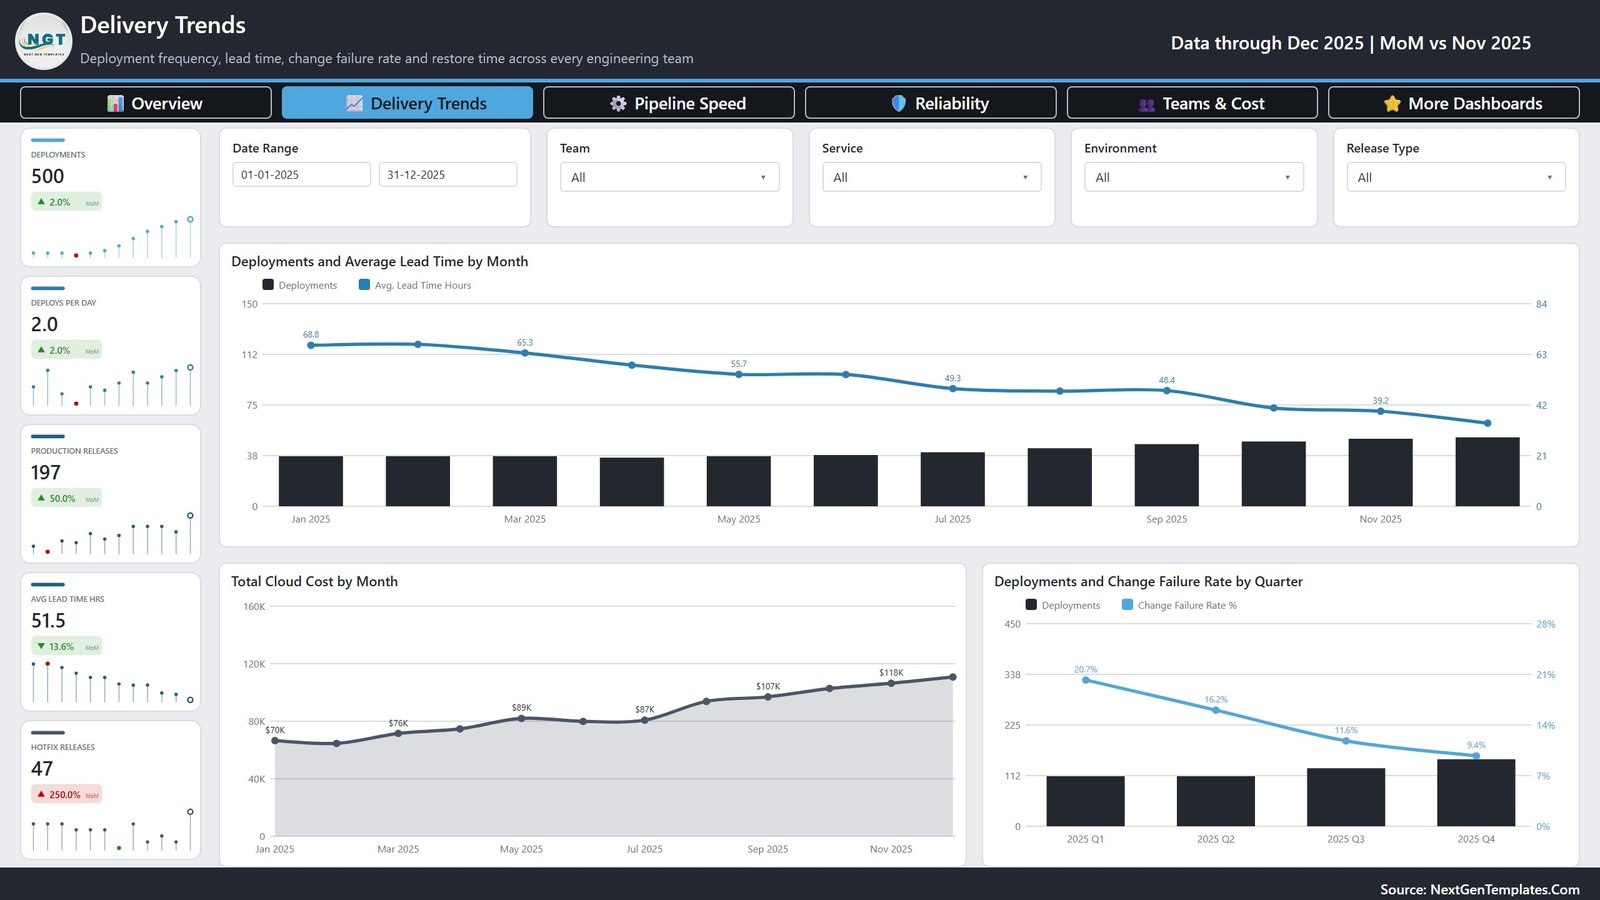
Delivery Trends plots Deployments and Average Lead Time by Month, Total Cloud Cost by Month rising from $70K to $118K, and Deployments and Change Failure Rate by Quarter. Its own cards add Deploys Per Day, Production Releases (197) and Hotfix Releases (47).
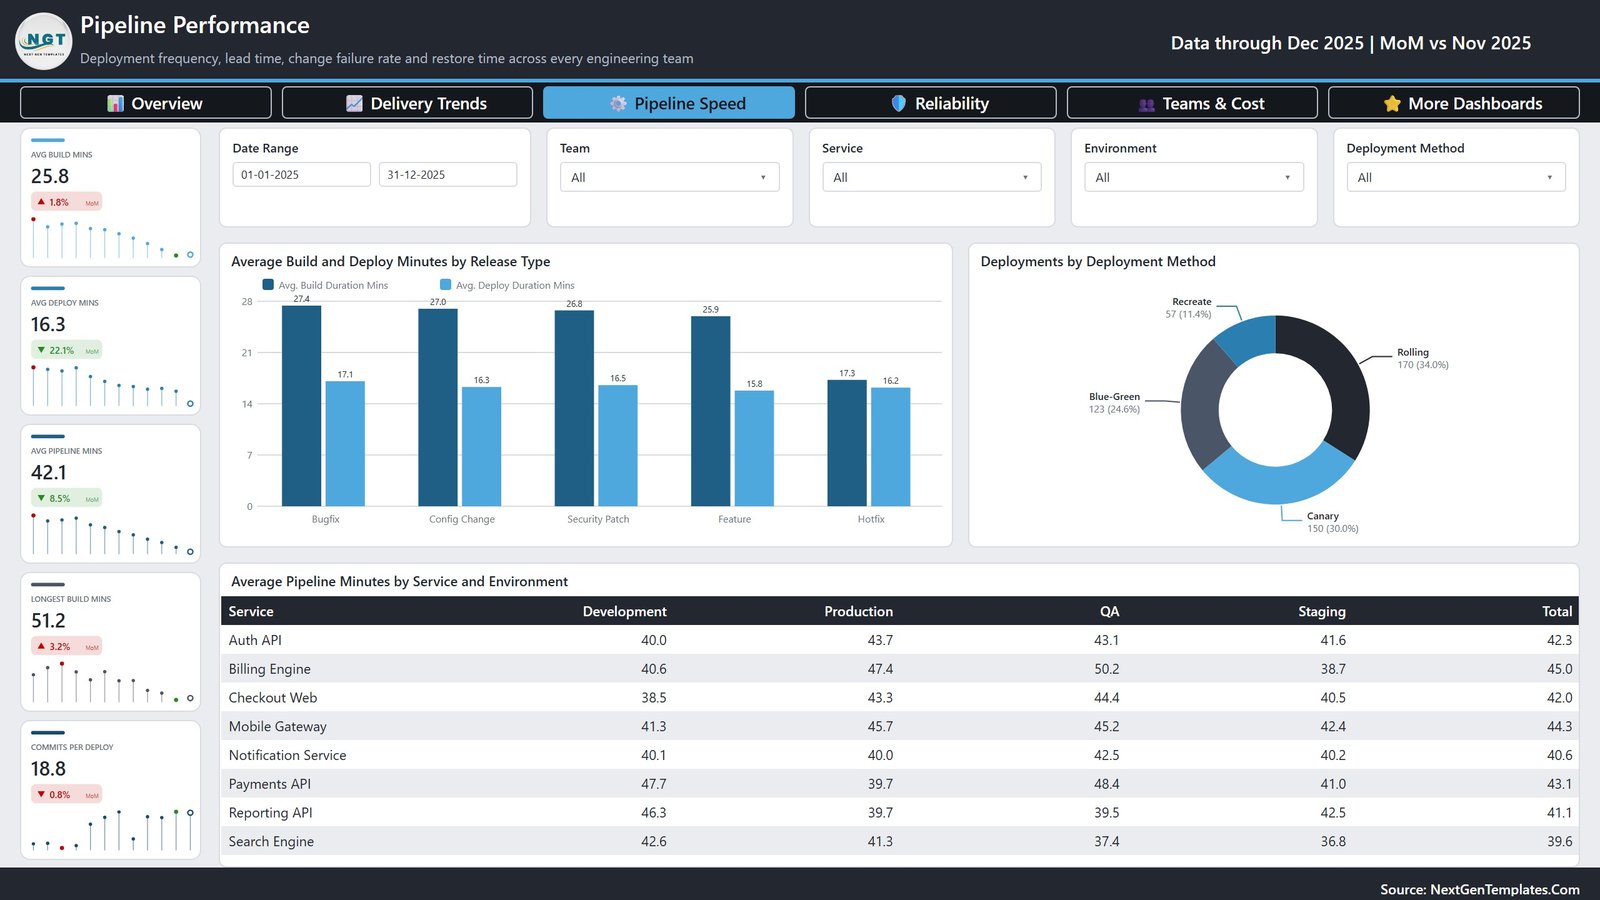
Pipeline Performance compares Average Build and Deploy Minutes by Release Type – Bugfix at 27.4 build minutes against Hotfix at 17.3 – shows Deployments by Deployment Method (Rolling 170, Canary 150, Blue-Green 123, Recreate 57), and ends on an Average Pipeline Minutes by Service and Environment matrix.
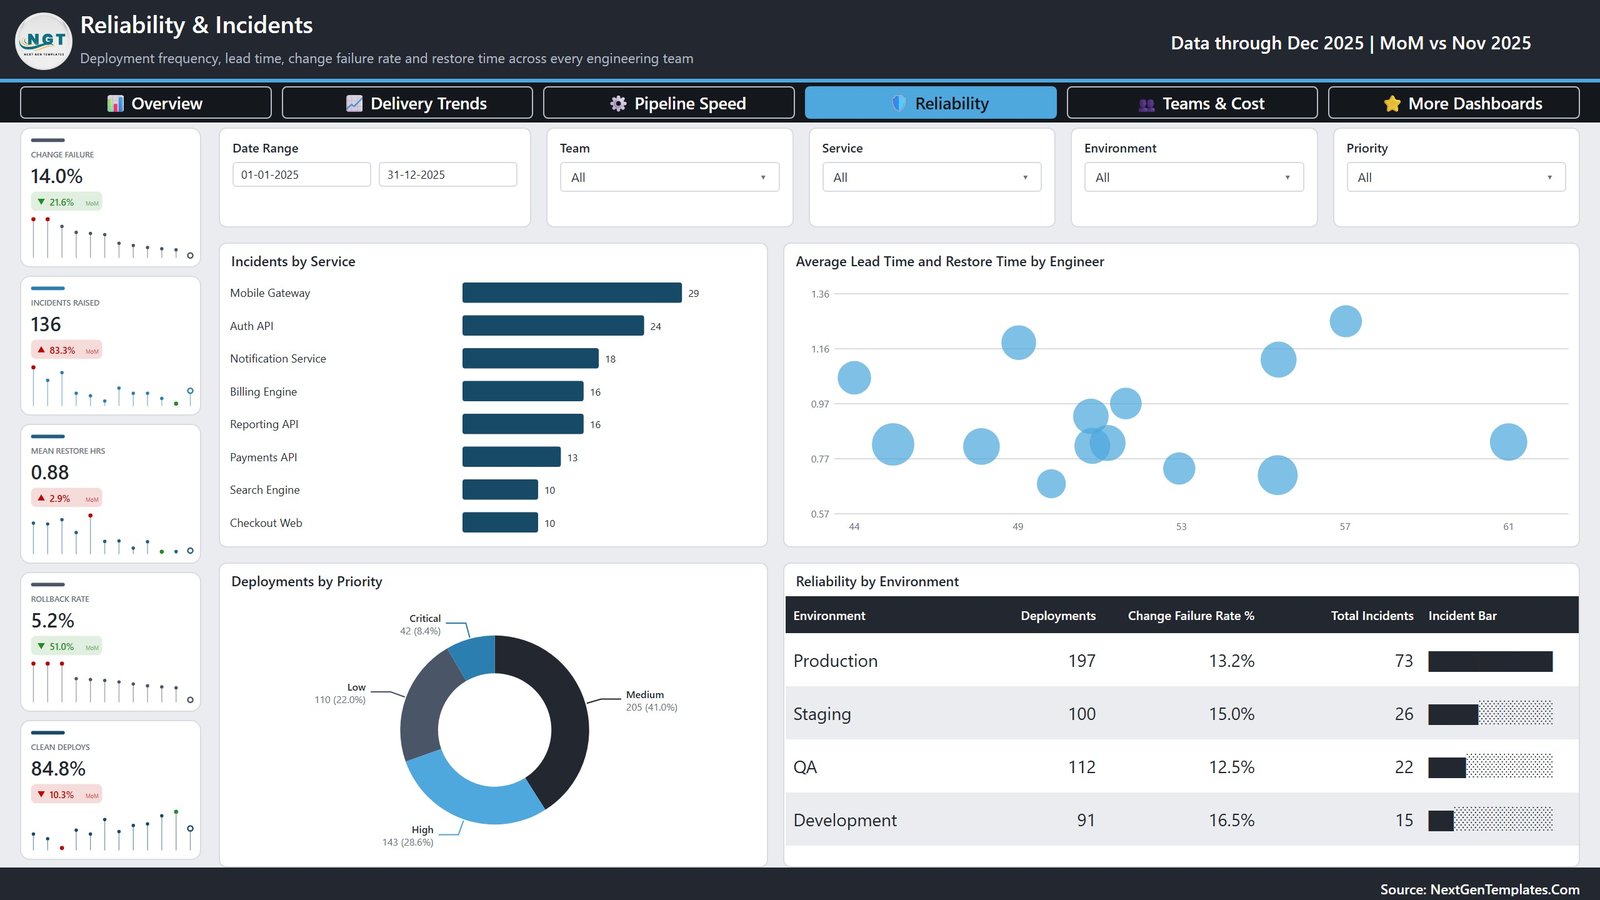
Reliability & Incidents ranks Incidents by Service (Mobile Gateway 29, Auth API 24), scatters Average Lead Time and Restore Time by Engineer, splits Deployments by Priority, and tables Reliability by Environment – where Development carries the highest change failure rate at 16.5% and Production the most incidents at 73.
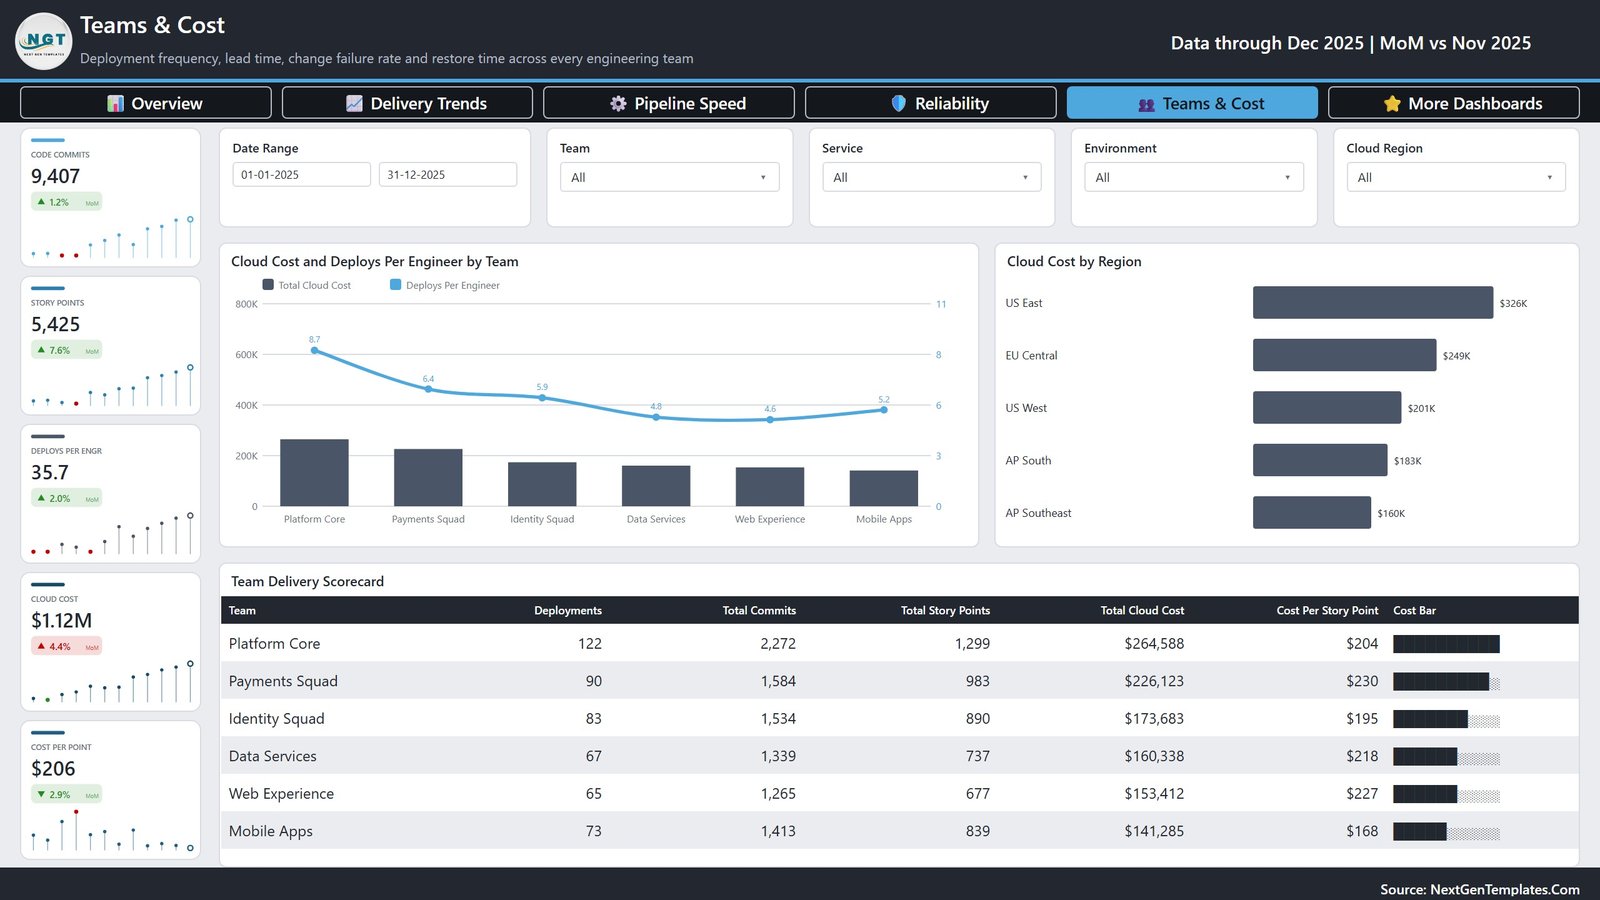
Teams & Cost combines Cloud Cost and Deploys Per Engineer by Team, Cloud Cost by Region (US East $326K down to AP Southeast $160K), and a Team Delivery Scorecard giving each squad its deployments, commits, story points, cloud cost and cost per story point.
DevOps Teams Dashboard in Power BI vs. Tableau or Qlik vs. Paid DevOps Analytics SaaS – Where This Fits
| This template (Power BI) | Tableau / Qlik build | DevOps analytics SaaS | |
|---|---|---|---|
| Cost | One-time purchase | Per-user licence plus build time | Recurring, usually per developer per month |
| Platform | Power BI Desktop (free) | Paid BI platform | Vendor-hosted web app |
| Setup time | Minutes – swap one file path and refresh | Days to weeks of authoring | Hours, once integrations are approved |
| Real-time team collaboration | Through the Power BI Service once published | Through the vendor’s server | Yes, built in |
| Mobile access | Power BI mobile app after publishing | Vendor mobile app | Yes |
| Customizable fields | Full – open model, open DAX, open layout | Full, if you build it | Limited to the vendor’s schema |
| Share with link | Yes, once published to the Service | Yes | Yes |
| Year-1 cost at 5 users | The purchase price, once | Five licences plus development days | Typically a four-figure annual contract |
| Connects to your CI/CD tools | No – you supply the deployment records | No, unless you build the connector | Yes, that is what you are paying for |
| You own the model | Yes, DAX included | Yes | No |
Who This Template Is For – and Who It’s Not For
It is for engineering managers, platform and SRE leads, delivery managers and BI analysts who already have deployment records somewhere – a pipeline export, a CSV, a ticket dump – and need a monthly or quarterly review pack rather than another live tool. It suits anyone who has to answer “are we shipping faster and breaking less?” with a chart instead of an anecdote.
It is not for teams who want live alerting. This is a paste-and-refresh reporting template: it reads one Excel table and does not connect to GitHub Actions, Jenkins, Azure DevOps, PagerDuty, or any cloud billing API. If you need a real-time incident feed, buy a monitoring product instead. It is also not the right file if you want a single-page month-picker scorecard – that is the separate DevOps Teams KPI Dashboard in Power BI. This listing is the five-page analytical dashboard.
How to Use the DevOps Teams Dashboard in Power BI
- Unzip the download and open the .pbix in Power BI Desktop, which Microsoft gives away free.
- Open Data.xlsx and look at the 19 columns the model expects: Deployment ID, Date, Team, Service, Environment, Release Type, Cloud Region, Deployment Method, Engineer, Priority, Status, Build Duration Mins, Deploy Duration Mins, Lead Time Hours, Restore Time Hours, Incidents, Code Commits, Story Points and Cloud Cost.
- Replace the 500 sample rows with your own export, keeping the headers exactly as they are.
- In Power BI, open Transform data and point the source at your file path, then Close & Apply.
- Hit Refresh. Every card, chart, table and slicer repopulates from your numbers.
- Publish to the Power BI Service for a shareable link, or export to PDF or PowerPoint for the review meeting.
Real-World Use Cases
Priya, engineering manager at a payments company. Her quarterly review asks whether the platform migration hurt reliability. She filters to Environment = Production, reads change failure rate falling from 20.7% to 9.4% across the four quarters, and screenshots the Reliability by Environment table showing Production at 13.2% against Development at 16.5%.
Marcus, SRE lead. He uses Pipeline Performance to argue for build caching: hotfixes finish in 17.3 build minutes while bugfixes take 27.4, and the service-by-environment matrix puts Billing Engine in QA at 50.2 pipeline minutes – the slowest cell on the page.
Anya, BI analyst supporting a CTO. She needs cost per unit of output, not raw spend. Teams & Cost gives her $206 cost per story point overall and a per-team spread from $168 to $230, which goes straight into the board pack.
Frequently Asked Questions
Does this connect to my CI/CD pipeline or cloud account?
No. The semantic model imports one Excel table. You export your deployment history from wherever it already lives, paste it into Data.xlsx or point Power Query at your own file, and refresh. Nothing in the file calls an external API.
Which Power BI version do I need?
Power BI Desktop, which is free. A Pro or Premium licence is only needed if you want to publish and share through the Power BI Service.
What if my column names are different?
Rename your columns to match the 19 the model expects, or edit the query in Power Query. The second route is a few clicks, and the DAX measures then keep working untouched.
Can I add my own logo and colours?
Yes. Nothing is locked. The theme, the header band, the card rail and the footer are all editable, and the commercial licence covers rebranding it for client work.
How is this different from the KPI dashboard version?
This is the multi-page analytical dashboard – five pages of trend, breakdown and comparison charts. The KPI version is a compact scorecard with a month picker and traffic lights. Plenty of teams buy both; they answer different questions.
Is there a manual?
Yes, a Power BI user manual PDF ships inside the ZIP alongside the .pbix and the sample workbook.
Do I pay again next year?
No. One-time payment, permanent licence, and the file keeps working offline.
About the Author
Built by PK – Microsoft Certified Professional with 15+ years of Excel, Google Sheets, and Power BI experience. Founder of NextGenTemplates, reaching 300K+ subscribers across YouTube channels. Every template is hand-built and tested before release.
Explore Related Templates
- DevOps Teams Dashboard in Excel – the same territory if your team lives in Excel rather than Power BI.
- DevOps Teams KPI Dashboard in Power BI – the compact month-picker scorecard companion.
- SaaS Development Dashboard in Power BI – revenue, delivery and capacity for product organisations.
- AI Chatbot Providers Dashboard in Power BI – for teams reporting on AI service delivery.
- IT Manager & CISO Toolkit – ten Excel, Google Sheets and Power BI templates in one bundle.
Browse more in Power BI Dashboards or the full Power BI category.
Download the DevOps Teams Dashboard in Power BI today. Instant download, one-time payment, no subscription, and a commercial licence included. Add it to your cart and your own deployment data can be on screen inside ten minutes.
Last updated: September 2026.




















Reviews
There are no reviews yet.