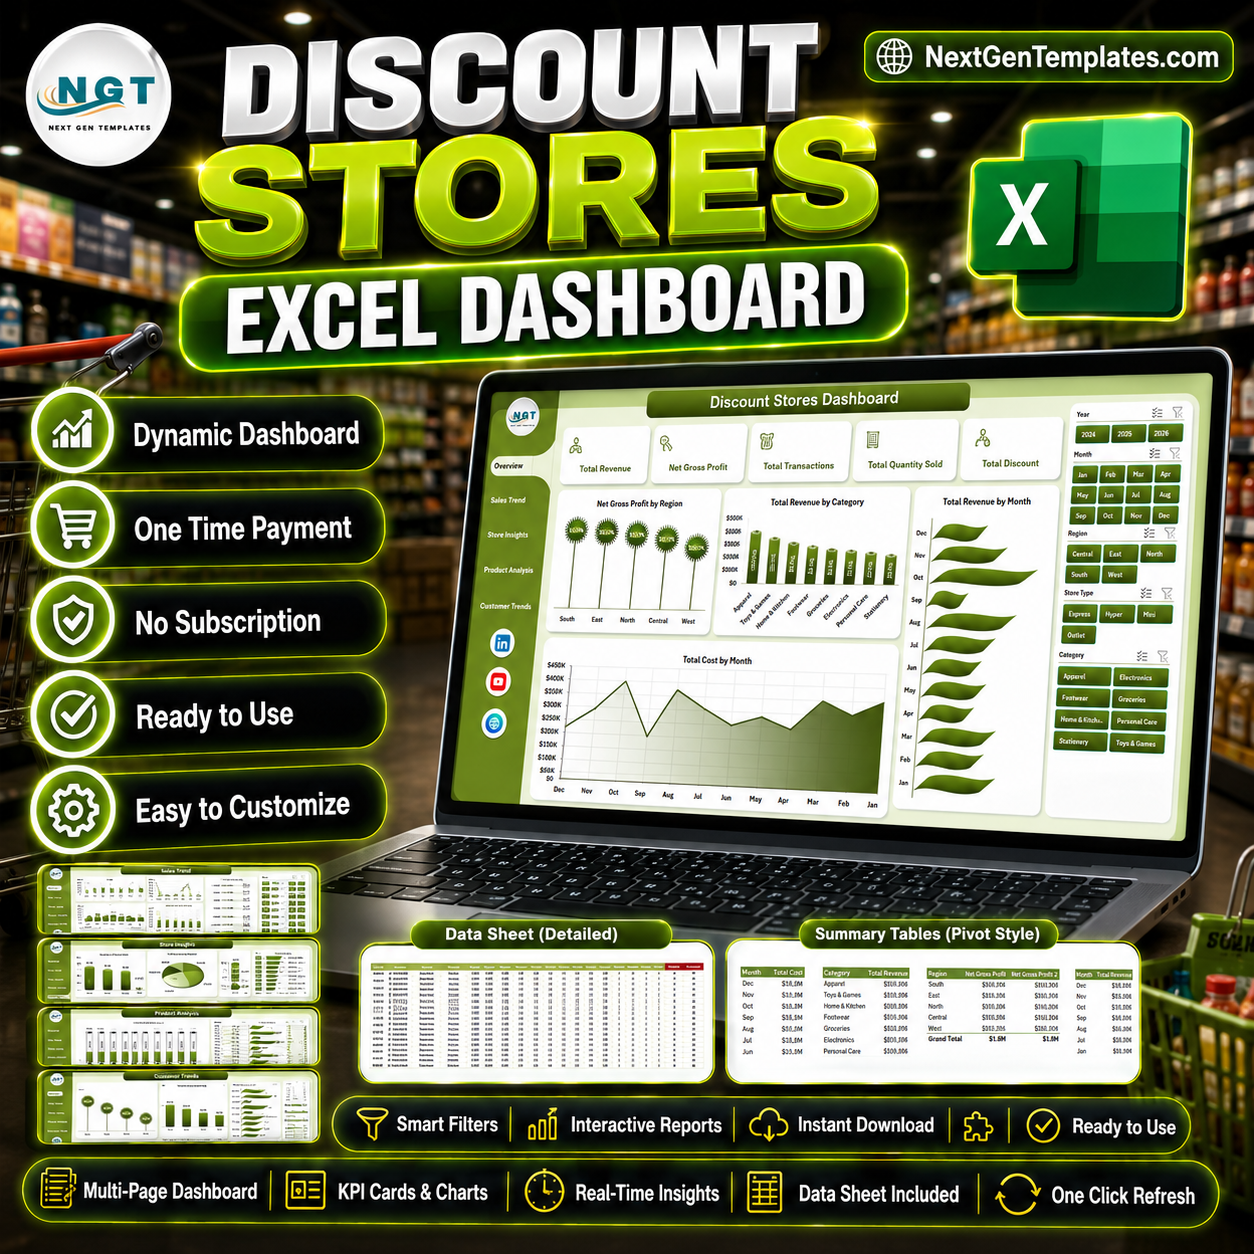


Discount Stores Dashboard in Excel helps discount-store owners, retail managers, regional managers, finance teams, and analysts track revenue, net gross profit, total transactions, quantity sold, discount value, cost, product performance, store location results, and customer trends from one ready-to-use Excel workbook.
The template includes 5 dashboard pages, 5 executive KPI cards, multiple slicers, a structured Data sheet, and a Support sheet with pivot tables. Replace the sample data with your own records, click Data > Refresh All, and the dashboard pages update automatically.
Key Features of Discount Stores Dashboard in Excel
- 5 analysis pages for Overview, Sales Trend, Store Insights, Product Analysis, and Customer Trends.
- 5 KPI cards for Total Revenue, Net Gross Profit, Total Transactions, Total Quantity Sold, and Total Discount.
- Multiple slicers to filter performance quickly by available retail fields.
- 20 chart views across revenue, profit, cost, discount, category, brand, region, store, customer, and salesperson performance.
- Editable Data sheet where you can add your own discount-store transaction records.
- Pivot-powered Support sheet used to refresh the dashboard dynamically.
- Excel-native workflow with no recurring SaaS fee and no separate BI software required.
What’s Inside the Discount Stores Dashboard in Excel
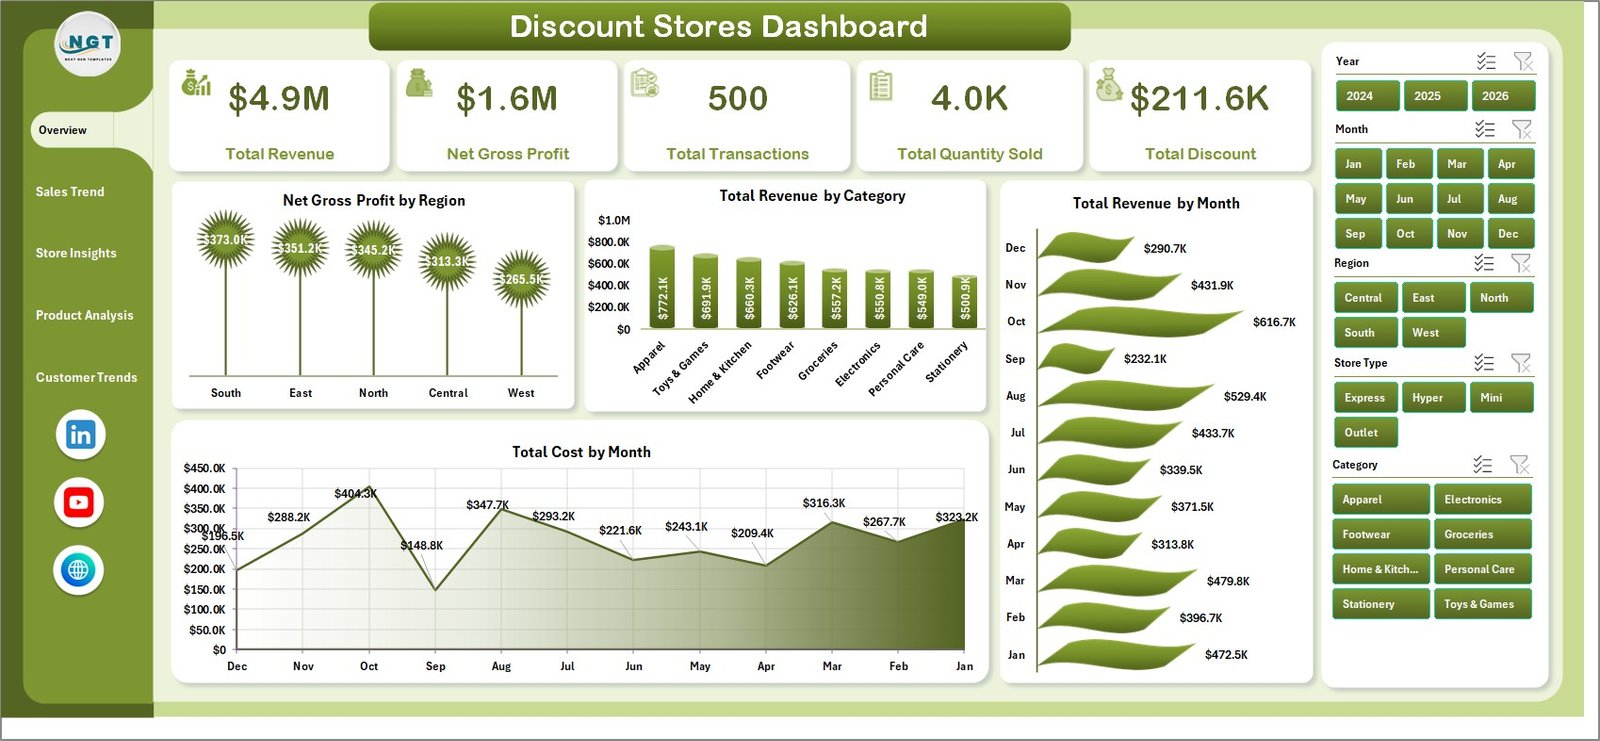
1. Overview Page
The Overview page shows high-level cards for Total Revenue, Net Gross Profit, Total Transactions, Total Quantity Sold, and Total Discount. It also includes slicers and four charts: Net Gross Profit by Region, Total Revenue by Category, Total Revenue by Month, and Total Cost by Month.
Net Gross Profit by Region helps compare which regions are protecting margin. Total Revenue by Category shows the product groups driving the largest sales contribution. Total Revenue by Month reveals seasonal movement and promotion spikes. Total Cost by Month helps compare cost movement against revenue growth.
Discount Stores Dashboard in Excel
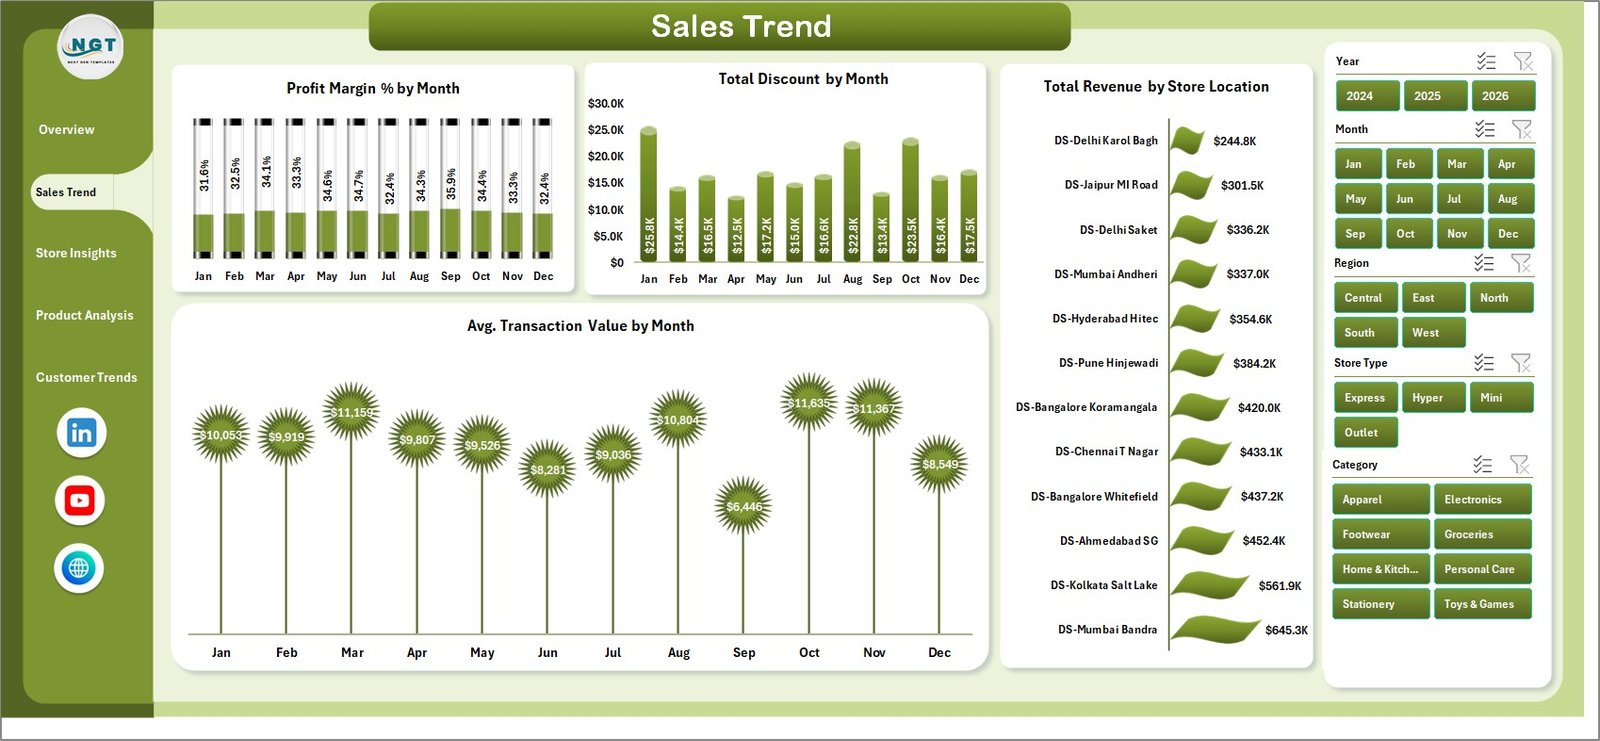
2. Sales Trend
The Sales Trend page includes Profit Margin % by Month, Total Discount by Month, Total Revenue by Store Location, and Avg. Transaction Value by Month. Use it to see whether promotions are lifting sales without damaging margin or average transaction value.
Sales Trend
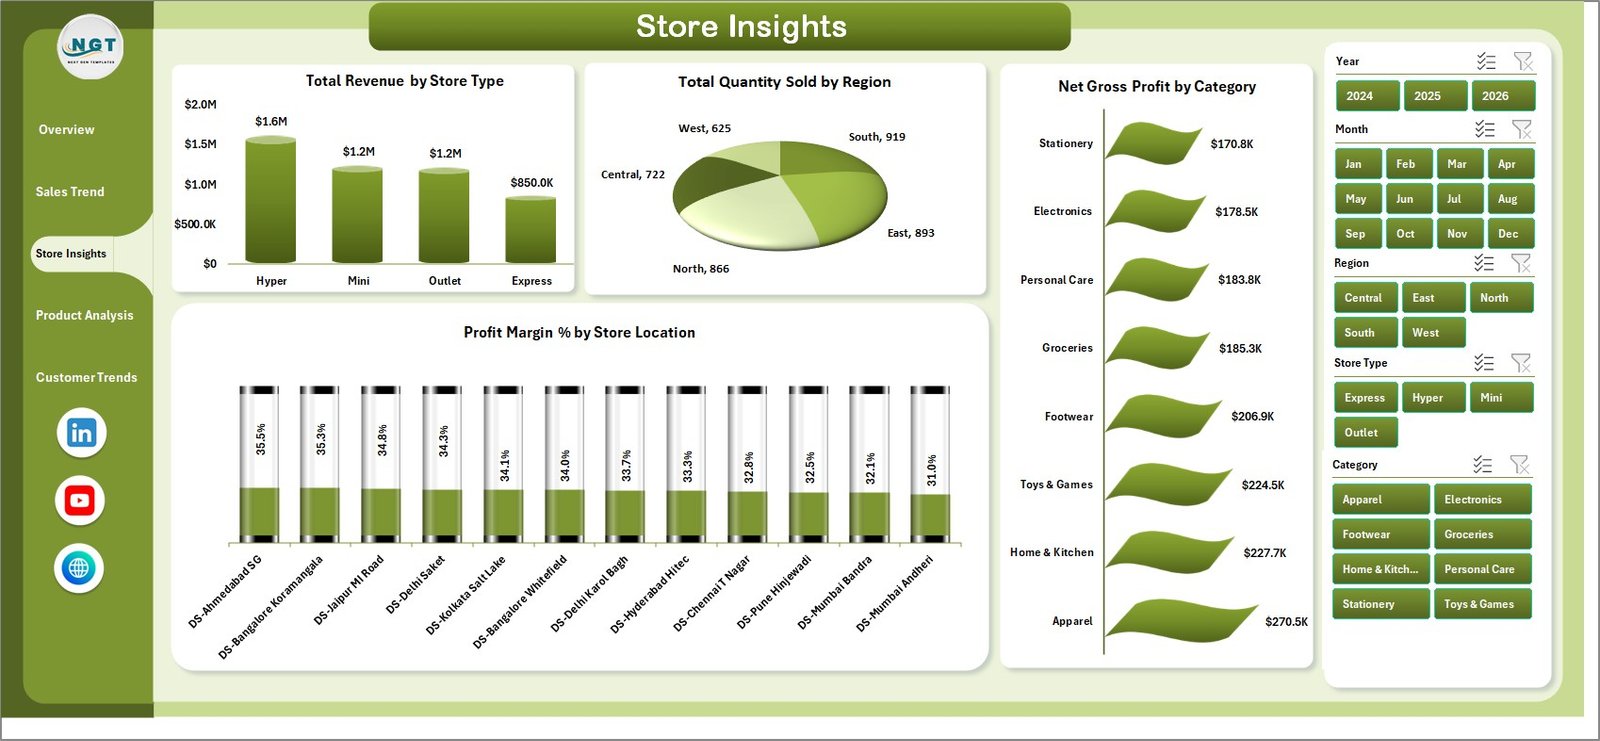
3. Store Insights
The Store Insights page includes Total Revenue by Store Type, Total Quantity Sold by Region, Net Gross Profit by Category, and Profit Margin % by Store Location. It helps compare formats, regions, locations, and product groups from a store-management perspective.
Store Insights
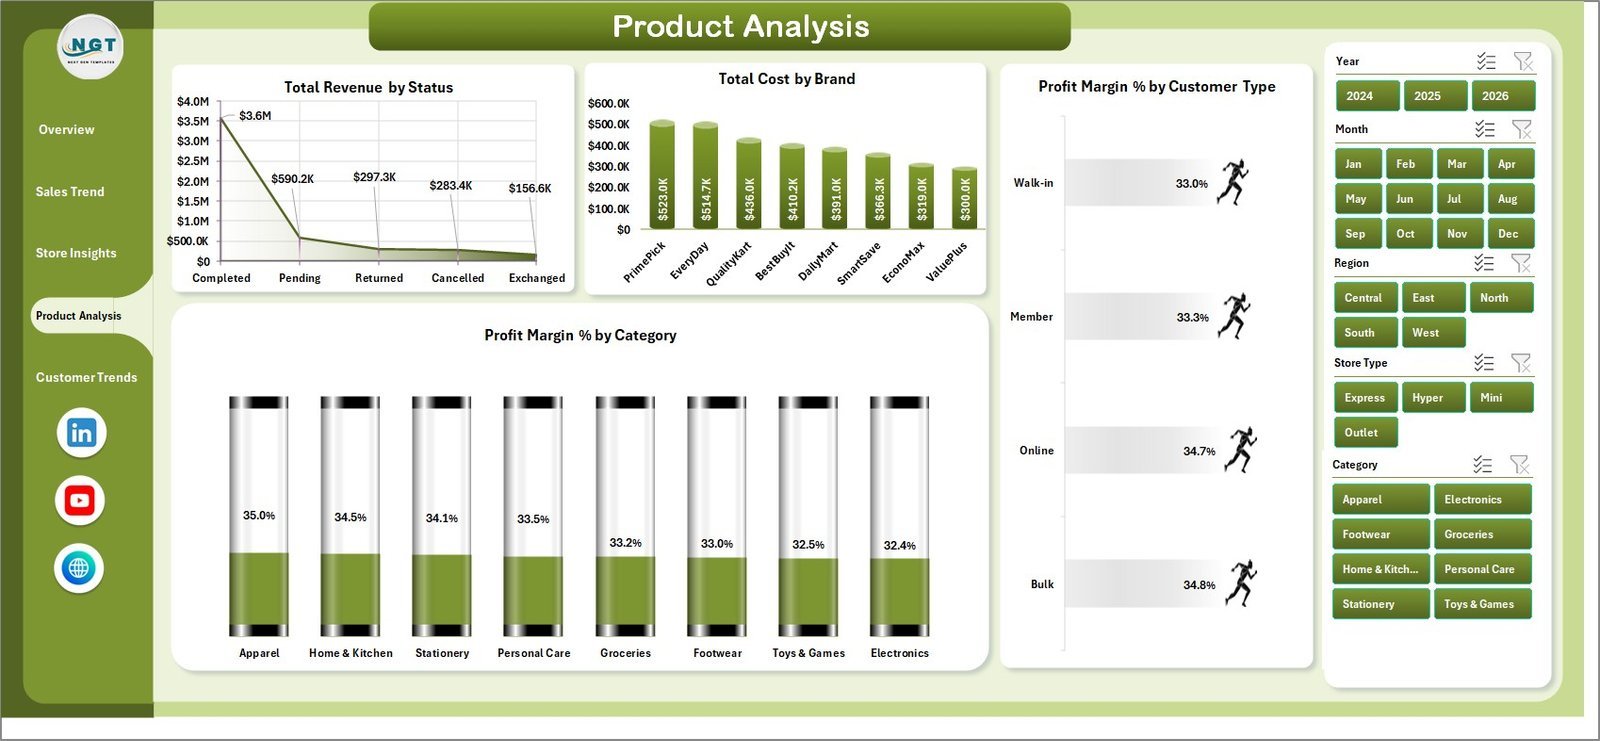
4. Product Analysis
The Product Analysis page includes Total Revenue by Status, Total Cost by Brand, Profit Margin % by Customer Type, and Profit Margin % by Category. Use it to identify brand cost pressure, profitable categories, and customer groups that respond well to discounts.

Product Analysis
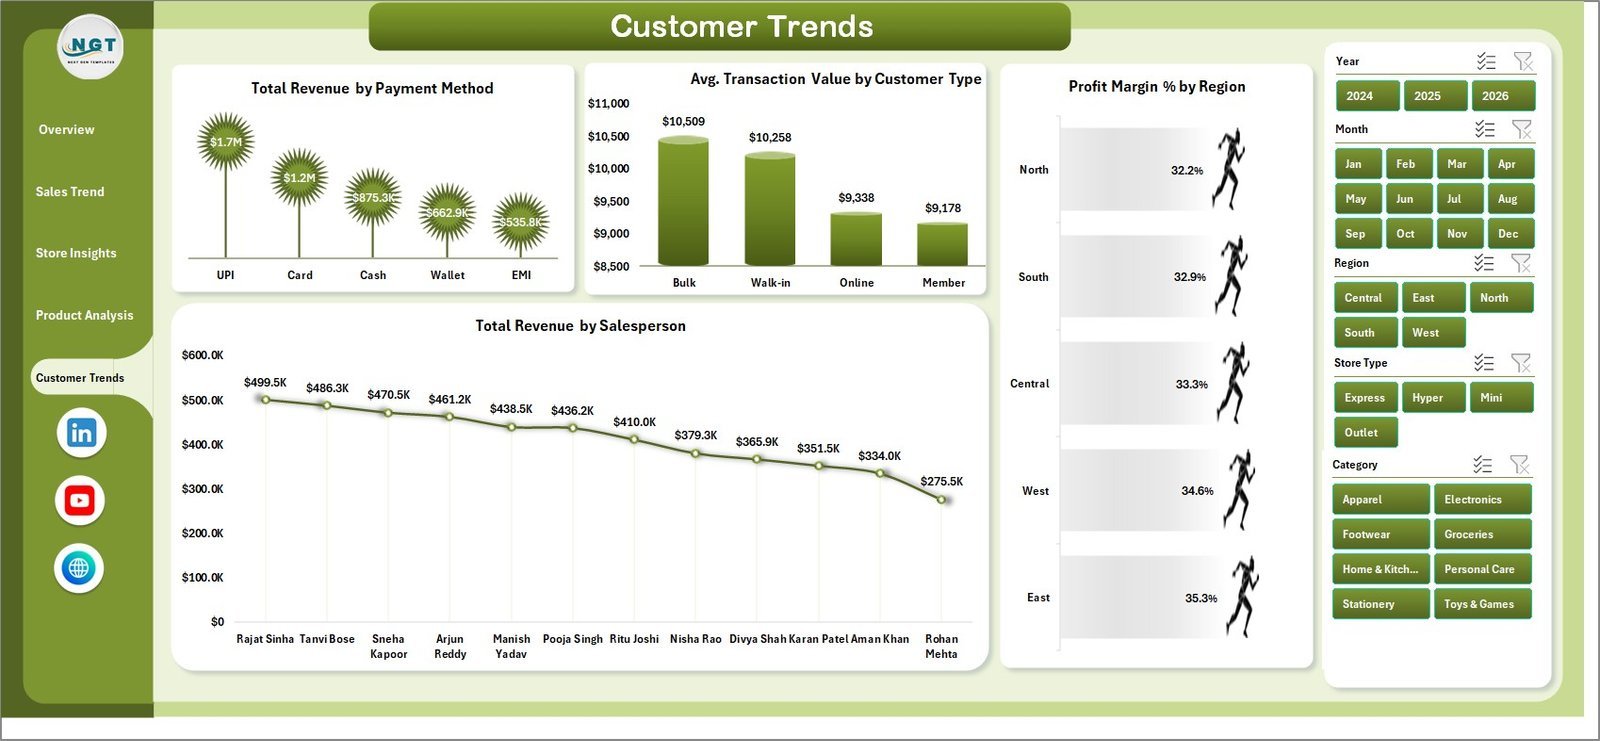
5. Customer Trends
The Customer Trends page includes Total Revenue by Payment Method, Avg. Transaction Value by Customer Type, Profit Margin % by Region, and Total Revenue by Salesperson. This page connects customer behavior, salesperson performance, and regional profitability.

Customer Trends
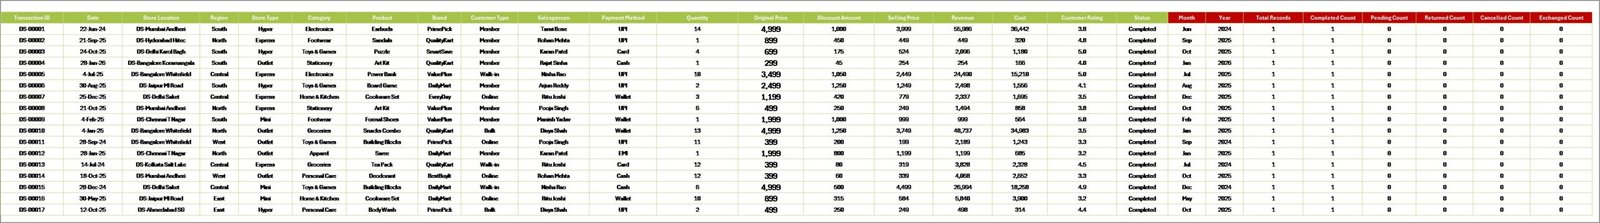
6. Data Sheet Tab
The Data sheet is where you add data in the same format as the sample file. Keep the column structure consistent, then refresh the workbook to update every dashboard page.
Data Sheet tab
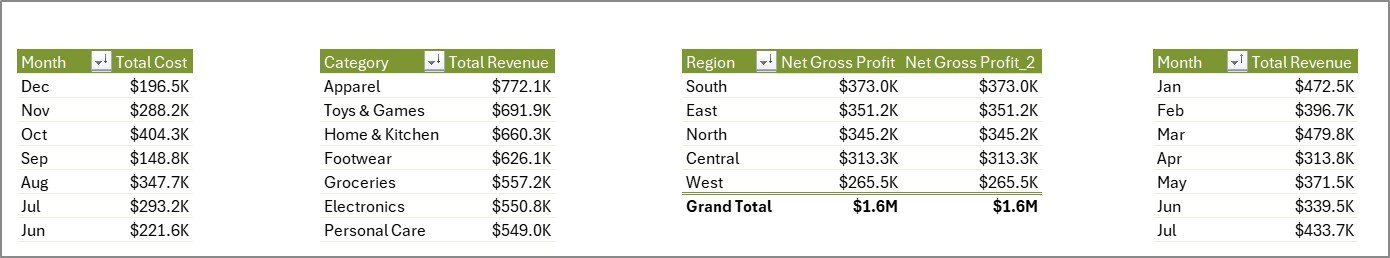
7. Support Sheet
The Support sheet contains the pivot tables used to create the entire dashboard dynamically. After updating the Data sheet, go to the Data tab in Excel and click Refresh All. You can keep this sheet hidden during normal use.

Support sheet tab
Discount Stores Dashboard in Excel vs. Google Sheets vs. Paid Retail SaaS – Where This Fits
| Feature | Discount Stores Dashboard in Excel | Google Sheets alternative | Paid retail SaaS |
|---|---|---|---|
| Cost | $17.99 one-time | Low one-time cost | Monthly or annual subscription |
| Platform | Microsoft Excel | Browser-based spreadsheet | Vendor cloud platform |
| Setup time | Under 10 minutes | Under 15 minutes | Days or weeks |
| Offline access | Yes | No | No |
| Discount and margin tracking | Pre-built | May need formulas | Built in, but vendor-specific |
| Year-1 cost at 5 users | $17.99 total | Low fixed cost | Often hundreds or thousands of dollars |
Who This Template Is For – and Who It’s Not For
Best for: discount store owners, retail managers, regional managers, category analysts, finance teams, and retail consultants who need a clean Excel reporting file without SaaS setup.
Not for: teams needing live POS API sync, enterprise access controls, automated inventory replenishment, or mobile-first operational workflows.
How to Use the Discount Stores Dashboard in Excel
- Download and unzip the file.
- Open the workbook in Microsoft Excel.
- Go to the Data sheet and replace the sample rows with your own records.
- Keep the same column names and data format.
- Click Data > Refresh All in the Excel ribbon.
- Use slicers and page tabs to analyze performance.
- Keep the Support sheet hidden after refresh if you want a cleaner workbook.
Real-World Use Cases
Maria, a regional discount-store manager, reviews Net Gross Profit by Region every Monday to spot locations where discounts are rising faster than revenue.
Ravi, a category analyst, uses Total Revenue by Category and Profit Margin % by Category to decide which categories deserve more shelf space during seasonal campaigns.
Emma, a retail consultant, creates monthly PDF reports for independent discount-store clients by refreshing the Data sheet and exporting the dashboard pages.
Frequently Asked Questions
What does the Discount Stores Dashboard in Excel track?
It tracks revenue, net gross profit, transactions, quantity sold, discounts, costs, categories, brands, regions, store locations, customer types, payment methods, and salesperson performance.
Do I need advanced Excel skills?
No. You only need to paste data into the Data sheet and click Refresh All. The charts, cards, slicers, and pivot tables are already built.
Can I customize the dashboard?
Yes. You can edit chart colors, labels, fields, formulas, and workbook styling because this is a standard Excel file.
Does it work with my own discount-store data?
Yes, as long as you enter your data in the same format as the Data sheet. You can add more rows and refresh the pivots.
Can I hide the Support sheet?
Yes. The Support sheet contains backend pivot tables and can be hidden after setup.
Is this a subscription?
No. It is a one-time purchase with lifetime access to the downloaded file.
About the Author
Built by PK – Microsoft Certified Professional with 15+ years of Excel, Google Sheets, and Power BI experience. Founder of NextGenTemplates, reaching 300K+ subscribers across YouTube channels. Every template is hand-built and tested before release.
Explore Related Templates
Pair this file with Sales Dashboard For Online Store in Excel, Dropshipping Dashboard in Excel, Thrift Stores Dashboard in Excel, Furniture Retail Dashboard in Excel, or browse the Excel Dashboard Templates category.
Click here to read the detailed blog post
Download the Discount Stores Dashboard in Excel today and start tracking discount-store performance with a clean, editable Excel workbook.
Last updated: June 2026


Reviews
There are no reviews yet.