


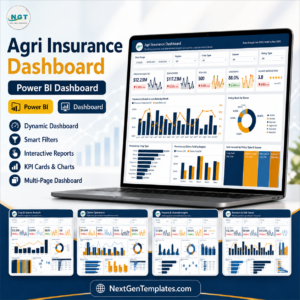
Agri Insurance Dashboard in Power BI gives crop insurance teams a ready reporting file for reviewing premium collected, sum insured, policy count, loss ratio, farmer satisfaction, subsidy value, crop exposure, yield loss, claims paid, settlement rate, peril performance, district premium, farmer category exposure, and regional scorecards. Instead of building 5 Power BI pages, KPI cards, slicers, charts, and insurance-specific visuals from scratch, you can start with this editable dashboard for a $17.99 one-time sale price. Built by PK, a Microsoft Certified Professional with 15+ years of Excel, Google Sheets, and Power BI experience and 300K+ YouTube subscribers, this template is designed for practical insurance reporting and faster stakeholder review.
Key Features of Agri Insurance Dashboard in Power BI
- 5 report pages: Overview, Premium and Subsidy Trend, Crop and Season Analysis, Claims Operations, and Region and Channel Insights.
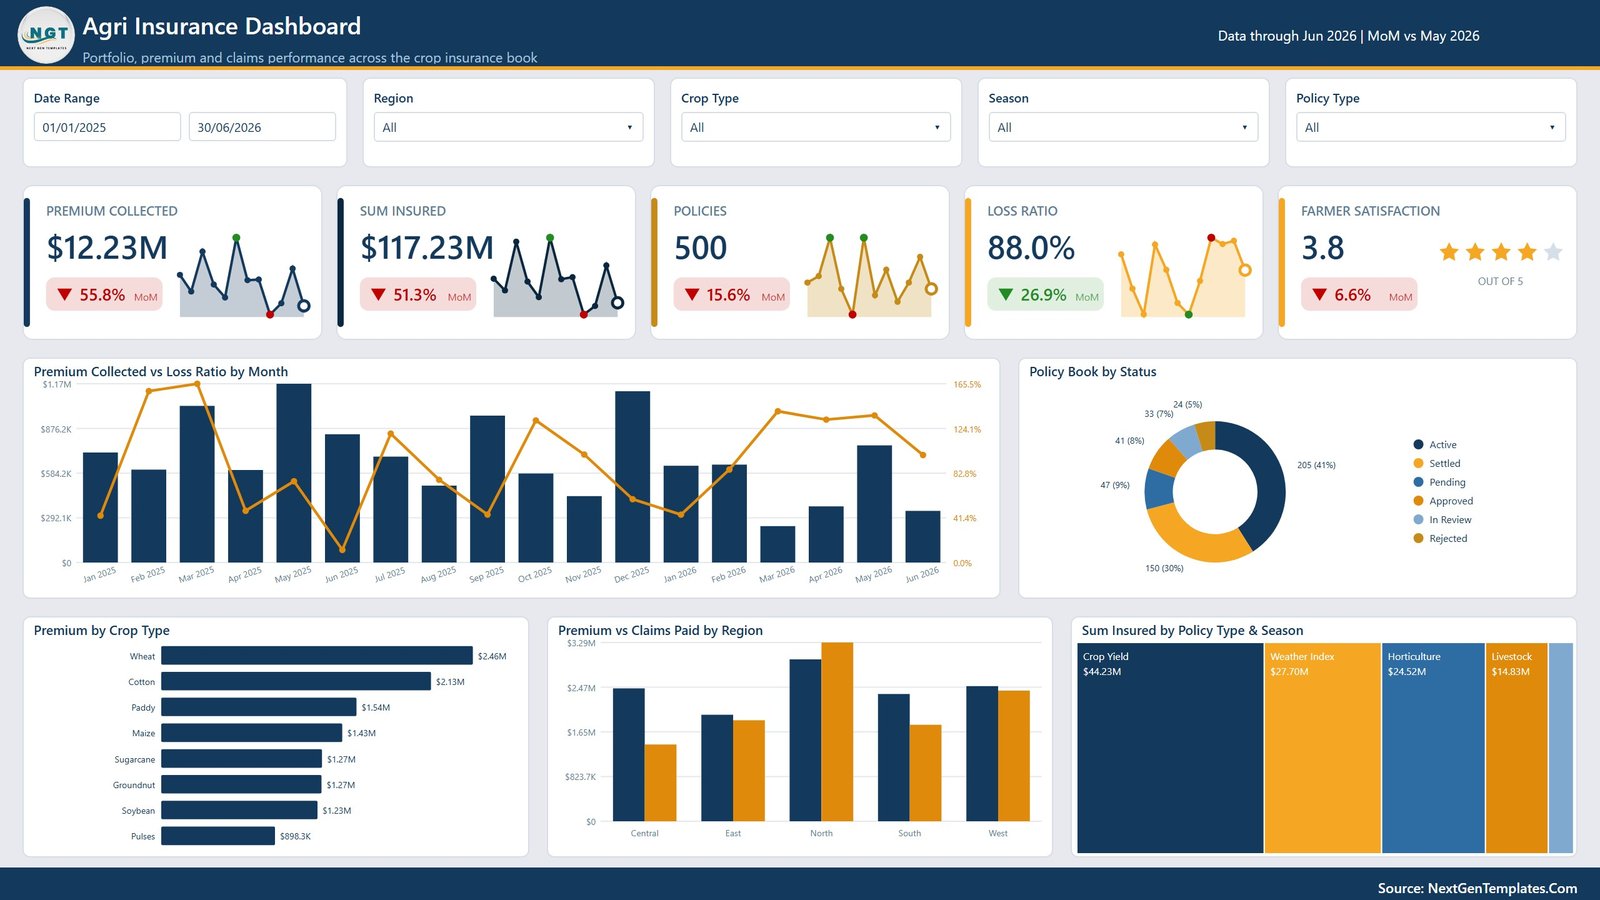
- 5 executive KPI cards: Premium Collected, Sum Insured, Policies, Loss Ratio, and Farmer Satisfaction.
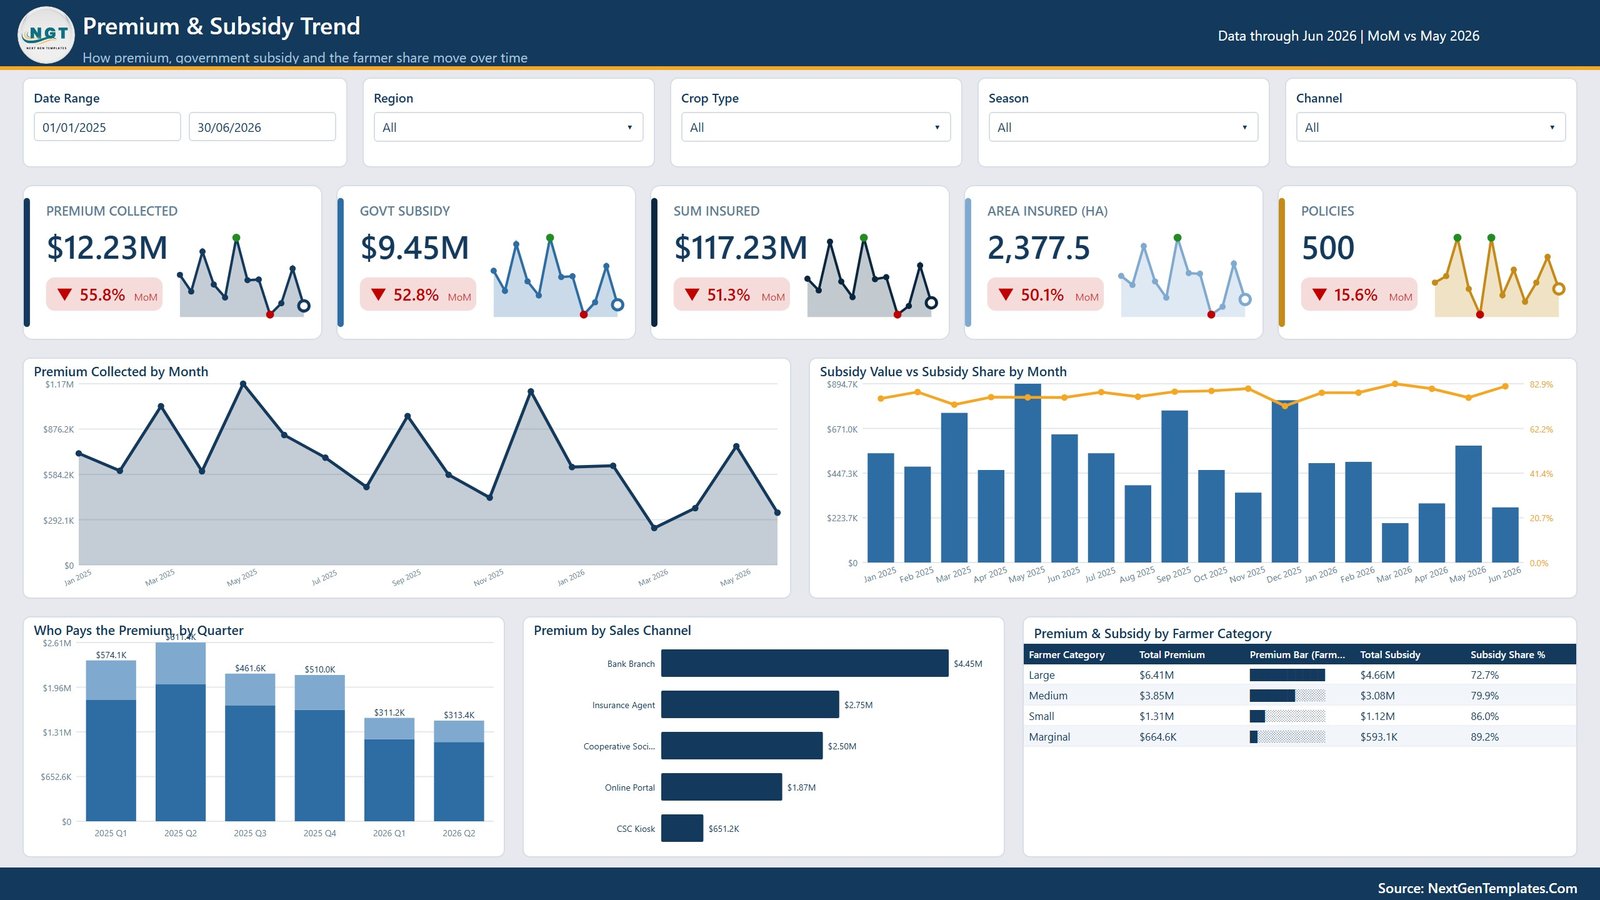
- Premium and subsidy reporting: Track monthly premium, subsidy value, subsidy share, quarterly payers, sales channel contribution, and farmer category mix.
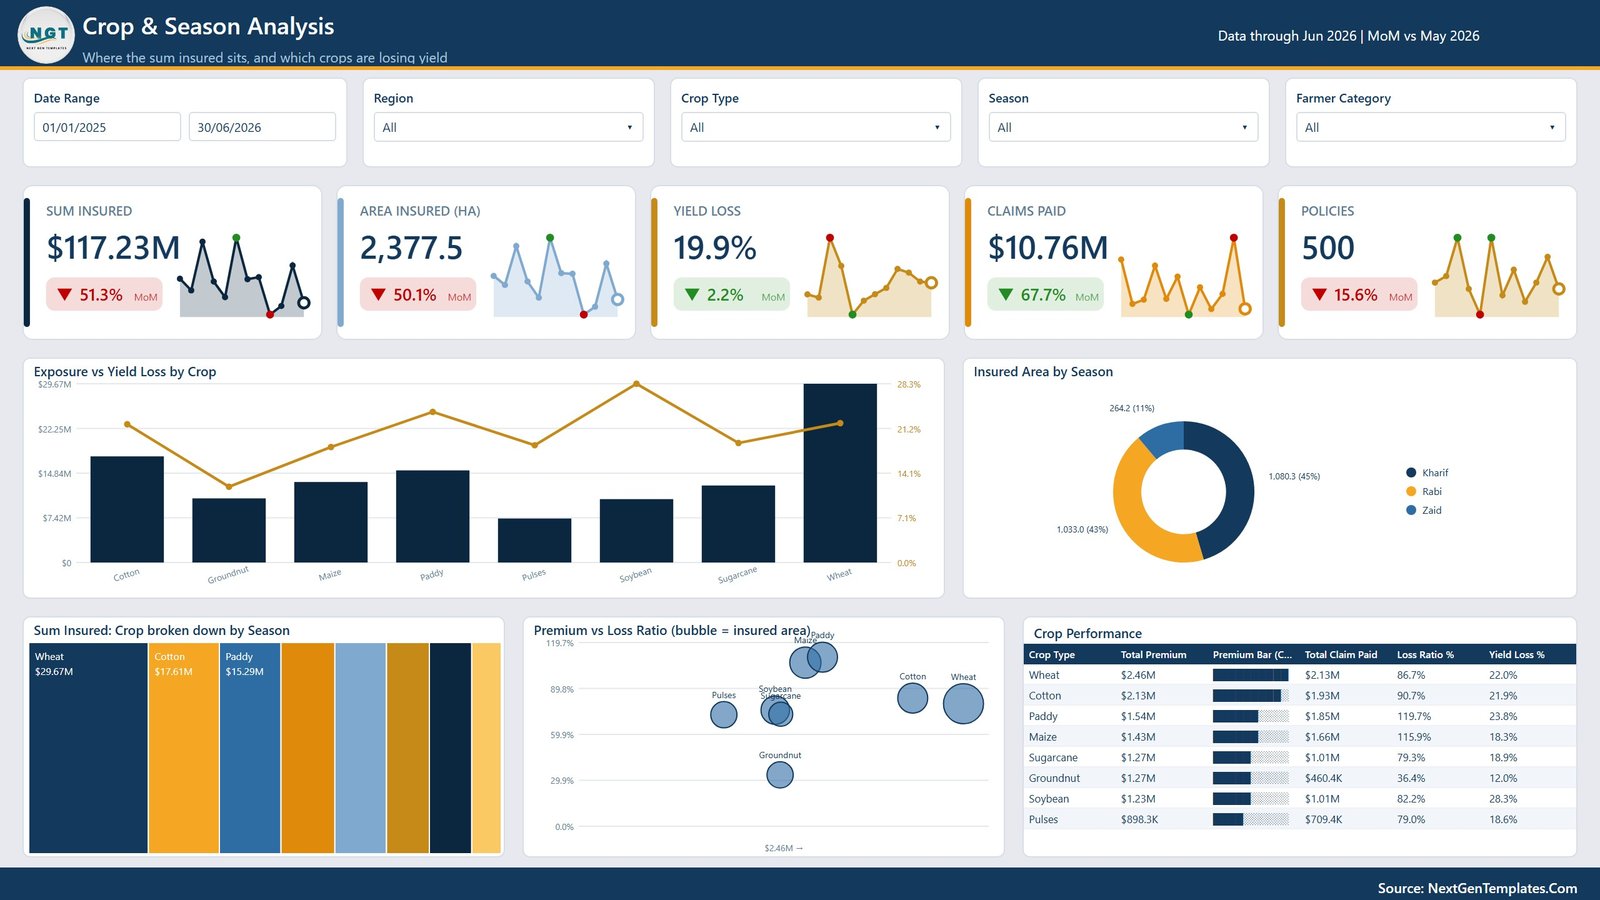
- Crop and season analysis: Review crop exposure, yield loss, insured area, crop-season sum insured, premium, and crop-level loss ratio.
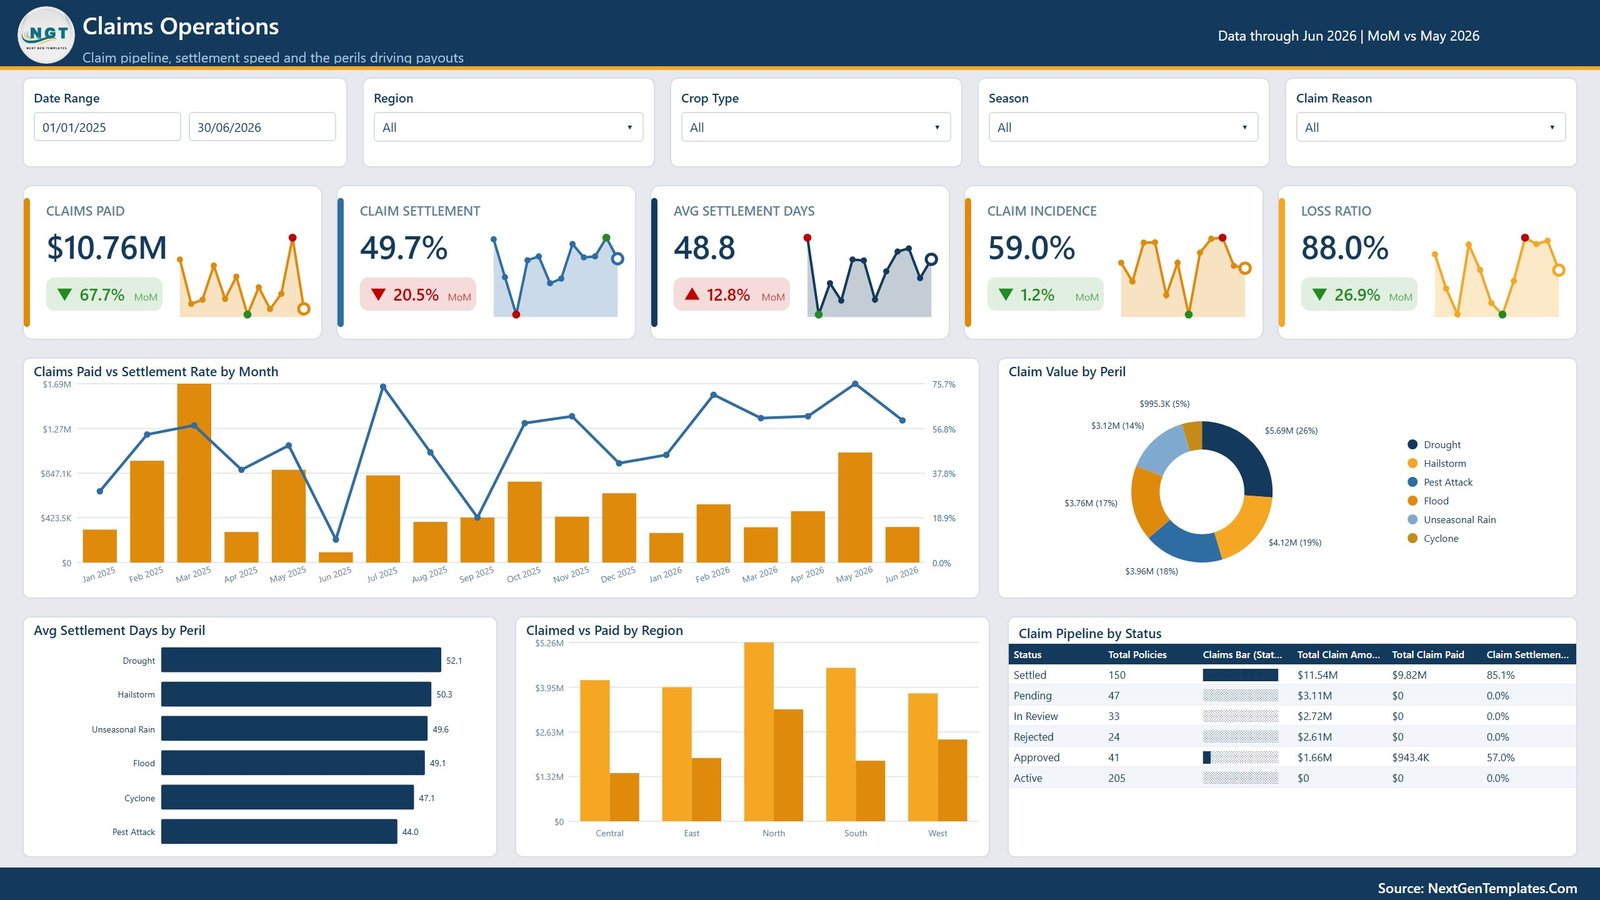
- Claims operations: Analyze claims paid, settlement rate, claim value by peril, settlement days, regional claimed-versus-paid value, and claim status pipeline.
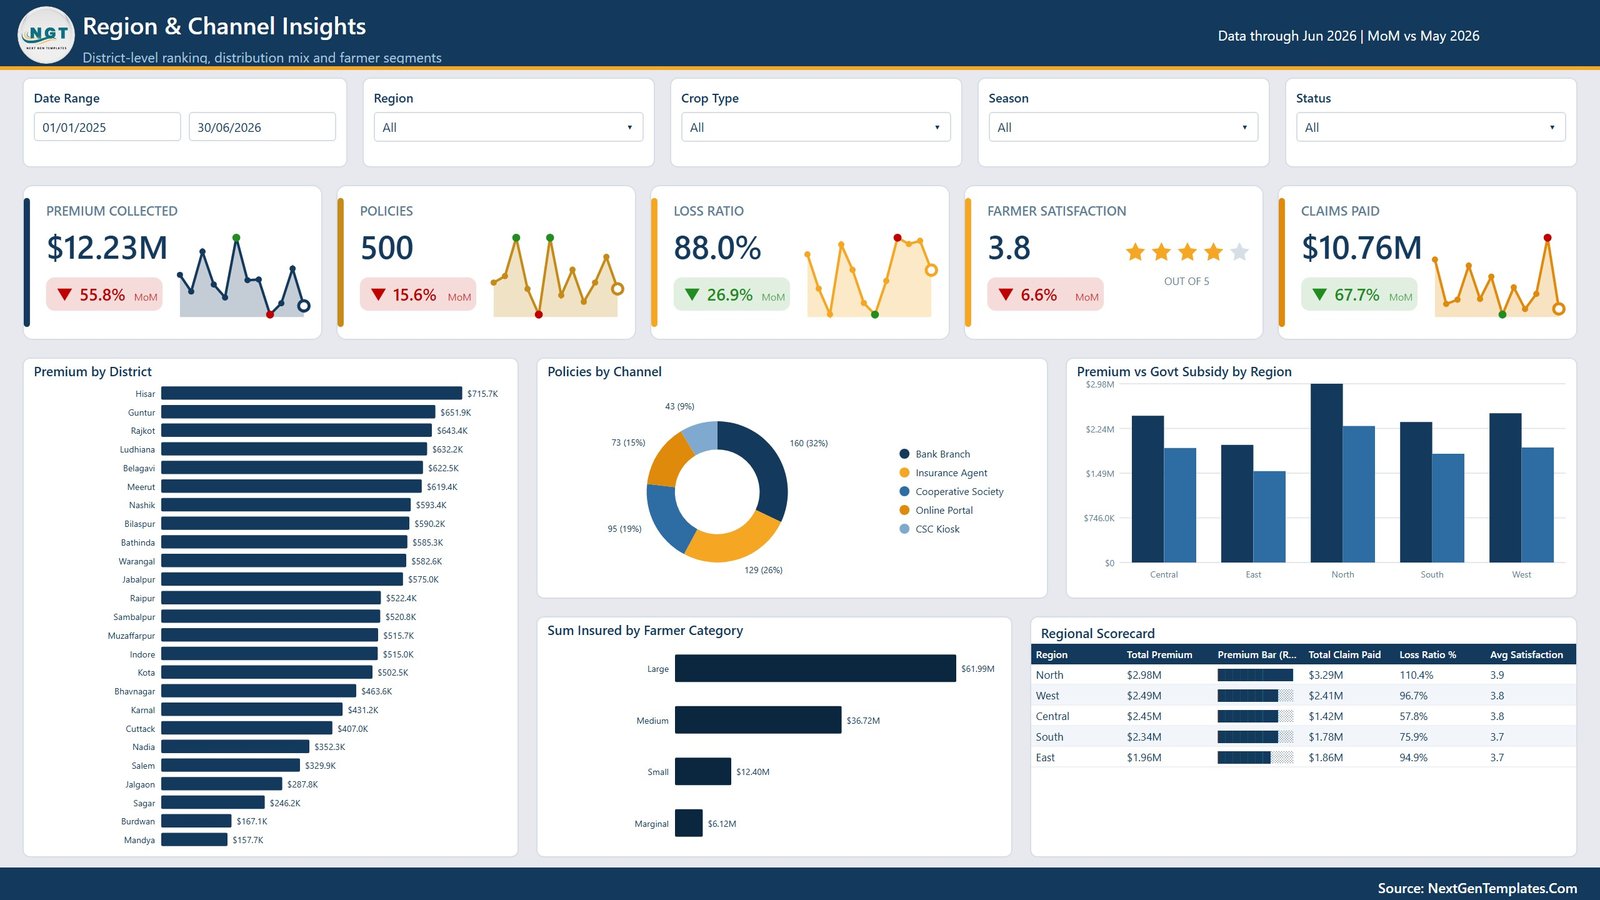
- Regional intelligence: Compare district premium, channel policy count, government subsidy, farmer category exposure, and regional scorecard performance.
What’s Inside the Agri Insurance Dashboard in Power BI
1. Overview Page
The Overview page gives leadership a quick view of the agricultural insurance book. Cards at the top show Premium Collected, Sum Insured, Policies, Loss Ratio, and Farmer Satisfaction, while supporting visuals explain monthly risk, policy status, crop type, region, and seasonal exposure.
Premium Collected and Loss Ratio by Month: Compares monthly premium movement with loss ratio pressure so managers can identify periods where claims risk is rising faster than revenue.
Policy Book by Status: Breaks policies into status groups to help teams monitor active, expired, pending, cancelled, or renewed business.
Premium by Crop Type: Shows which crop types generate the most premium and where underwriting attention may be needed.
Premium and Claims Paid by Region: Compares regional premium against claims paid to identify territories with strong or weak insurance performance.
Sum Insured by Policy Type and Season: Shows how insured value is distributed across policy types and agricultural seasons.
2. Premium and Subsidy Trend
This page focuses on how premium and subsidy support change over time. It includes Premium Collected by Month, Subsidy Value and Subsidy Share by Month, Premium Payers by Quarter, Premium by Sales Channel, and Premium and Subsidy by Farmer Category.
3. Crop and Season Analysis
This page explains where agricultural exposure is concentrated. It includes Exposure and Yield Loss by Crop, Insured Area by Season, Sum Insured by Crop and Season, Premium and Loss Ratio by Crop, and Crop Performance by Crop Type.
4. Claims Operations
This page helps claims teams monitor settlement performance and claim cost drivers. It includes Claims Paid and Settlement Rate by Month, Claim Value by Peril, Avg Settlement Days by Peril, Claimed and Paid by Region, and Claim Pipeline by Status.
5. Region and Channel Insights
This page compares geographic and distribution performance. It includes Premium by District, Policies by Channel, Premium and Govt Subsidy by Region, Sum Insured by Farmer Category, and Regional Scorecard by Region.
Agri Insurance Dashboard in Power BI vs. Tableau vs. Paid Insurance SaaS – Where This Fits
| Feature | This Power BI dashboard | Tableau alternative | Paid insurance SaaS |
|---|---|---|---|
| Cost | $17.99 one-time sale price | Requires Tableau setup and licensing | Recurring subscription or enterprise contract |
| Platform | Power BI Desktop and Power BI Service | Tableau Desktop or Server | Vendor-hosted insurance system |
| Setup time | Replace data and refresh | Build model and dashboards manually | Implementation, data mapping, and onboarding required |
| Customizable fields | Editable report, model, measures, pages, and visuals | Editable if you own the workbook | Depends on vendor permissions |
| Year-1 cost at 5 users | Low template cost plus Power BI licensing if needed | Higher licensing and build cost | Often much higher due to subscription pricing |
| Agri insurance analytics | Premium, subsidy, crop, season, claims, peril, region, channel, farmer category, and satisfaction views | Must be designed manually | Depends on purchased modules |
Who This Template Is For – and Who It’s Not For
Best for: agricultural insurance companies, crop insurance program teams, government-backed insurance schemes, insurance brokers, farmer cooperatives, banks offering crop-linked insurance, NGO program teams, and consultants preparing agricultural insurance reports.
Not for: teams needing a full policy administration system, claim survey mobile app, payment processing, automated underwriting engine, statutory filing system, or customer portal. This is a Power BI reporting layer for prepared insurance data.
How to Use the Agri Insurance Dashboard in Power BI
- Download and unzip the product file.
- Open the PBIX file in Power BI Desktop.
- Replace the sample source data with your own agricultural insurance records.
- Refresh the report and validate the KPI cards against your source totals.
- Use slicers to filter by period, crop, region, district, season, channel, farmer category, policy type, and claim status.
- Review the Overview page first, then move into premium, crop, claims, and regional analysis pages for deeper decisions.
Real-World Use Cases
Anika, crop insurance program manager: reviews premium collection, subsidy share, policy volume, and farmer participation before monthly stakeholder meetings.
Rohit, claims operations lead: monitors settlement rate, peril-wise claim value, average settlement days, and claim pipeline status to reduce claim backlogs.
Meera, regional portfolio analyst: compares district premium, regional subsidy, farmer category exposure, and channel productivity for quarterly performance reviews.
Frequently Asked Questions
What does this dashboard track?
It tracks premium collected, sum insured, policies, loss ratio, farmer satisfaction, subsidy value, subsidy share, crop exposure, yield loss, claims paid, settlement rate, peril value, regional performance, and channel insights.
Can I use my own insurance data?
Yes. Replace the sample data with your own agricultural insurance records and refresh the Power BI report.
Does it include subsidy analysis?
Yes. The Premium and Subsidy Trend page includes subsidy value, subsidy share, premium payers, sales channel contribution, and premium and subsidy by farmer category.
Is Power BI Desktop required?
Yes. Use Power BI Desktop to open, edit, customize, and refresh the PBIX file.
Can I customize the dashboard?
Yes. You can edit visuals, rename fields, update measures, add new pages, and connect the report to your own source model if you are comfortable using Power BI.
Is this a full insurance management system?
No. It is a reporting dashboard, not a policy issuance, claims survey, payment, or customer portal system.
About the Author
Built by PK – Microsoft Certified Professional with 15+ years of Excel, Google Sheets, and Power BI experience. Founder of NextGenTemplates, reaching 300K+ subscribers across YouTube channels. Every template is hand-built and tested before release.
Explore Related Templates
Pair this dashboard with Agri Insurance Dashboard in Excel, Insurance Agency Dashboard in Excel, and Policy Performance and Risk Analysis Dashboard in Google Sheets. Browse more Power BI dashboard templates and Power BI templates.
Detailed blog post: Agri Insurance Dashboard in Power BI.
Download the Agri Insurance Dashboard in Power BI to review premium, subsidy, crop, season, claims, region, channel, and farmer category performance in one editable Power BI report.
Last updated: August 11, 2026.






















Reviews
There are no reviews yet.