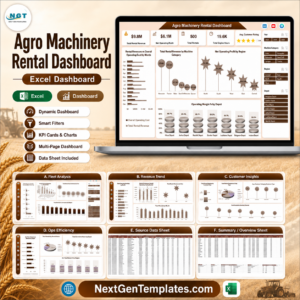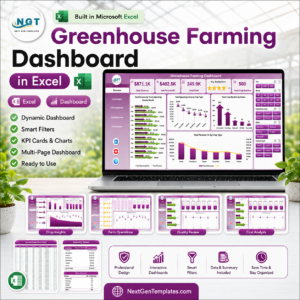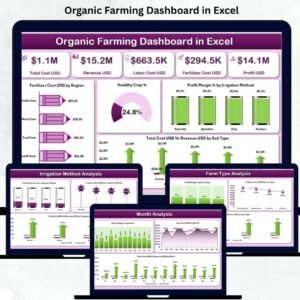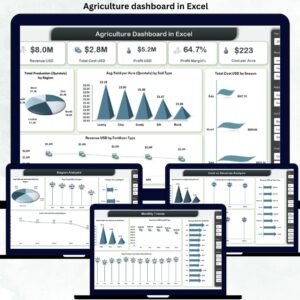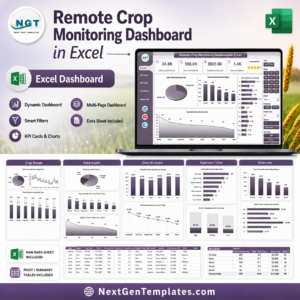


Remote Crop Monitoring Dashboard in Excel helps farms, agribusiness teams, crop consultants, and drone monitoring operators review area monitored, yield estimate, monitoring cost, alerts, quality score, crop trends, field health, cost drivers, and operator performance in one editable workbook. A crop monitoring program with only 30 fields and monthly visits can produce 360+ records per year before region, farm, crop type, alert level, sensor type, and operator details are added. This Excel dashboard gives those records a ready reporting structure for $17.99 one-time, with no recurring farm analytics subscription and a review-friendly dashboard layout.
Key Features of Remote Crop Monitoring Dashboard in Excel
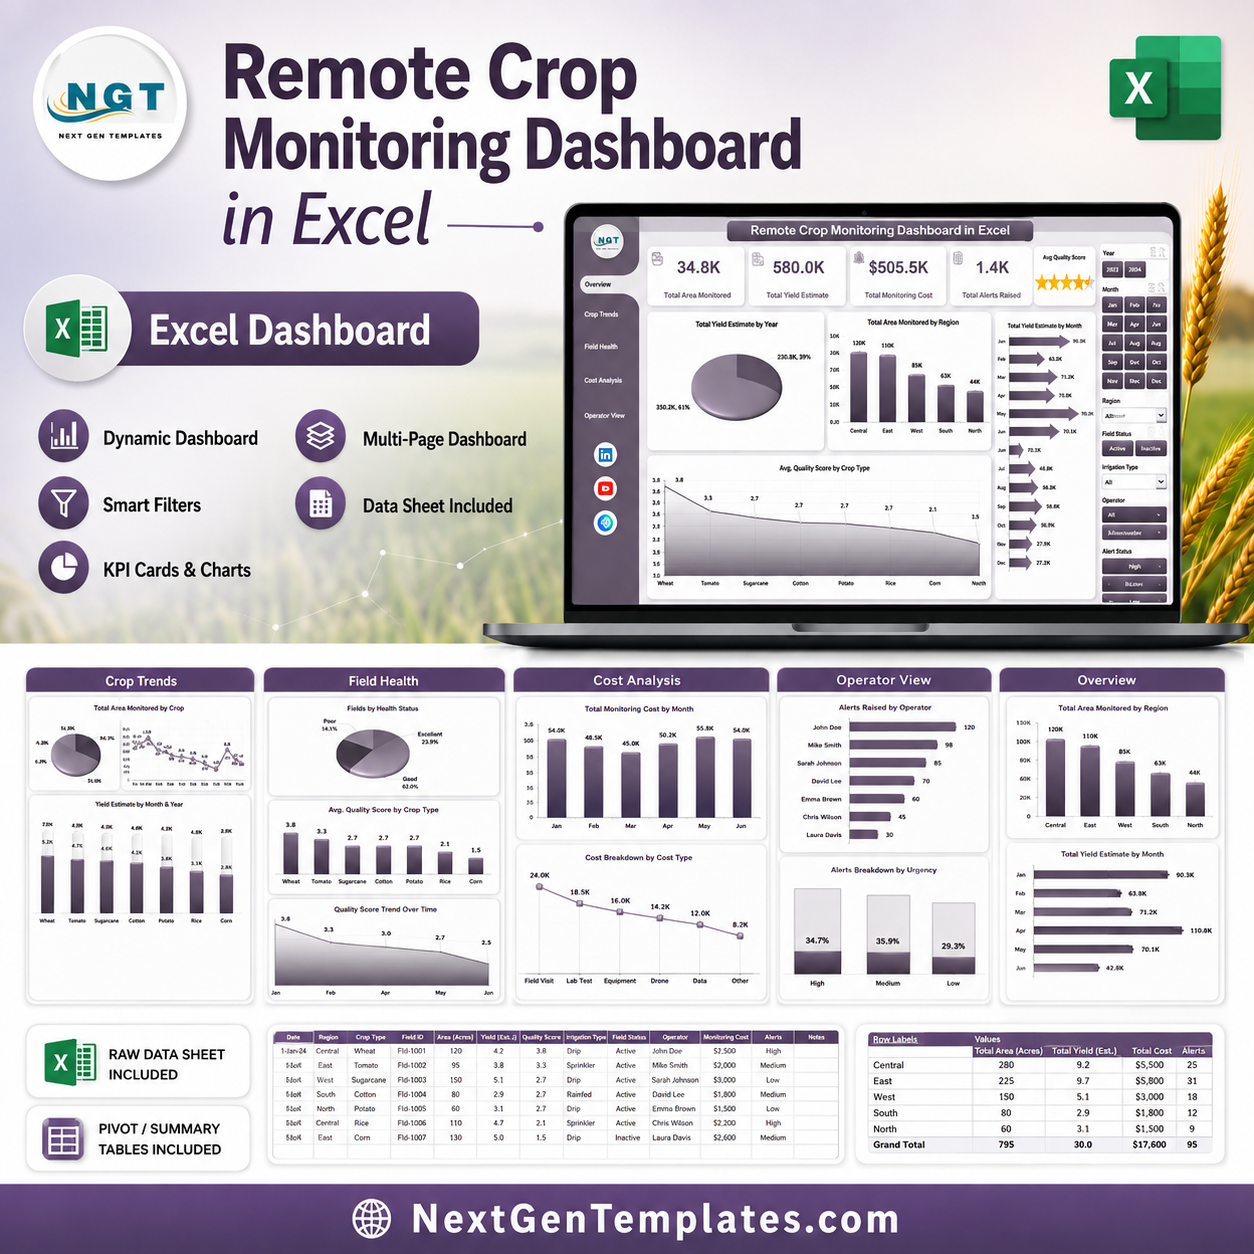
- 5 dashboard pages: Overview, Crop Trends, Field Health, Cost Analysis, and Operator View.
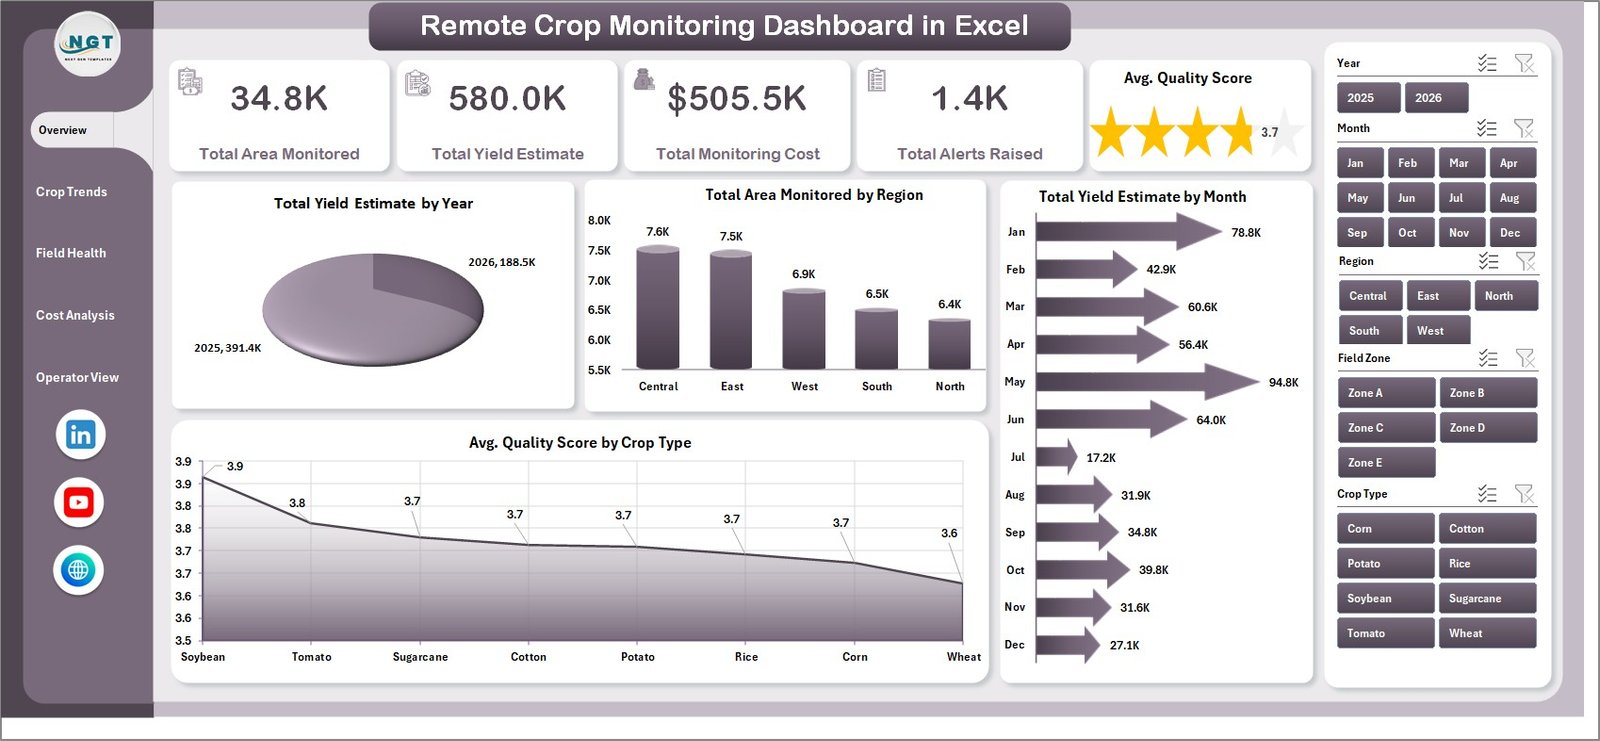
- 5 KPI cards: Total Area Monitored, Total Yield Estimate, Total Monitoring Cost, Total Alerts Raised, and Avg. Quality Score.
- Interactive Excel slicers: Filter the dashboard quickly by crop, region, time period, status, sensor, operator, alert level, field zone, and related fields.
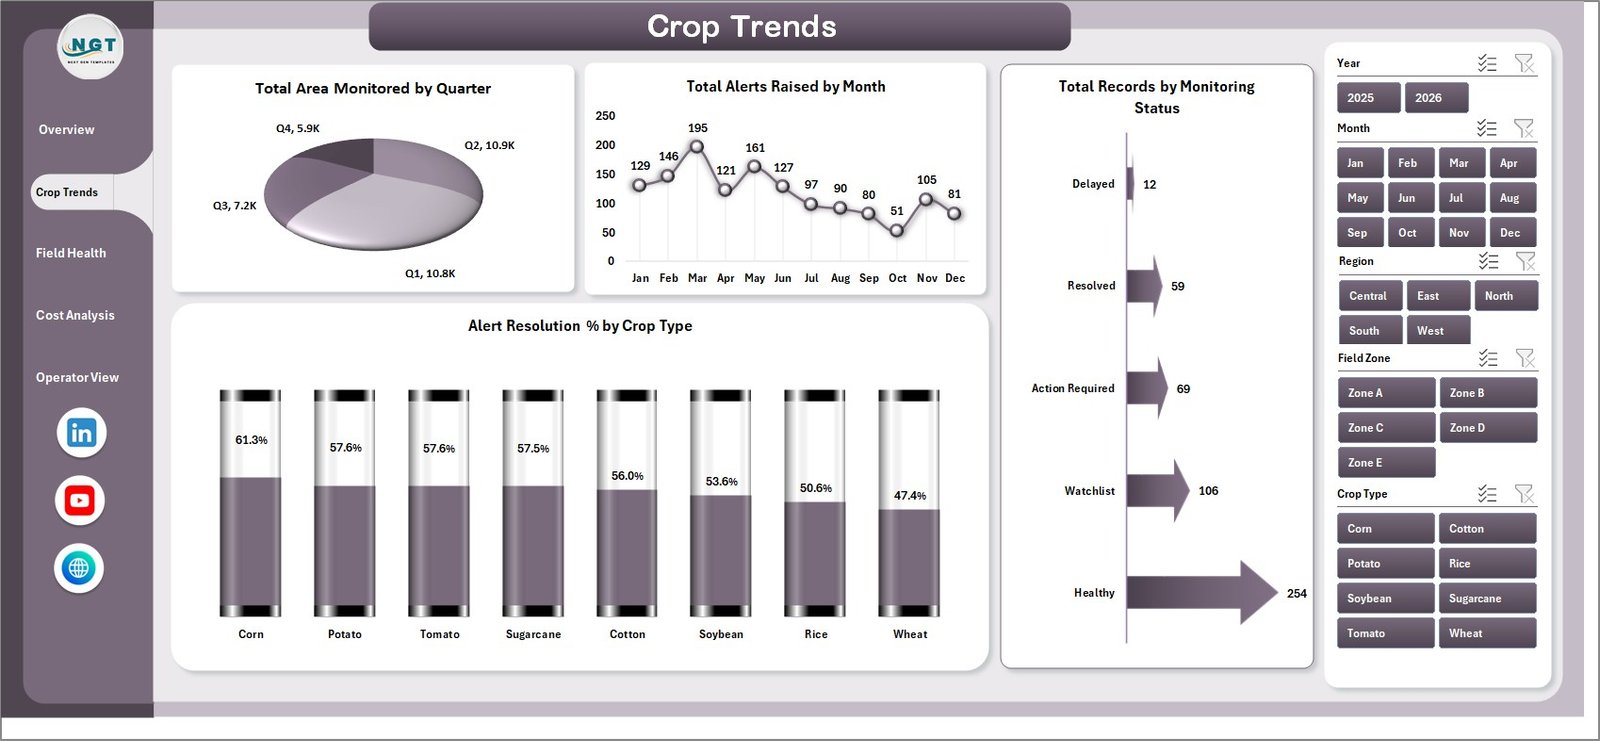
- Crop trend analysis: Review total area, alerts, monitoring status, and alert resolution percentage across months, quarters, and crop types.
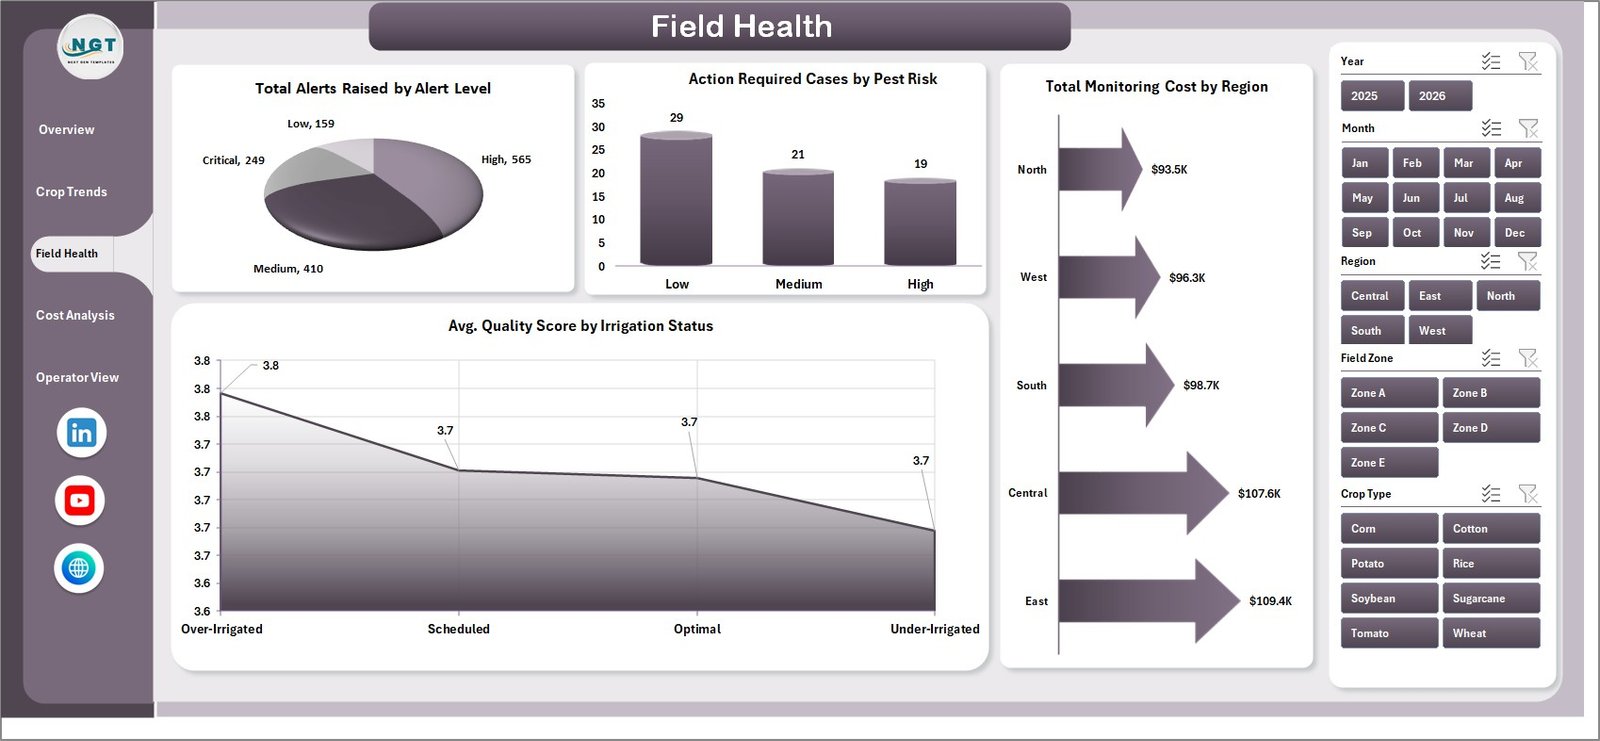
- Field health view: Compare alerts, pest risk, monitoring cost, irrigation status, and quality score so risk areas are easier to spot.
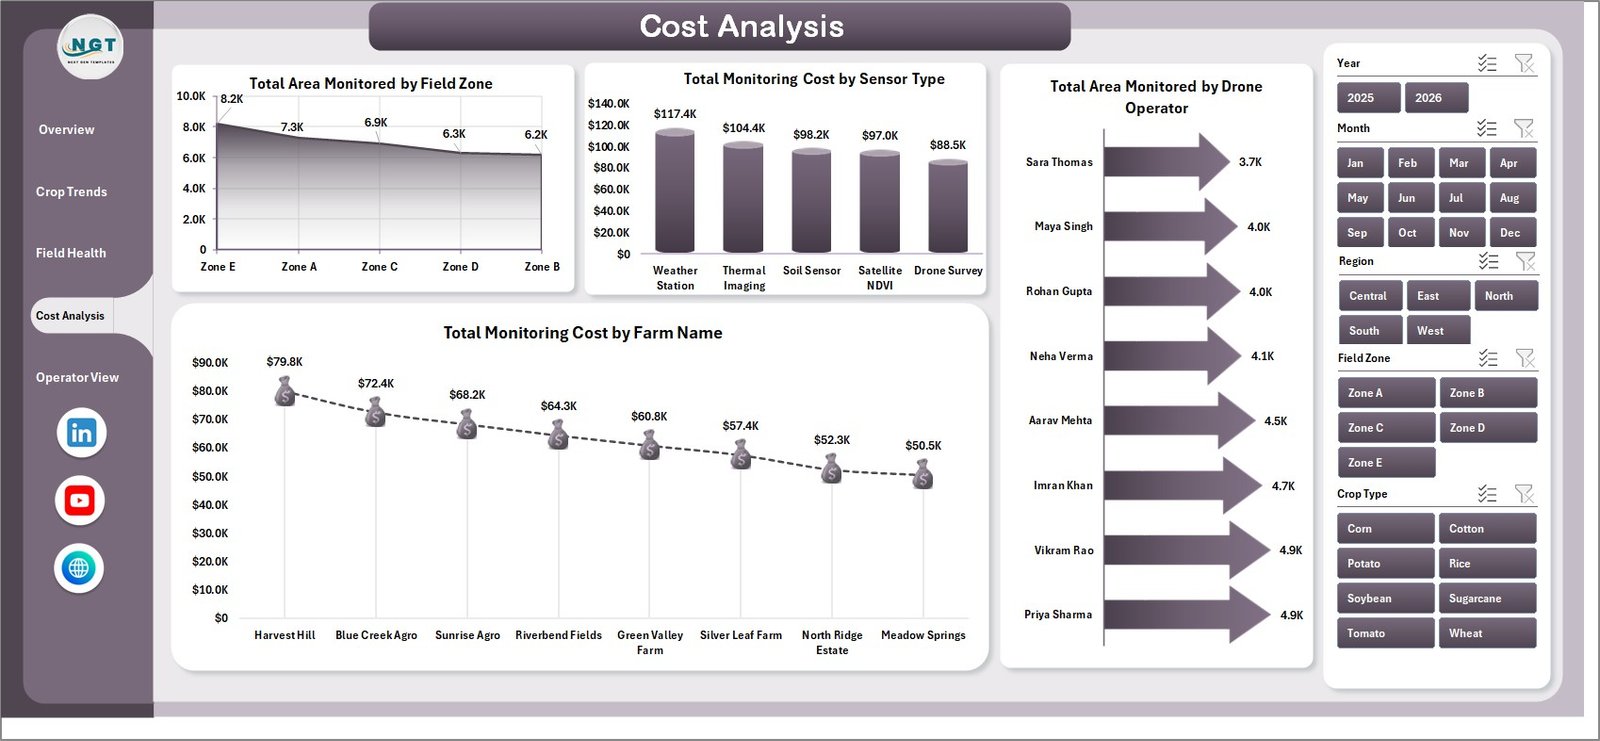
- Cost and operator reporting: Analyze monitoring cost by sensor, farm, month, region, operator, field zone, and drone operator performance.
- Data and support sheets: Replace sample records, refresh pivots, and keep the support sheet hidden after setup.
What’s Inside the Remote Crop Monitoring Dashboard in Excel
1. Overview Page
The Overview page gives leadership a high-level view of crop monitoring performance. The top cards show Total Area Monitored, Total Yield Estimate, Total Monitoring Cost, Total Alerts Raised, and Avg. Quality Score so users can quickly understand coverage, expected production, cost, risk volume, and monitoring quality.
Total Yield Estimate by Year: This chart shows how expected yield changes year by year. It helps teams compare long-term crop outlook and identify whether monitoring results are improving over time.
Total Area Monitored by Region: This visual compares monitored area across regions. It helps managers see where field coverage is strongest and where additional monitoring may be required.
Total Yield Estimate by Month: This chart tracks expected yield month by month. It helps users review seasonal movement and spot periods that need closer crop follow-up.
Avg. Quality Score by Crop Type: This chart compares monitoring quality across crop types. It helps agronomy teams identify crops with stronger inspection results and crops that need better review processes.
2. Crop Trends
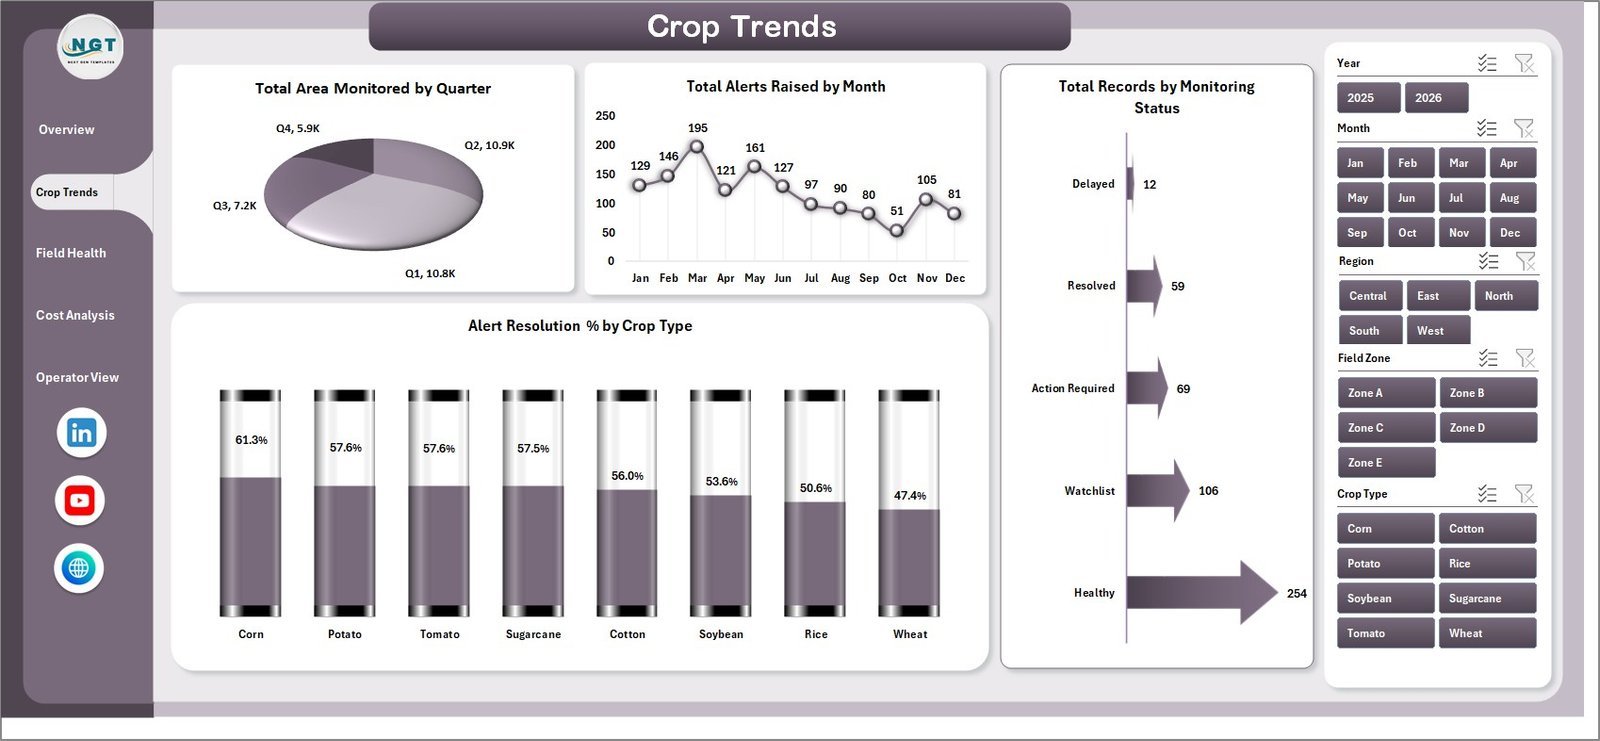
The Crop Trends page reviews production and monitoring movement over time. It includes Total Area Monitored by Quarter, Total Alerts Raised by Month, Total Records by Monitoring Status, and Alert Resolution % by Crop Type so users can connect field activity with issue response.
3. Field Health
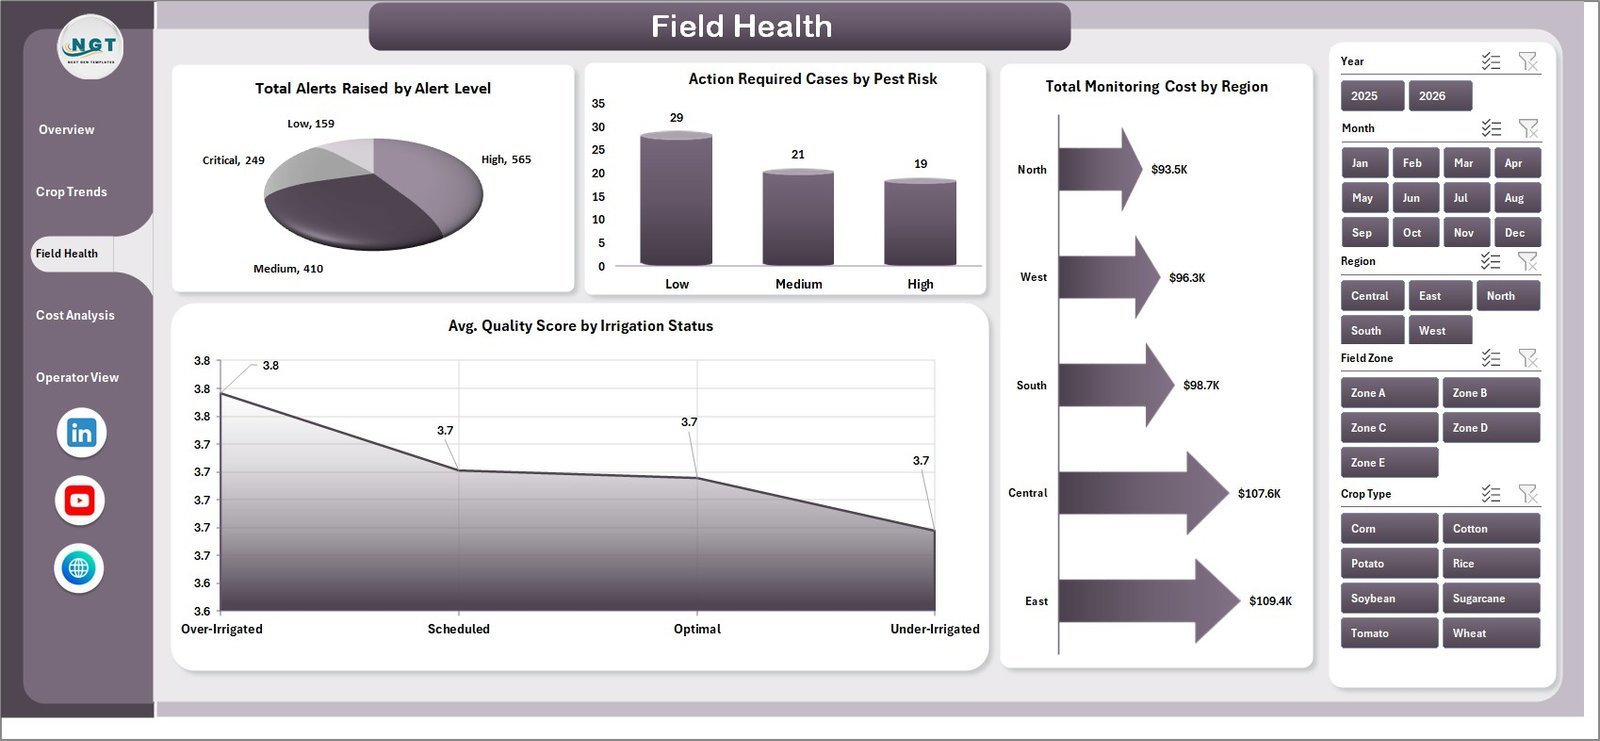
The Field Health page is built for monitoring crop condition and operational risk. It includes Total Alerts Raised by Alert Level, Action Required Cases by Pest Risk, Total Monitoring Cost by Region, and Avg. Quality Score by Irrigation Status.
4. Cost Analysis
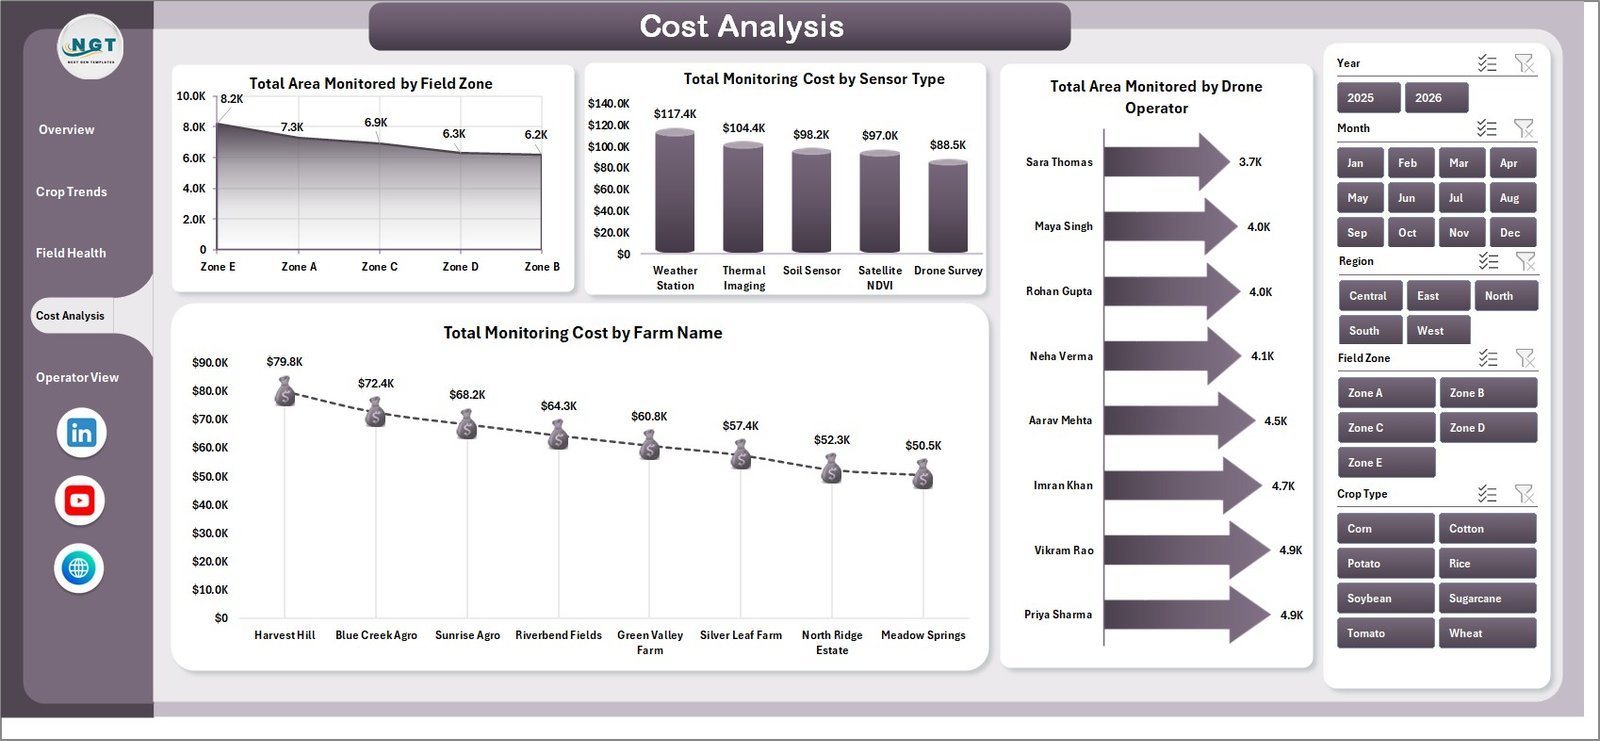
The Cost Analysis page helps finance and operations teams understand where monitoring resources are going. It includes Total Area Monitored by Field Zone, Total Monitoring Cost by Sensor Type, Total Area Monitored by Drone Operator, and Total Monitoring Cost by Farm Name.
5. Operator View
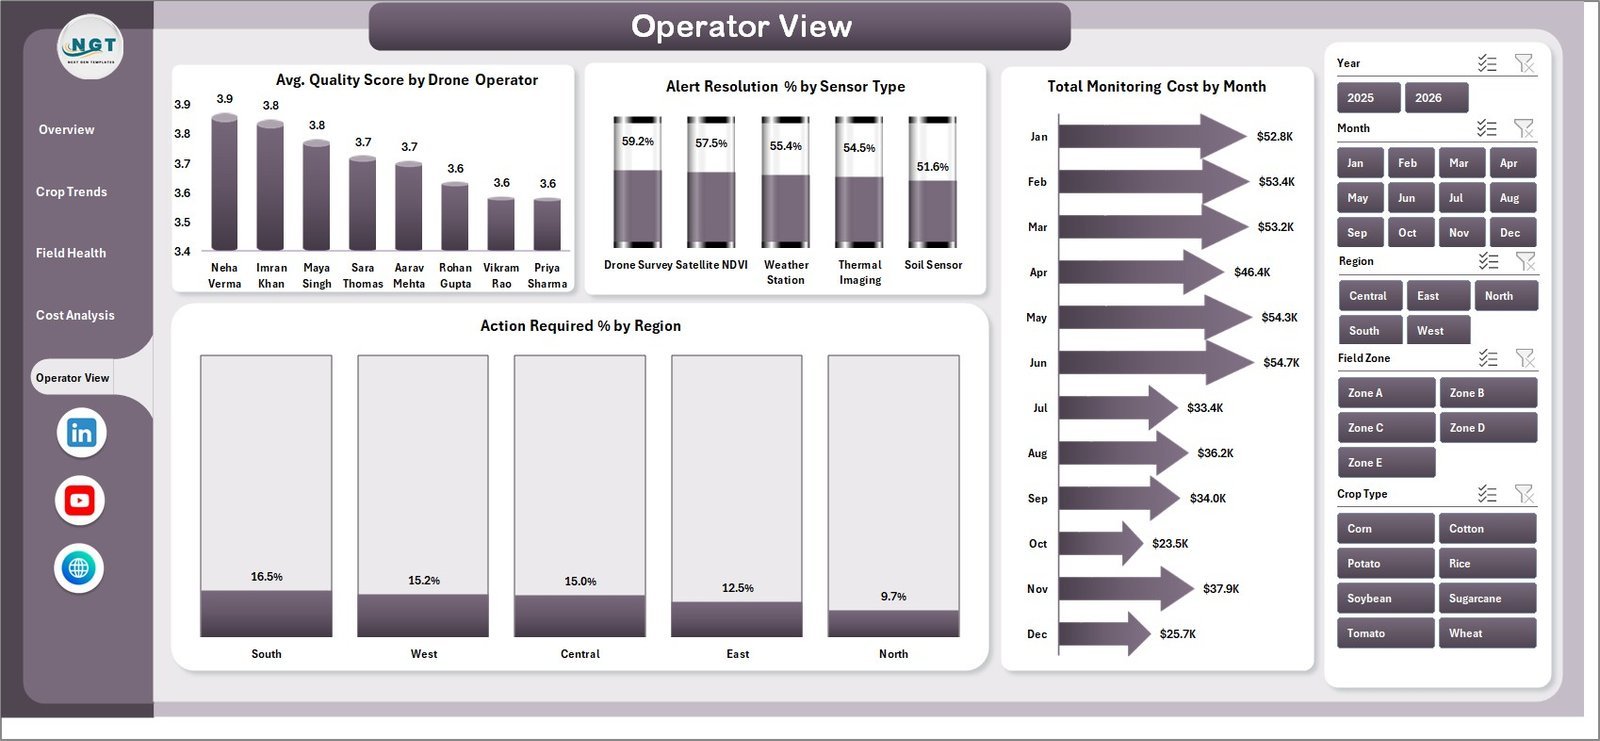
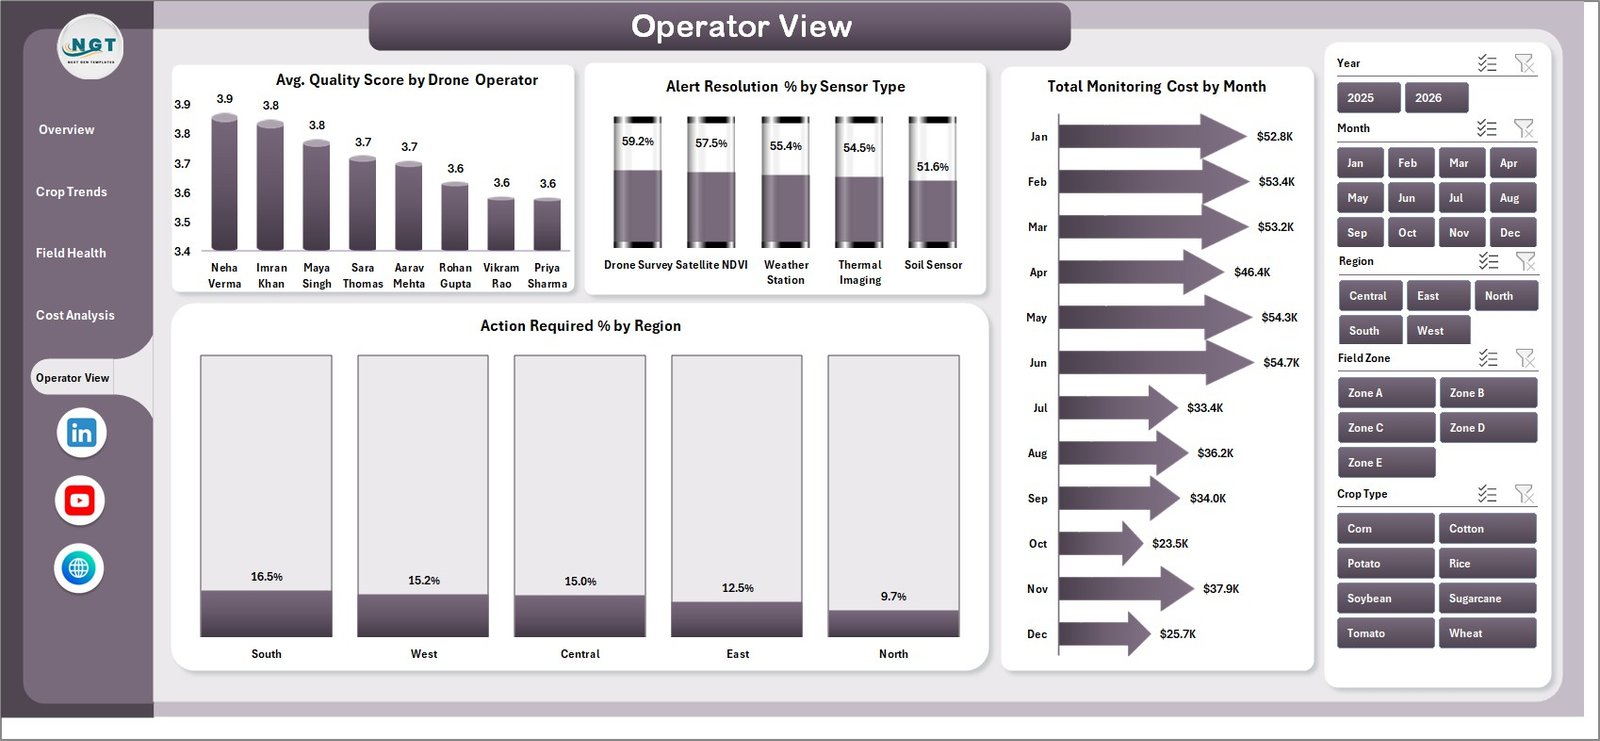
The Operator View page supports drone operator and field team review. It includes Avg. Quality Score by Drone Operator, Alert Resolution % by Sensor Type, Total Monitoring Cost by Month, and Action Required % by Region.
6. Data Sheet Tab
The Data sheet is where users add their own crop monitoring records in the same format as the sample data.

7. Support Sheet
The Support sheet contains the pivot tables that power the dashboard dynamically. After updating the Data sheet, users can go to the Excel Data ribbon and click Refresh All so pivots and charts update together. This sheet can be hidden during normal use.

Remote Crop Monitoring Dashboard in Excel vs. Google Sheets vs. Paid CRM/SaaS – Where This Fits
| Feature | This Excel dashboard | Google Sheets alternative | Paid farm SaaS |
|---|---|---|---|
| Cost | $17.99 one-time | Low tool cost but dashboard build is manual | Monthly or annual subscription |
| Platform | Microsoft Excel | Browser-based spreadsheet | Vendor cloud application |
| Setup time | Replace data and click Refresh All | Build formulas, pivots, and charts manually | Onboarding and configuration |
| Customizable fields | Editable workbook, data sheet, pivots, slicers, and charts | Editable but manual | Depends on vendor permissions |
| Year-1 cost at 5 users | $17.99 plus Microsoft licensing if needed | Low subscription cost plus build time | Often hundreds or thousands per year |
| Crop monitoring metrics | Area, yield, cost, alerts, quality, status, pest risk, irrigation, sensor, farm, region, and operator | Must be designed manually | Depends on reporting module |
Who This Template Is For – and Who It’s Not For
Best for: farm owners, agribusiness analysts, crop consultants, field supervisors, drone monitoring teams, regional agriculture managers, and operations teams that already use Excel for recurring reporting.
Not for: teams that need live drone control, satellite image processing, automated IoT ingestion, farm ERP workflows, pesticide recommendations, or a multi-user database application.
How to Use the Remote Crop Monitoring Dashboard in Excel
- Download and unzip the product file.
- Open the workbook in Microsoft Excel.
- Review the sample records in the Data sheet.
- Replace sample rows with your own crop monitoring data in the same format.
- Go to the Excel Data ribbon and click Refresh All.
- Use slicers to filter the dashboard by the fields relevant to your review.
- Keep the Support sheet hidden if users only need dashboards and data entry.
Real-World Use Cases
Anika, agribusiness manager: reviews monitored area, yield estimate, alert volume, and quality score before assigning the next monitoring schedule.
Rohan, crop consultant: uses Crop Trends and Field Health pages to explain pest risk, irrigation status, unresolved alerts, and crop quality during client reviews.
Meera, drone operations lead: compares monitoring cost, sensor type, operator quality score, and alert resolution percentage to balance field assignments.
Frequently Asked Questions
What does this dashboard track?
It tracks total area monitored, yield estimate, monitoring cost, alerts raised, quality score, monitoring status, alert level, pest risk, irrigation status, region, crop type, field zone, sensor type, farm name, and drone operator.
Do I need advanced Excel skills?
No. Replace the sample data and click Refresh All. Advanced users can also customize pivots, charts, slicers, and sheet layouts.
Can I use my own crop data?
Yes. Add your records to the Data sheet in the same structure and refresh the workbook.
Can I hide the Support sheet?
Yes. The Support sheet contains pivot tables and can be hidden after setup.
Is this a live drone monitoring system?
No. It is an Excel reporting dashboard for prepared crop monitoring data.
Is this a subscription?
No. It is a one-time downloadable Excel template.
About the Author
Built by PK – Microsoft Certified Professional with 15+ years of Excel, Google Sheets, and Power BI experience. Founder of NextGenTemplates, reaching 300K+ subscribers across YouTube channels. Every template is hand-built and tested before release.
Explore Related Templates
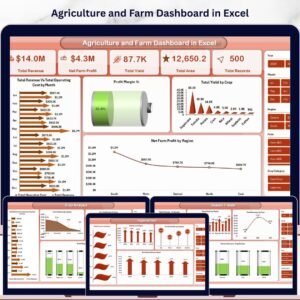
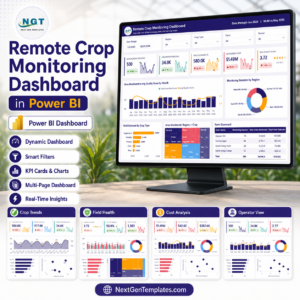
Pair this workbook with Remote Crop Monitoring Dashboard in Power BI, Drone Farming Startups Dashboard in Excel, Agriculture and Farm Dashboard in Excel, and Indoor Farming Systems Dashboard in Excel. Browse more Excel Dashboard templates and MS Excel templates.
Detailed blog post: Remote Crop Monitoring Dashboard in Excel.
Download the Remote Crop Monitoring Dashboard in Excel and start reviewing crop coverage, yield, health alerts, monitoring cost, quality, and operator performance in one editable workbook.
Last updated: August 3, 2026.