In today’s competitive environment, quality is non-negotiable. Customers expect consistent excellence, and businesses that fail to maintain high standards risk losing trust and revenue. That’s where the Quality Control Tracker in Google Sheets comes in — a simple, powerful, and ready-to-use solution to monitor, record, and analyze your QC activities in one centralized place.
Unlike paper-based logs or scattered spreadsheets, this tracker helps you organize inspections, monitor pass/fail status, assign accountability, and visualize trends with charts and summary cards. Designed for collaboration, it ensures everyone in your team can contribute and stay aligned in real time.
🔑 Key Features of the Quality Control Tracker
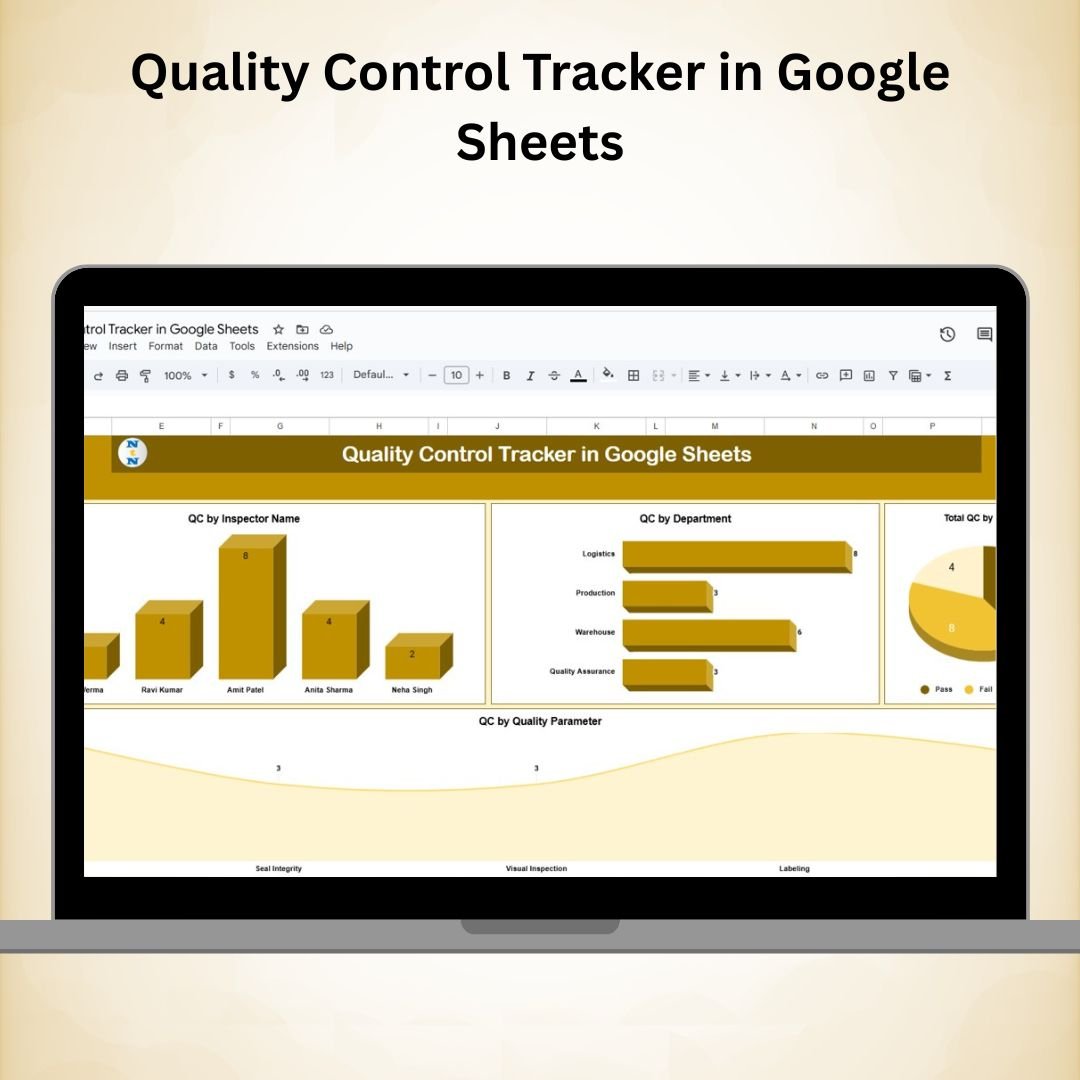
📊 Tracker Sheet Tab – Central Dashboard
Summary Cards for quick insights:
Total QC Activities
QC Passed
QC Failed
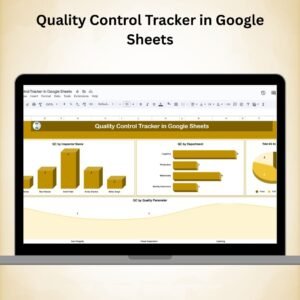
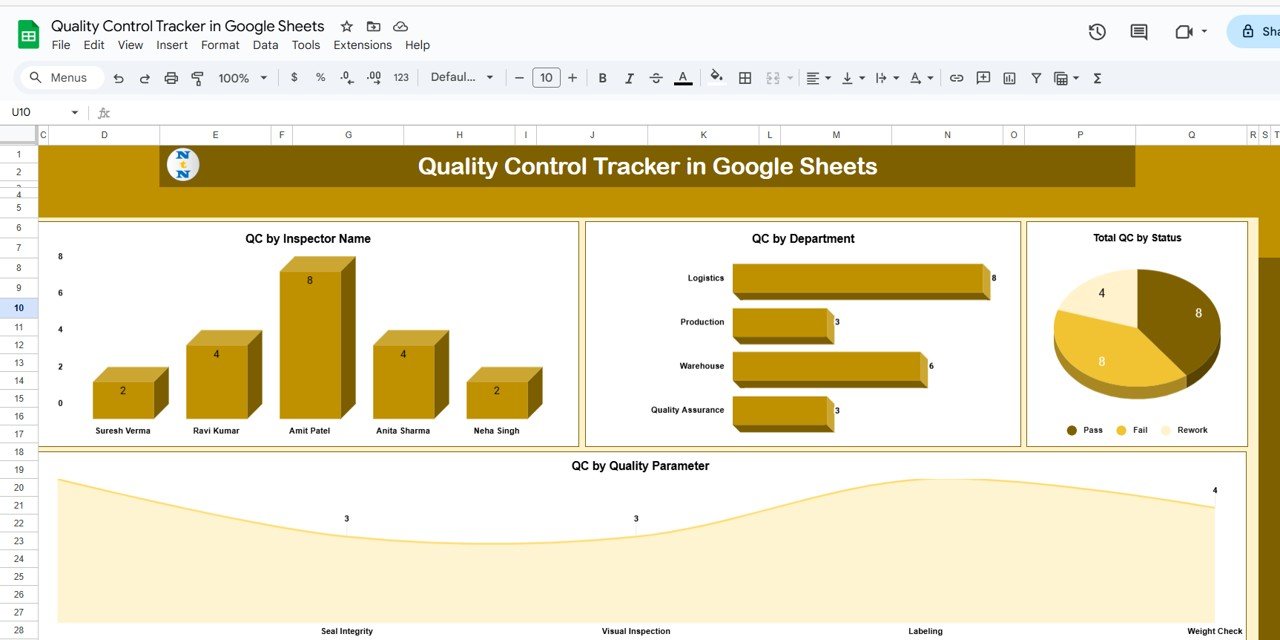
Charts for visual reporting:
QC by Inspector Name
QC by Department
Total QC by Status (Pass/Fail)
QC by Quality Parameter
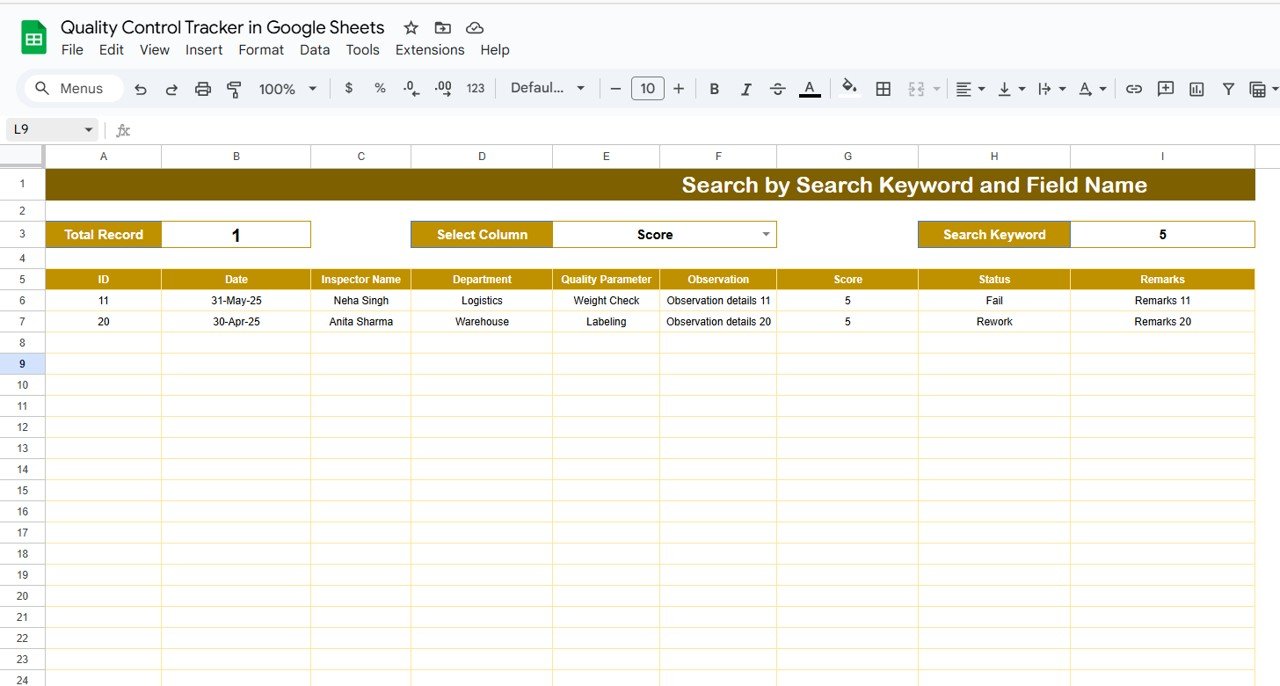
Search Functionality – Filter records by keyword and field name to quickly find inspection details
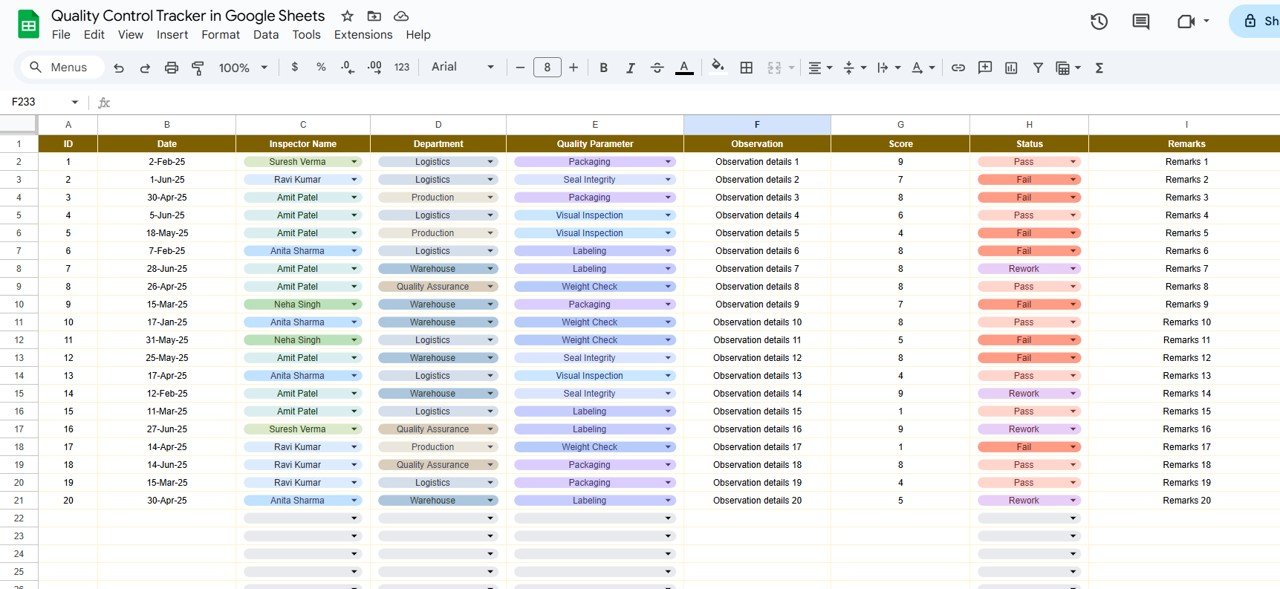
📋 Sample Data Columns in the Tracker
ID (unique identifier)
Date of Inspection
Inspector Name
Department
Quality Parameter (e.g., packaging, visual inspection)
Observation Notes
Score
Status (Pass/Fail)
Remarks
🗂 Data Sheet Tab – Backend Record Storage
All QC entries are automatically stored here
Pivot-table friendly format for deeper analysis
Ensures structured, reliable reporting
📦 What’s Inside the QC Tracker?
✅ Tracker Tab – Dashboard with cards, charts & search functionality
✅ Data Sheet – Backend storage of all inspection records
✅ Pre-Filled Sample Data – Demonstrates real use cases
✅ Visual Insights – Charts for pass/fail, department-wise, and inspector-wise tracking
✅ Search & Filter Tools – Locate any QC record instantly
✅ Customizable Layout – Add new parameters, departments, or metrics
🧠 How to Use the Quality Control Tracker
Log Inspections – Enter QC activities into the Tracker tab
Update Status – Mark inspections as Pass/Fail with observations and scores
Review Dashboard – Use cards & charts to track QC trends
Search & Filter – Instantly find inspections by name, department, or date
Analyze Trends – Use the Data Sheet for pivot tables and advanced reporting
Share & Collaborate – Let multiple team members update QC data in real time
👥 Who Can Benefit from This Tracker?
🏭 Manufacturing Companies – Monitor product inspections and packaging quality
🚚 Logistics Teams – Ensure shipment and delivery standards are met
📊 Quality Assurance Departments – Centralize inspection records and reporting
🏢 Small Businesses – Affordable quality tracking without expensive tools
🎓 Institutions & Labs – Track project or equipment quality checks
⭐ Advantages of Using the Quality Control Tracker
📑 Centralized Data Management – All QC records in one place
📊 Visual Reporting – Charts highlight trends and problem areas
👥 Improved Accountability – Assign tasks by inspector & department
⏱ Time-Saving – Avoid manual logs and scattered files
🔄 Collaboration-Friendly – Multiple users can update in real time
🛠 Customizable – Add new parameters, KPIs, or metrics
💡 Data-Driven Decisions – Identify issues early and improve processes