

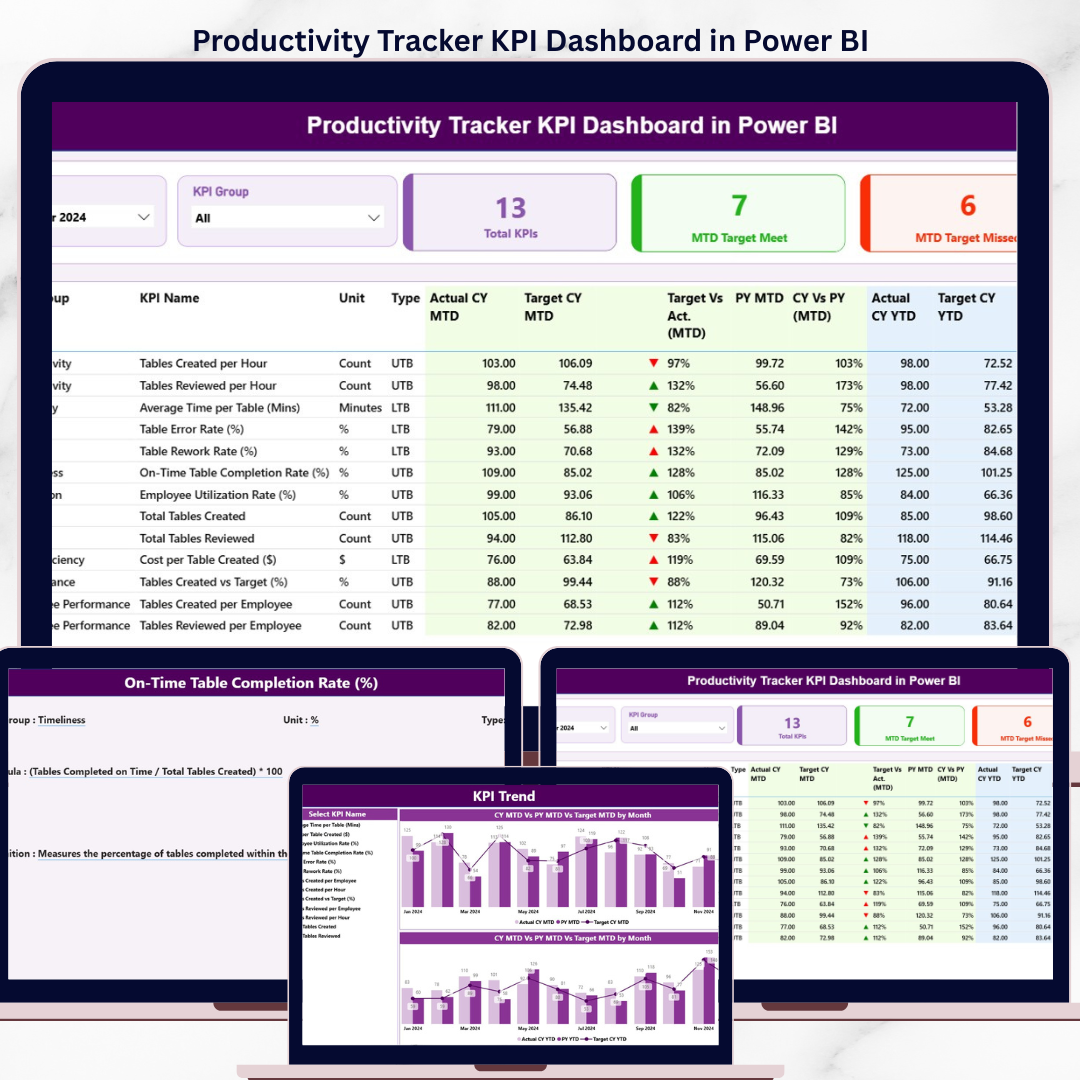

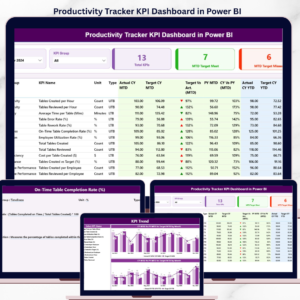
The Productivity Tracker KPI Dashboard in Power BI tracks employee and team productivity KPIs across 3 interactive report pages, with MTD and YTD scoring against targets and prior-year actuals. Setup takes under 10 minutes — fill the 3 Excel input sheets and every visual updates automatically.
🌍 Join 10,000+ customers in 180+ countries using NextGenTemplates to replace paid SaaS tools with one-time-purchase Excel, Google Sheets, Power BI, and HTML templates.
✅ Instant download · One-time payment · No subscription · No per-user fees · Lifetime access
🔑 Key Features of the Productivity Tracker KPI Dashboard
Built in Power BI Desktop, this dashboard delivers a KPI scoreboard, trend analysis, and KPI metadata drill-throughs from a single Excel source file. The dashboard tracks productivity KPIs by Month, KPI Group, and KPI Type (LTB — Lower the Better, or UTB — Upper the Better) with automatic MTD vs target and CY vs PY comparisons.
📌 3 connected report pages: Summary scoreboard, KPI Trend view, and a hidden KPI Definition drill-through page — all in one .pbix file.
📌 Two slicers, two scopes: Month and KPI Group filters on the Summary page; KPI Name slicer on the KPI Trend page. Selections cascade through cards, tables, and combo charts in real time.
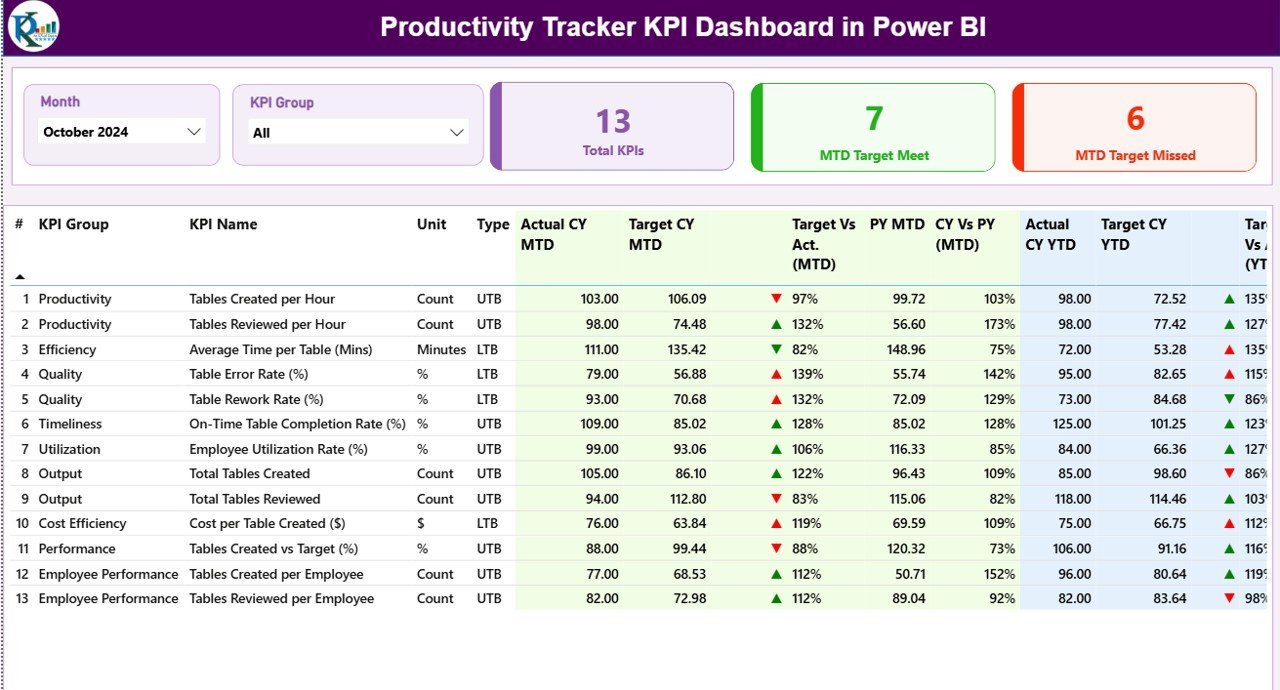
📌 Direction-aware status icons: Red ▼ and green ▲ icons show MTD and YTD status against targets, automatically flipping logic for LTB metrics versus UTB metrics.
📌 16-column KPI scoreboard covering KPI Number, Group, Name, Unit, Type, Actual CY MTD, Target CY MTD, MTD Icon, Target vs Actual MTD %, PY MTD, CY vs PY MTD %, plus the same 6 columns at YTD scope.
📌 Excel-driven data model: All values come from 3 worksheets — Input_Actual, Input_Target, and KPI Definition. Replace sample rows with your own and the entire report refreshes.
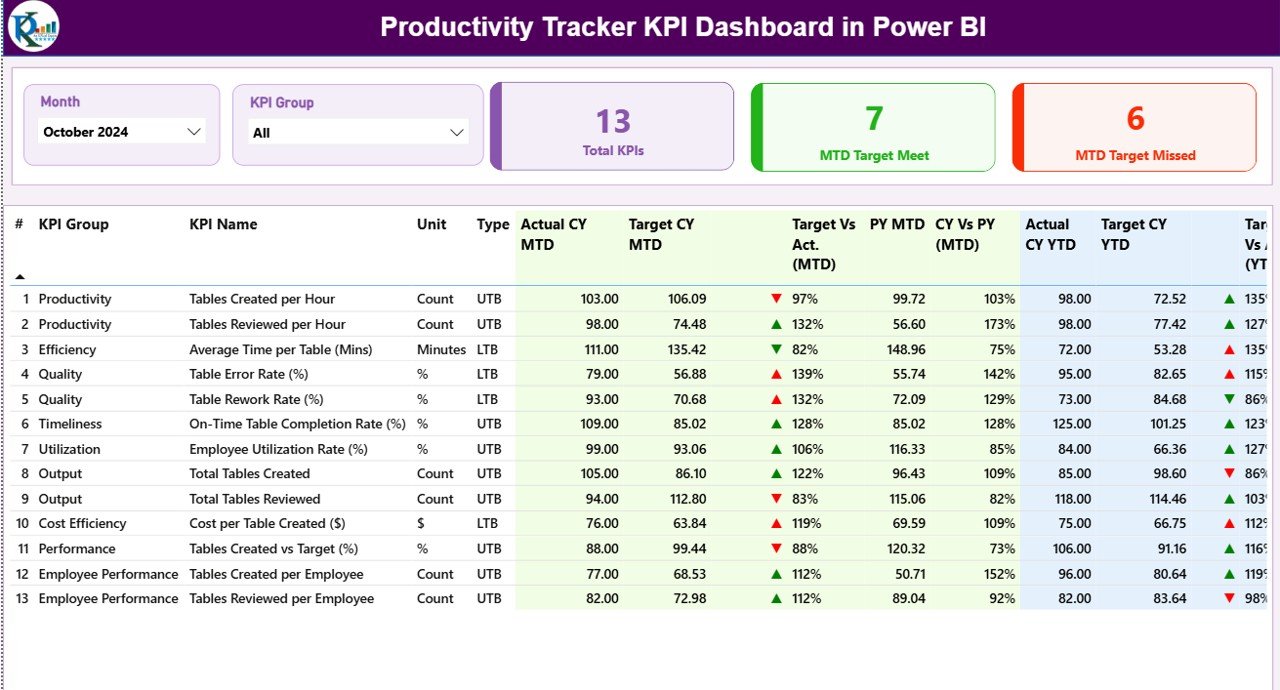
Summary Page — Month and KPI Group slicers, 3 KPI count cards, and the 16-column scoreboard with MTD and YTD status icons.
📦 What’s Inside the Productivity Tracker KPI Dashboard
Page 1: Summary Page — The main scoreboard. The top of the page carries the Month slicer and KPI Group slicer. Three cards show Total KPIs count, MTD Target Met count, and MTD Target Missed count. Below them, the KPI table lists every metric with KPI Number, Group, Name, Unit, Type (LTB / UTB), Actual CY MTD, Target CY MTD, MTD status icon, Target vs Actual MTD %, PY MTD, CY vs PY MTD %, Actual CY YTD, Target CY YTD, YTD status icon, Target vs Actual YTD %, PY YTD, and CY vs PY YTD %.
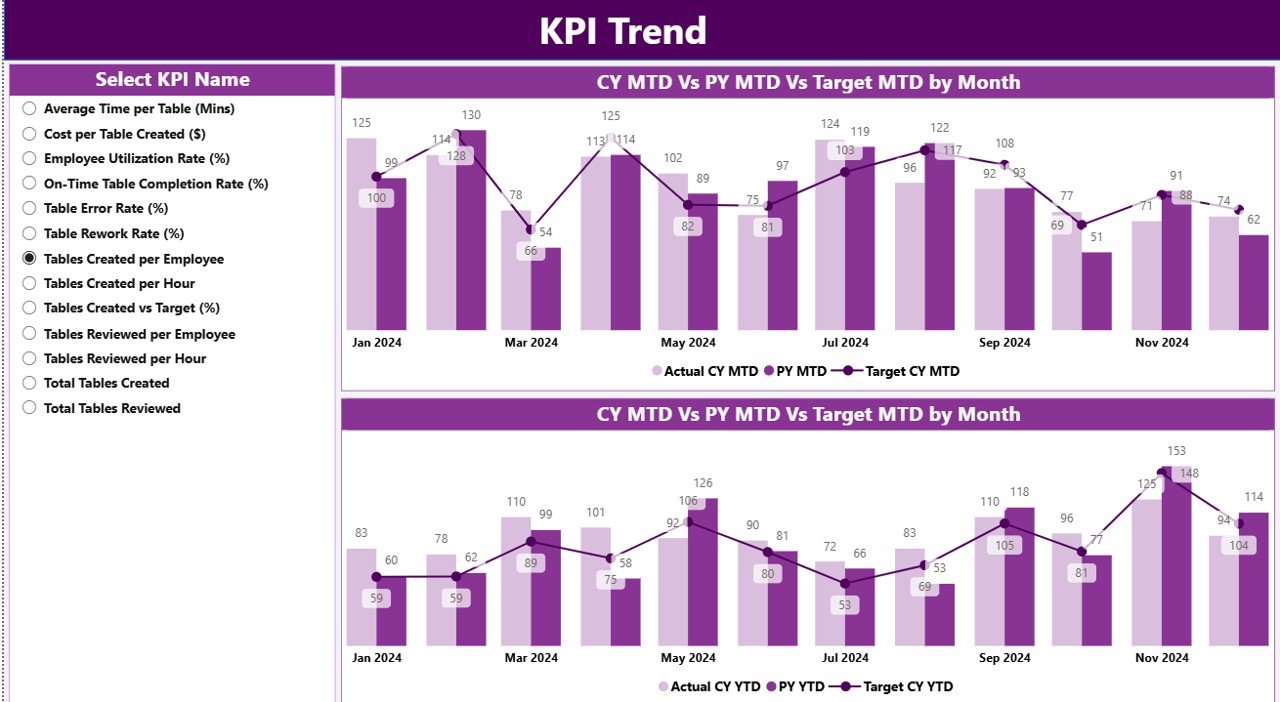
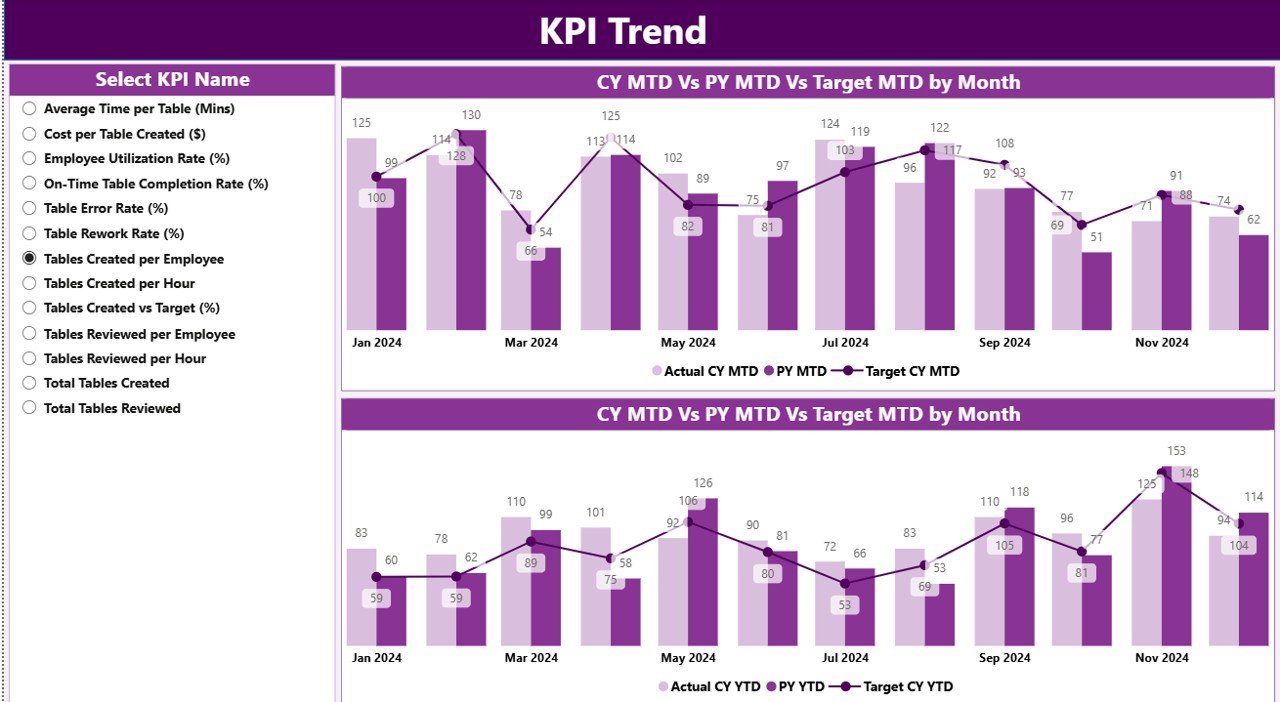
KPI Trend Page — Two combo charts comparing CY Actual, PY Actual, and Target for MTD and YTD, filtered by the KPI Name slicer.
Page 2: KPI Trend Page — A trend view for any selected KPI. The left-hand KPI Name slicer drives 2 combo charts: one shows MTD Actual CY, Actual PY, and Target month-over-month; the other shows the same series for YTD. This is where you spot whether a KPI is improving or sliding.
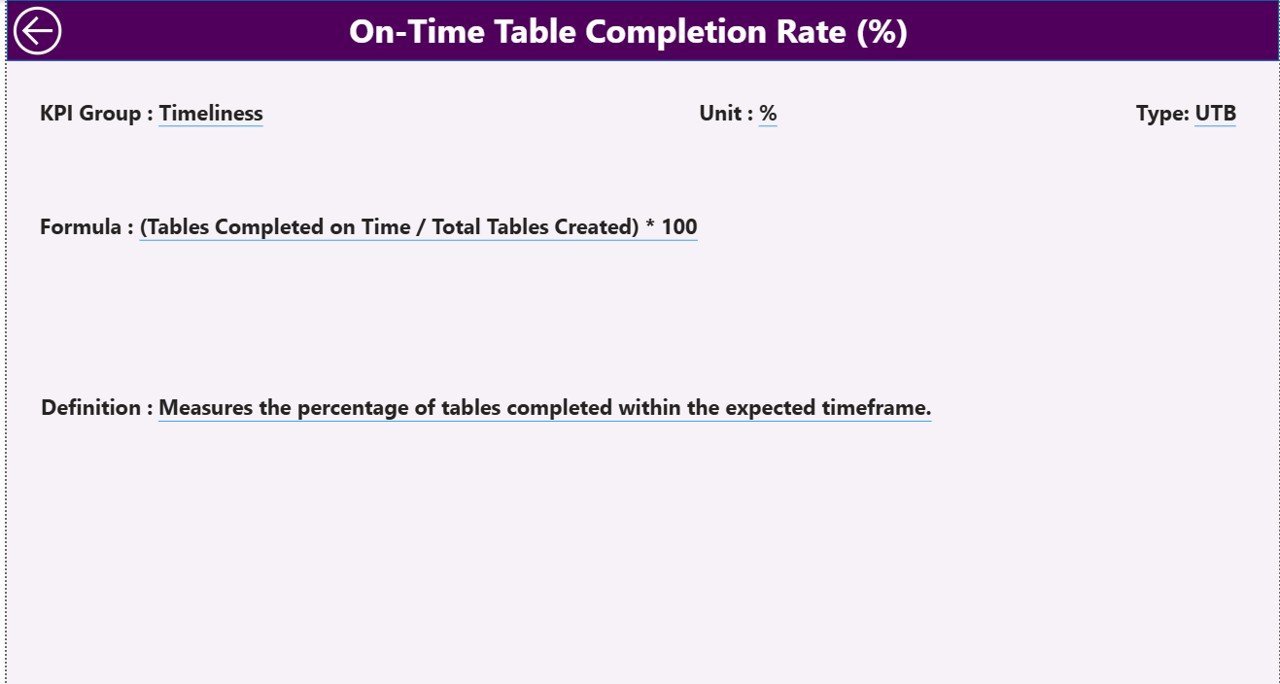
Page 3: KPI Definition Page (Drill-Through, Hidden) — A reference page hidden from normal navigation. Right-click any KPI on the Summary page and choose Drill-through → KPI Definition to see that KPI’s Number, Group, Name, Unit, Formula, Definition, and Type. A back button in the top-left corner returns you to the Summary page.
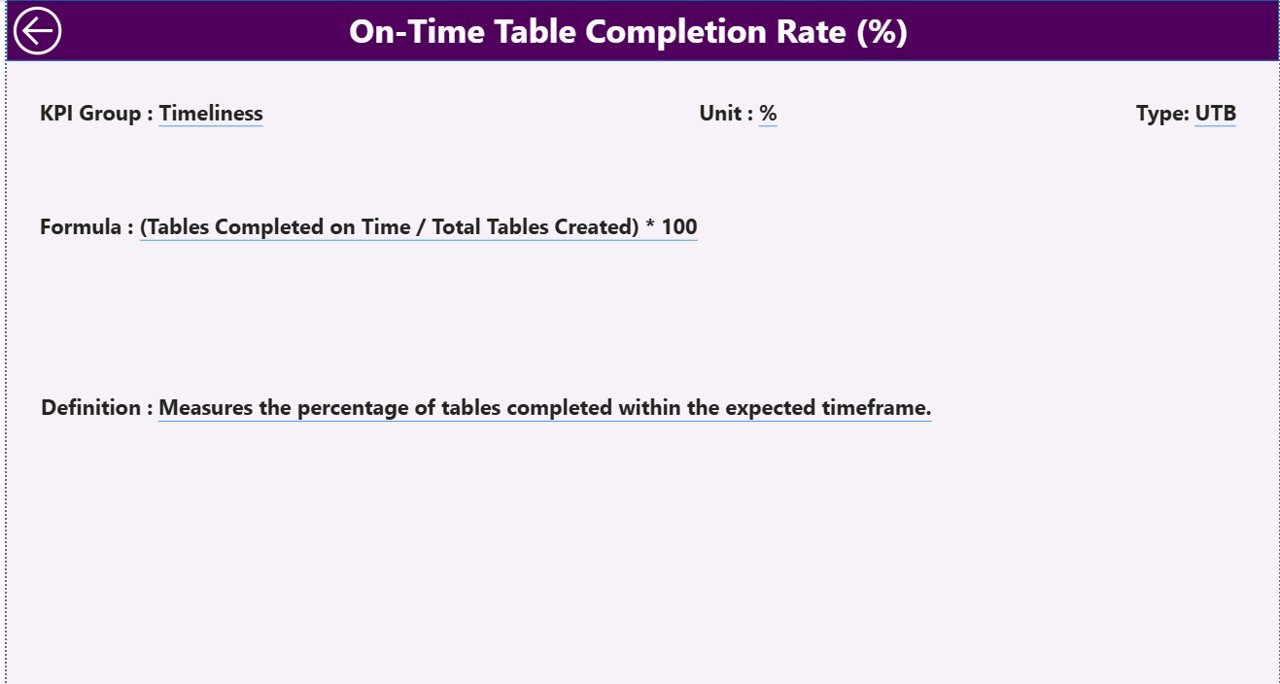
KPI Definition Page — Hidden drill-through showing KPI Number, Group, Name, Unit, Formula, Definition, and Type for the selected metric.
Excel Data Source — 3 input worksheets
📁 Input_Actual: Fill the Actual numbers per KPI Name, Month (first date of the month), MTD value, and YTD value.
📁 Input_Target: Fill the Target numbers per KPI Name, Month (first date of the month), MTD target, and YTD target.
📁 KPI Definition: Fill KPI Number, Group, Name, Unit, Formula, Definition, and Type (LTB or UTB).
📊 Productivity Tracker KPI Dashboard vs. Tableau/Qlik vs. 15Five/Lattice — Where This Fits
| Feature | Productivity Tracker KPI Dashboard (Power BI) | Tableau / Qlik Sense | 15Five / Lattice / Workday Productivity |
|---|---|---|---|
| Cost | $11.99 one-time | $15-75 / user / month | $8-15 / user / month |
| Platform | Power BI Desktop (free) | Tableau Desktop / Server / Cloud | Cloud SaaS only |
| Setup time | Under 10 minutes | 2-6 weeks | 1-3 weeks (HRIS integration) |
| MTD vs YTD vs PY comparison | ✅ Built in | Custom build required | Limited — depends on plan |
| LTB / UTB direction-aware icons | ✅ Pre-configured | Custom calc required | Not configurable |
| Drill-through KPI definitions | ✅ Built in | ✅ Manual setup | ❌ Not available |
| Customizable fields | ✅ Full Excel control | ✅ Full control | ❌ Locked schema |
| Year-1 cost at 5 users | $11.99 total | $900-4,500 | $480-900 |
| Data ownership | Your local file | Cloud or on-prem | Vendor-hosted only |
For teams that want a productivity scoreboard with MTD/YTD scoring without paying $480-4,500 per year, the Productivity Tracker KPI Dashboard sits in the sweet spot.
👥 Who This Template Is For — and Who It’s Not For
✅ This template is built for:
- Team leads and managers tracking 8-30 productivity KPIs across departments or shifts
- HR analytics, Operations, and Project Management teams reporting monthly to leadership
- Small-to-mid-sized companies (10-500 employees) replacing paid productivity SaaS
- BI consultants and freelancers needing a starter Power BI report to white-label for clients
- Department heads who want one .pbix file showing MTD, YTD, and prior-year comparisons
❌ This template is NOT for:
- Real-time time-tracking — this is a periodic KPI scoreboard, not a stopwatch tool
- Teams needing automated payroll integration or HRIS sync (use BambooHR or Workday)
- Anyone without Power BI Desktop installed (free download, Windows-only)
- Enterprise users requiring SOC 2 audit trails on the visual layer
⚙️ How to Use the Productivity Tracker KPI Dashboard
- Download the .zip file and extract the Excel data source plus the .pbix Power BI report.
- In the Excel KPI Definition sheet, list your KPI Number, Group, Name, Unit, Formula, Definition, and Type (LTB or UTB).
- In the Input_Actual sheet, enter monthly Actual MTD and YTD values for each KPI Name and Month (first date of each month).
- In the Input_Target sheet, enter monthly Target MTD and YTD values for the same KPIs and months.
- Open the .pbix file in Power BI Desktop and click Refresh — the Summary, KPI Trend, and KPI Definition pages update from the Excel source.
- Use the Month and KPI Group slicers on the Summary page; use the KPI Name slicer on the KPI Trend page to drill into one metric.
- Right-click any KPI row and choose Drill-through → KPI Definition to view formulas; click the back button to return.
💼 Real-World Use Cases
Priya leads operations at a 120-person BPO in Pune. She tracks 14 productivity KPIs — calls per agent, average handle time, first-call resolution, schedule adherence, quality score. She uses the Productivity Tracker KPI Dashboard to publish a monthly scorecard to her CEO showing which KPIs hit MTD and YTD targets, without paying $12 per agent per month for a workforce-management SaaS.
Marcus is the People Analytics lead at a 60-person SaaS company in Austin. His team monitors engineering productivity (PRs merged, deployment frequency, defect rate) plus customer-success productivity (tickets resolved, CSAT, time-to-first-response). He hands the .pbix file to each team lead so they can self-serve their KPI Trend page.
Anita runs HR for a 35-person consulting firm in London. She tracks consultant productivity — utilization %, billable hours, project margin, CSAT — for her quarterly board pack. The drill-through KPI Definition page lets non-technical board members see exactly how each metric is calculated.
❓ Frequently Asked Questions
What KPIs does the Productivity Tracker KPI Dashboard track?
The Productivity Tracker KPI Dashboard is metric-agnostic — you define KPIs in the Excel KPI Definition sheet. Common metrics include utilization %, output per hour, schedule adherence, first-pass yield, ticket resolution rate, and billable hours. Each KPI carries a Type (LTB / UTB) so status icons flip correctly.
How does this compare to 15Five or Lattice?
15Five and Lattice charge $8-15 per user per month and lock you into their KPI schema. The Productivity Tracker KPI Dashboard is $11.99 one-time, runs in free Power BI Desktop, and lets you define any KPI via the Excel input sheets. There are no per-user fees or annual renewals.
How long does setup take?
Under 10 minutes if your KPIs are already documented. Open the Excel file, paste your KPI Definition rows, fill the Input_Actual and Input_Target sheets, then open the .pbix file and click Refresh. The Summary, KPI Trend, and KPI Definition pages populate automatically.
Can I add more than 12 months of data?
Yes. The Input_Actual and Input_Target sheets accept any number of monthly rows — keep the first date of each month in the Month column. The Productivity Tracker KPI Dashboard’s Month slicer lists every month present in the data, so multi-year comparisons are supported.
Does this work on Mac?
Power BI Desktop is Windows-only as of 2026. Mac users can run Power BI on Windows VMs (Parallels, VMware Fusion) or use Power BI Service in a browser after publishing the .pbix file. The Excel data source itself works on Mac Excel.
Can I customize the visuals or colors?
Yes. The Productivity Tracker KPI Dashboard ships as an open .pbix file with no locked elements. Edit colors, fonts, page theme, slicer style, and chart types directly in Power BI Desktop. The drill-through page logic and Excel-driven data model continue to work after restyling.
Is there a back button to leave the KPI Definition page?
Yes. The hidden KPI Definition drill-through page includes a back button in the top-left corner. Click it to return to the Summary page so end-users don’t get stuck on the metadata view when they only wanted to check one KPI’s formula.
👤 About the Author
Built by PK — Microsoft Certified Professional with 15+ years of Excel, Google Sheets, and Power BI experience. Founder of NextGenTemplates, reaching 300K+ subscribers across YouTube channels (@PK-AnExcelExpert, @NextGenTemplates, @NeoTechNavigators). Every template is hand-built and tested before release.
🔗 Explore Related Templates
Looking for related ready-made Power BI Dashboard Templates? Try these companion KPI scoreboards:
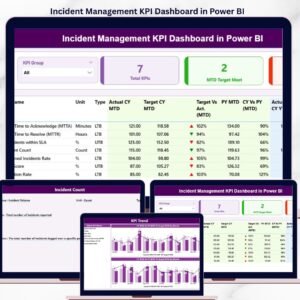
- Incident Management KPI Dashboard in Power BI — same MTD/YTD pattern, focused on IT and operations incidents.
- Crisis Response KPI Dashboard in Power BI — monitor crisis response time, communication, and resolution KPIs.
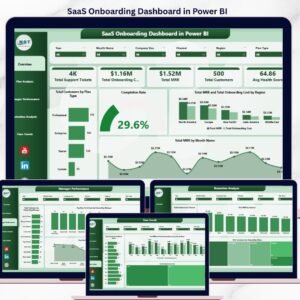
- SaaS Onboarding Dashboard in Power BI — track onboarding and time-to-value productivity for customer-success teams.
- Corporate Skill Hubs KPI Dashboard in Excel — Excel alternative for L&D productivity tracking.
- Workforce Engagement Dashboard in Google Sheets — sister template for employee engagement.
💎 Save 35% — Get all 10 templates in the HR & Workforce Analytics Bundle (Excel + Google Sheets + Power BI) →
Browse the full KPI Dashboard in Power BI collection or our HR & Payroll Templates hub.
📖 Click here to read the Detailed Blog Post
🎥 Visit our YouTube channel for step-by-step video tutorials
👉 YouTube.com/@NextGenTemplates
📅 Last updated: May 2026
Compatibility and Requirements
- Works in Power BI Desktop, which is free. You also need Excel to edit the three input sheets that feed the report. Microsoft explains the download in Get Power BI Desktop.























Reviews
There are no reviews yet.