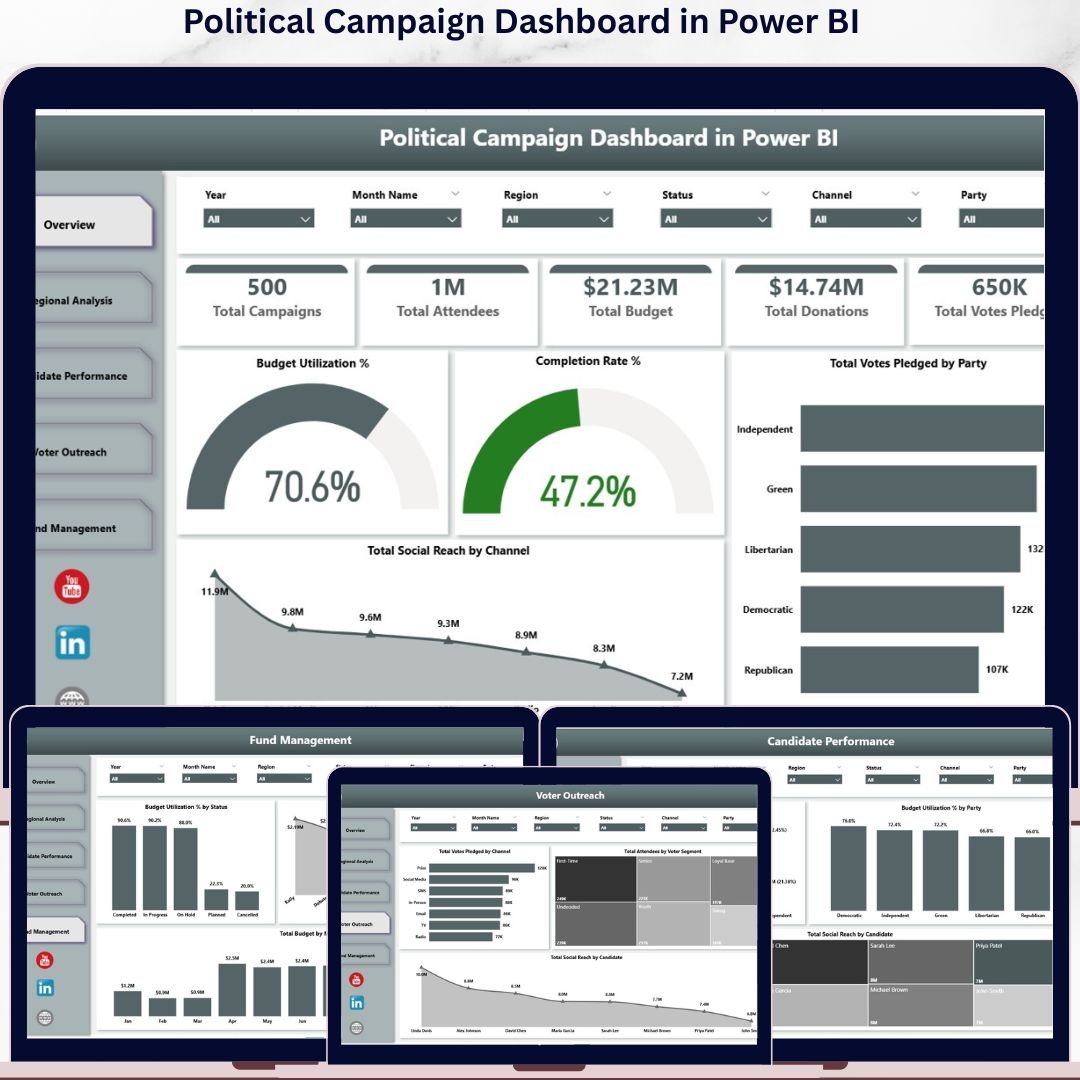
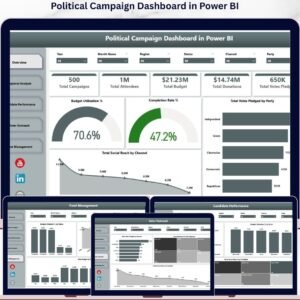
The Political Campaign Dashboard in Power BI tracks 5 high-level KPI cards (Total Campaigns, Total Attendees, Total Budget, Total Donations, Total Votes Pledged) across 5 interactive dashboard pages with 16+ pre-built charts and cross-filter slicers. Setup takes under 10 minutes — replace the sample dataset in Power Query and every visual refreshes automatically.
🌍 Join 8,400+ teams in 40+ countries using Nextgen Templates to replace paid SaaS tools with one-time-purchase Excel, Google Sheets, Power BI, and HTML templates. According to the U.S. Federal Election Commission, U.S. political committees raised over $15.9 billion in the 2024 election cycle — making real-time, data-driven campaign management a non-negotiable advantage.
✅ Instant download · One-time payment · No subscription · No per-user fees · Lifetime access
🔑 Key Features of Political Campaign Dashboard in Power BI
This Power BI dashboard tracks 5 headline KPI cards on the Overview page — Total Campaigns, Total Attendees, Total Budget, Total Donations, and Total Votes Pledged — plus 11 cross-page analytical visuals including Budget Utilization %, Completion Rate %, Total Social Reach by Channel, Total Votes Pledged by Party, and Net spend by Campaign Type.
Five fully interactive report pages — Overview, Regional Analysis, Candidate Performance, Voter Outreach, and Fund Management — are linked through slicers for Party, Region, Candidate, Voter Segment, and Campaign Type. Click any slicer and the entire dashboard re-filters in milliseconds, so a state director can drill from a 50-constituency overview down to a single candidate’s social reach in two clicks.
Built on Power BI Desktop’s free engine with no premium capacity, gateway, or per-user licensing required. The .pbix file is fully unlocked — replace the sample dataset, edit the DAX measures, rebrand colors to your party palette, and publish to Power BI Service or share the .pbix directly with your treasurer, candidate, or PAC.
📦 What’s Inside the Political Campaign Dashboard in Power BI
This Power BI dashboard template features 5 professionally designed report pages covering every dimension of political campaign analytics — from rally attendance and donor revenue to constituency-level votes pledged and audit-ready treasury tracking.
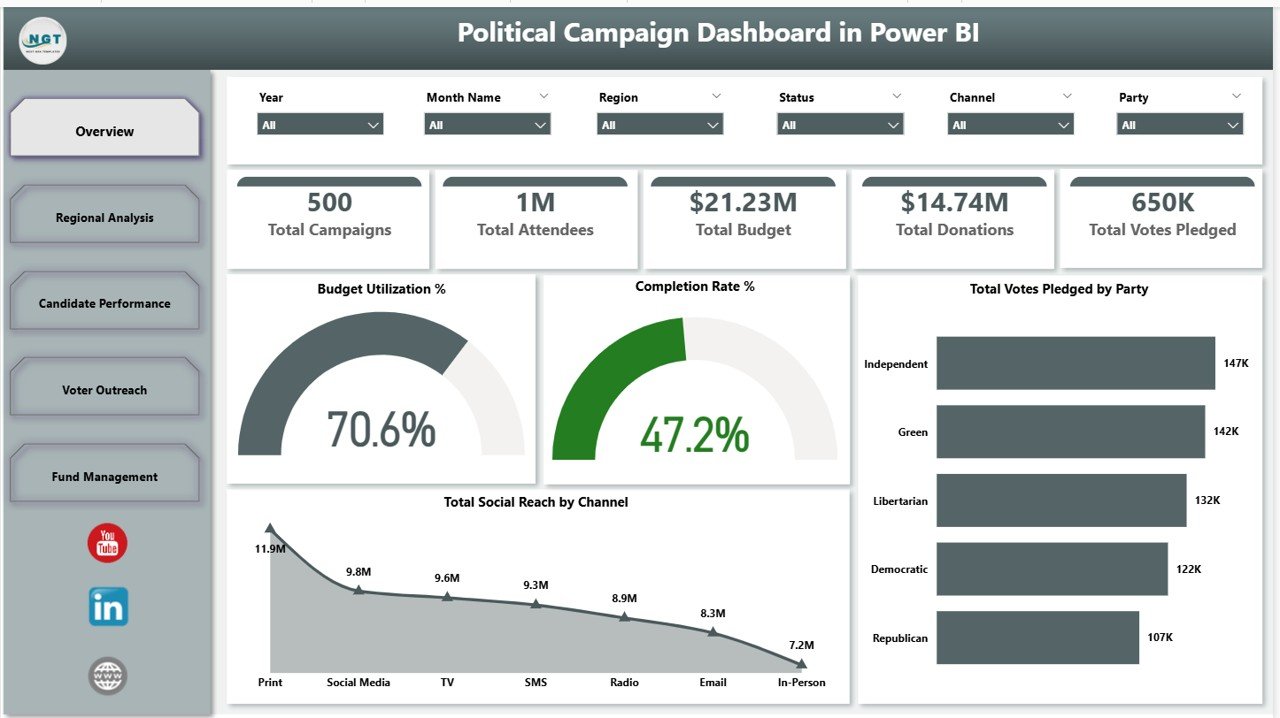
Page 1: Overview
The high-level command center. Five KPI cards across the top — Total Campaigns, Total Attendees, Total Budget, Total Donations, Total Votes Pledged — paired with four headline visuals: Budget Utilization % (gauge), Completion Rate % (gauge), Total Votes Pledged by Party (column chart), and Total Social Reach by Channel (donut). Slicers on the right let leadership filter the entire report by Party, Region, Candidate, and Campaign Type for an instant strategic snapshot.
 Political Campaign Dashboard in Power BI
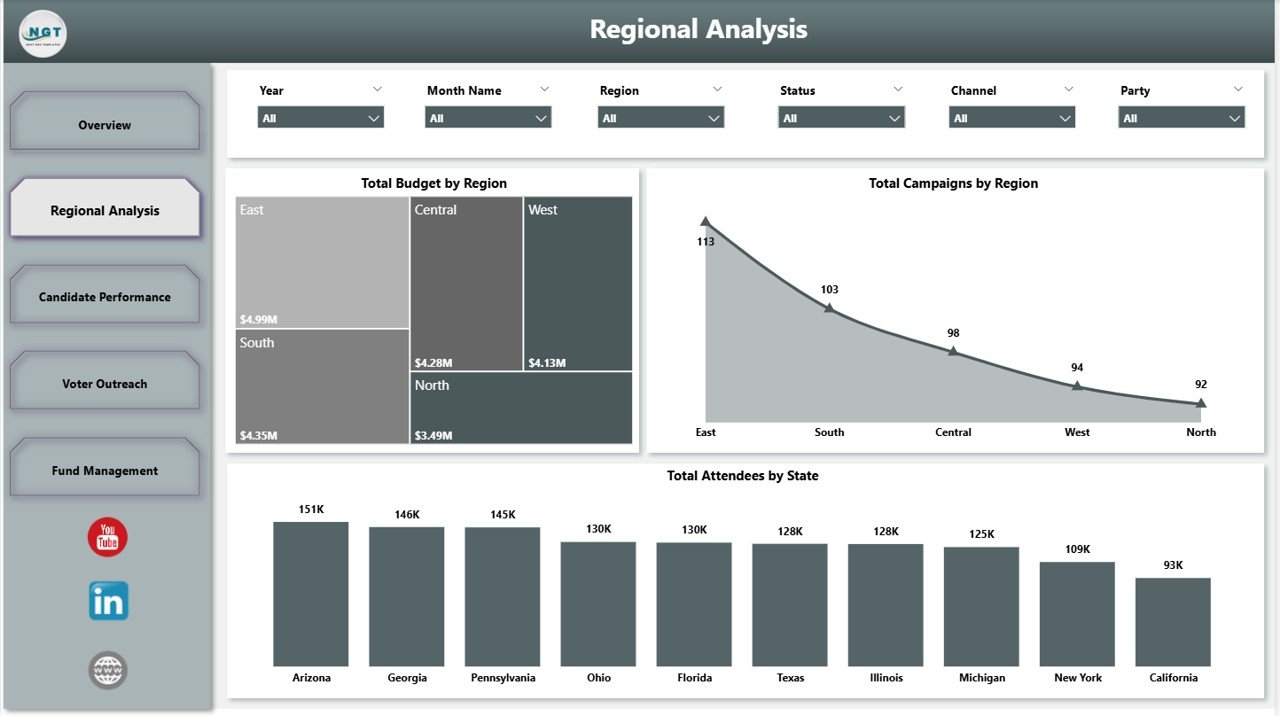
Page 2: Regional Analysis
Geographic performance breakdown. Visuals include Total Budget by Region (bar chart), Total Campaigns by Region (column chart), and Total Attendees by State (map visual). Identify which regions over-perform on attendance, where budget is concentrated, and where to redirect field staff for maximum electoral lift.
 Regional Analysis
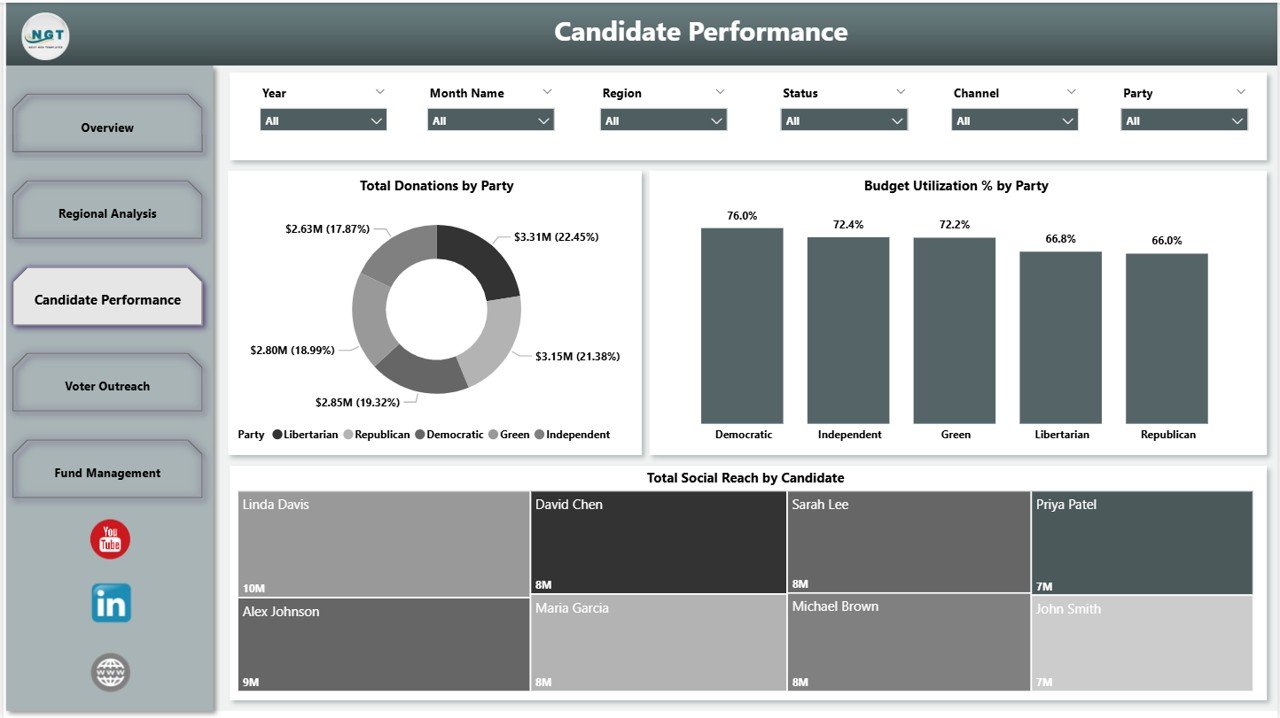
Page 3: Candidate Performance
Per-candidate and per-party scorecards. Visuals include Total Donations by Party (column), Budget Utilization % by Party (clustered bar), and Total Social Reach by Candidate (horizontal bar). See which candidates resonate with donors and voters, and which need strategic treasury reinforcement.
 Candidate Performance
Page 4: Voter Outreach
Voter engagement analytics. Visuals include Total Votes Pledged by Channel (donut), Total Attendees by Voter Segment (column), and Total Social Reach by Candidate (bar). Optimize outreach tactics by demographic and channel to lift pledged-vote conversion rates in the final 30 days.
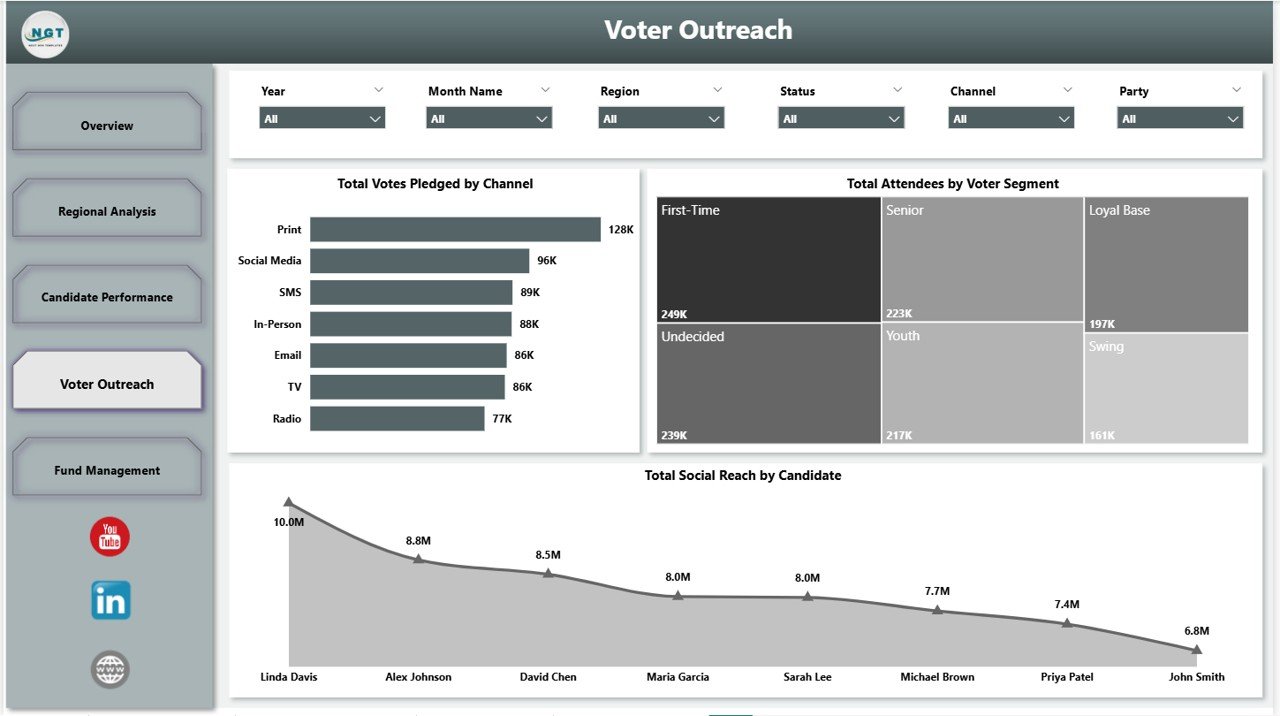 Voter Outreach
Page 5: Fund Management
Campaign treasury and audit-readiness view. Visuals include Budget Utilization % by Status (clustered column), Total Amount Spent by Campaign Type (bar), and Total Budget by Month Name (line). Spot overspending early, support FEC quarterly filings, and defend audit-ready expense trails by month and campaign category.
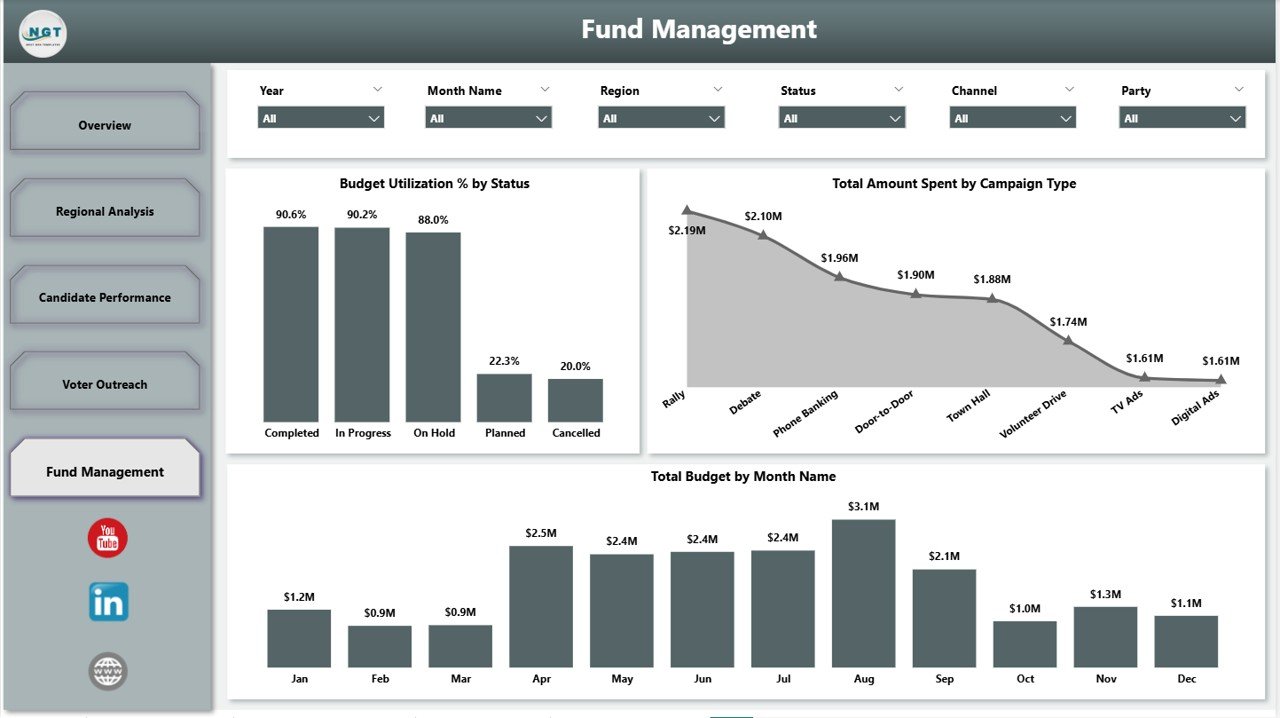 Fund Management
📊 Political Campaign Dashboard in Power BI vs. Tableau / Qlik vs. NGP VAN / Nation Builder — Where This Fits
| Feature | Political Campaign Dashboard in Power BI | Tableau / Qlik Sense | NGP VAN / Nation Builder / Salesforce for Nonprofits |
|---|---|---|---|
| Cost | $17.99 one-time (lifetime) | $70 – $1,200 per user / year | $50 – $500+ per month |
| Platform | Power BI Desktop (free) | Tableau Desktop / Qlik Sense | Proprietary SaaS |
| Setup time | Under 10 minutes | 1 – 3 days (build from scratch) | 2 – 8 weeks |
| Pre-built campaign KPIs | ✅ 5 cards + 11 visuals out-of-box | ❌ Build your own | ✅ But CRM-focused, not analytics-first |
| Cross-filter slicers | ✅ Party · Region · Candidate · Segment · Campaign Type | ✅ With manual setup | Limited (vendor UI) |
| Customizable visuals | Full (.pbix unlocked) | Full | Limited (vendor-controlled) |
| Mobile access | ✅ Power BI Mobile (iOS / Android) | ✅ Tableau Mobile | ✅ Web + mobile |
| Voter file integration | Manual import via Power Query | Manual import | Native (state voter files) |
| Year-1 cost at 5 users | $17.99 | $350 – $6,000 | $3,000 – $30,000+ |
For teams that want enterprise-grade campaign analytics without paying enterprise-grade subscription fees, the Political Campaign Dashboard in Power BI sits in the sweet spot — production-ready visuals on day one, full DAX control when you need it.
👥 Who This Template Is For — and Who It’s Not For
✅ This template is built for:
- State and parliamentary campaign managers running 10 – 100 constituency races
- Party organizers tracking 5 – 50 candidates across donations, votes pledged, and budget
- Campaign treasurers and PAC managers preparing audit-ready financial reports
- Political consultants delivering Power BI dashboards to candidates, parties, and PACs
- Civic-tech and political-tech startups building reporting layers for their clients
❌ This template is NOT for:
- National presidential campaigns managing 1M+ voter records (use NGP VAN or NationBuilder for voter-file-native CRM)
- Teams that require automated SMS / email blasts — this is an analytics dashboard, not a CRM
- Users who do not want to install Power BI Desktop (consider our Political Campaign Dashboard in Excel instead)
⚙️ How to Use the Political Campaign Dashboard in Power BI
1️⃣ Download the .zip file and extract the .pbix file to a local folder on your computer.
2️⃣ Open the .pbix file in Power BI Desktop (free download from Microsoft). The five report pages will load with the sample dataset.
3️⃣ Click Transform Data → Data Source Settings, point the source to your own campaign Excel / CSV file, and click Close & Apply. All visuals refresh automatically against your data.
4️⃣ Use the slicers on each page to filter by Party, Region, Candidate, Voter Segment, or Campaign Type for targeted analysis.
5️⃣ Publish to Power BI Service to share live links with your candidate, treasurer, party leadership, or PAC — or export individual pages to PDF for FEC filings.
💼 Real-World Use Cases
🔹 Sarah is a state assembly campaign manager running a 12-constituency race. She uses the Political Campaign Dashboard in Power BI to track Total Social Reach by Channel — Instagram is outperforming Facebook 3-to-1 with the 18-34 voter segment. She redirects $4,000 of social ad spend and lifts Total Votes Pledged by 18% in the final 30 days before election day.
🔹 The state party organizer tracks 47 candidates across the Candidate Performance and Fund Management pages. The Budget Utilization % by Party visual surfaces 3 candidates burning treasury 40% faster than donations come in. Leadership redirects emergency support before runoff weeks — saving two seats from financial collapse.
🔹 Marcus is a campaign treasurer at a PAC. He uses the Fund Management page to monitor Total Amount Spent by Campaign Type against Total Budget by Month Name. The audit-ready monthly view simplifies FEC quarterly filings and caught a $2,300 vendor overcharge during the last reconciliation cycle.
❓ Frequently Asked Questions
What KPIs does the Political Campaign Dashboard in Power BI track?
The Political Campaign Dashboard in Power BI tracks 5 headline KPI cards on the Overview page — Total Campaigns, Total Attendees, Total Budget, Total Donations, and Total Votes Pledged. Additional metrics across the 5 report pages include Budget Utilization %, Completion Rate %, Total Social Reach by Channel and Candidate, Total Attendees by State and Voter Segment, and Total Amount Spent by Campaign Type.
Do I need a paid Power BI subscription to use this dashboard?
No. The Political Campaign Dashboard in Power BI runs on Power BI Desktop, which is completely free from Microsoft. You only need a Power BI Pro or Premium license if you want to publish the dashboard to Power BI Service and share it via cloud links. The .pbix file works fully offline on Power BI Desktop with no subscription required.
How long does it take to set up the Political Campaign Dashboard in Power BI?
Setup takes under 10 minutes. Open the .pbix file in Power BI Desktop, replace the sample data source with your own Excel or CSV file via Transform Data → Data Source Settings, and click Close & Apply. All 16+ visuals across 5 pages refresh automatically against your data — no DAX rewriting required.
Can I customize parties, candidates, and constituencies in this template?
Yes. The Political Campaign Dashboard in Power BI is fully dynamic and data-driven. When you swap in your own party names, candidate names, constituencies, voter segments, event types, and social channels, every visual, slicer, and KPI card automatically reflects your unique campaign data on the next refresh.
How does this compare to NGP VAN or Nation Builder?
NGP VAN and Nation Builder are voter-file CRMs starting at $50 – $500+ per month with weeks-long onboarding. The Political Campaign Dashboard in Power BI is a $17.99 one-time analytics layer that sits alongside your existing CRM — pull data out of any system into Excel or CSV, and the dashboard surfaces strategic insights your CRM dashboards cannot match. Best used as a reporting layer, not a CRM replacement.
Can I use this dashboard for FEC reporting and audit purposes?
Yes. The Fund Management page tracks Total Budget by Month Name, Total Amount Spent by Campaign Type, and Budget Utilization % by Status — all the visuals you need to support FEC quarterly filings and treasurer reports. Export any page as PDF directly from Power BI Desktop. We recommend keeping a separate audit log of source documents alongside this dashboard.
Does this template work for non-U.S. political campaigns?
Absolutely. The Political Campaign Dashboard in Power BI is region-agnostic. Replace U.S.-specific labels (states, parties, constituencies) with your country’s political structure — UK constituencies, Indian Lok Sabha seats, Canadian ridings, Australian electorates. All visuals auto-adapt to whatever geographic and party labels you import into Power BI.
👤 About the Author
Built by PK — Microsoft Certified Professional with 15+ years of Excel, Google Sheets, and Power BI experience. Founder of Nextgen Templates, reaching 300K+ subscribers across YouTube channels (@PK-AnExcelExpert, @NextGenTemplates, @NeoTechNavigators). Every template is hand-built and tested before release.
🔗 Explore Related Templates
If this template is useful, check out these complementary Power BI dashboards and political tools on NextGenTemplates:
🔹 Political Campaign Dashboard in Excel — Same campaign analytics in Excel for teams that don’t use Power BI Desktop.
🔹 Influencer Campaign Dashboard in Power BI — Track multi-creator marketing campaign ROI with the same Power BI design language.
🔹 Nonprofit Grant Dashboard in Power BI — Grant pipeline, donor segmentation, and fundraising analytics for political-adjacent nonprofits and PACs.
🔹 Event Management Analysis Dashboard in Google Sheets — Manage rallies, town halls, and campaign event logistics end-to-end.
🔹 Browse all Power BI Dashboards across 50+ industries.
📖 Click here to read the Detailed Blog Post about Political Campaign Dashboard in Power BI
🎥 Visit our YouTube channel for step-by-step video tutorials
👉 YouTube.com/@NextGenTemplates
📅 Last updated: May 2026
Watch the step-by-step video tutorial:
YouTube


Reviews
There are no reviews yet.