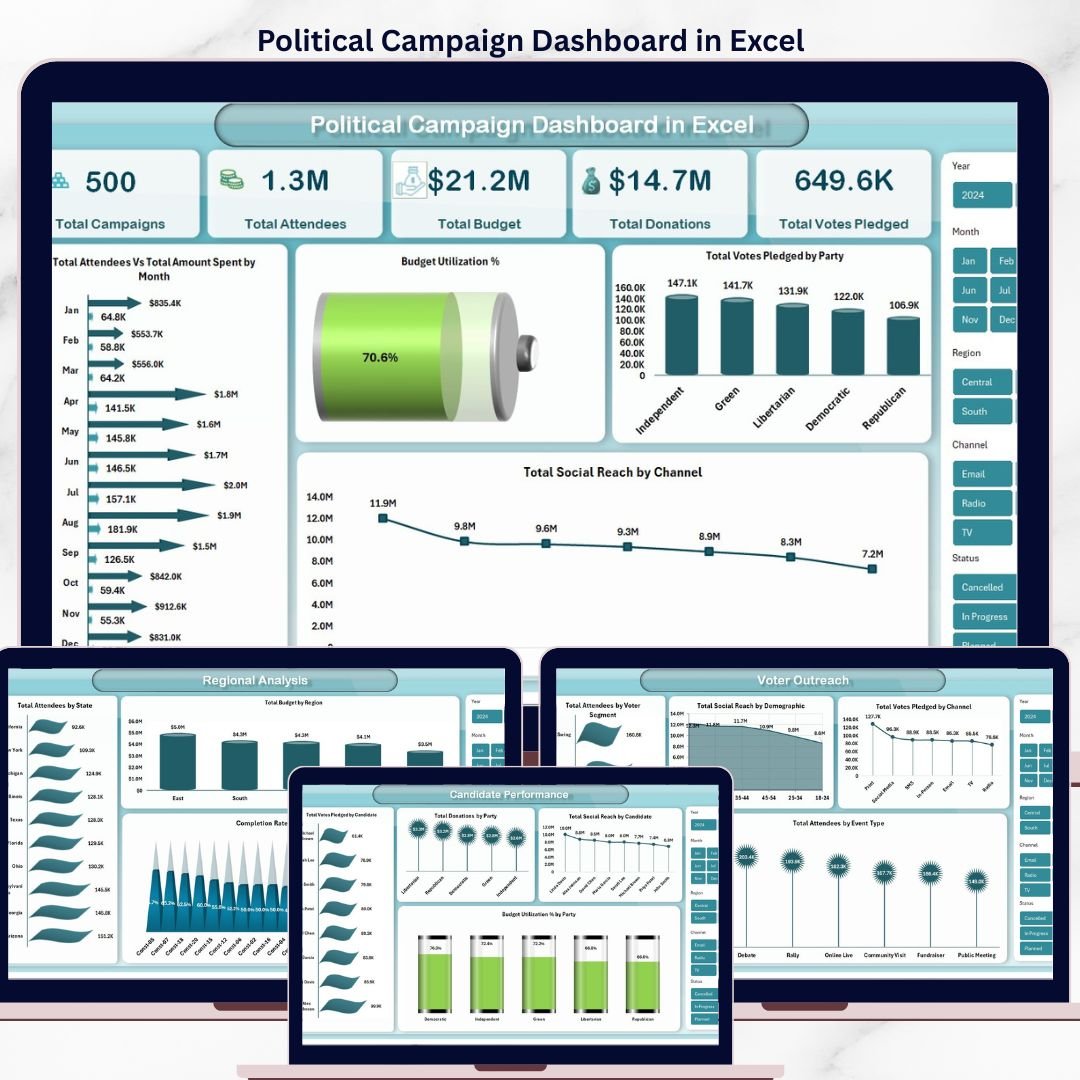
🔑 Key Features of Political Campaign Dashboard in Excel
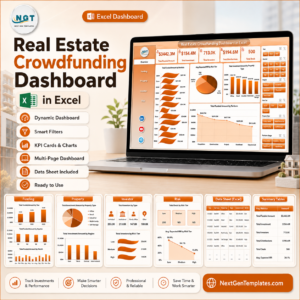
Political Campaign Dashboard in Excel is a comprehensive, ready-to-use analytics template built for political campaign managers, election strategists, and campaign field directors who need to track campaigns, monitor voter outreach, manage fundraising, and analyze candidate performance — all in one place. According to the U.S. Federal Election Commission, U.S. political committees raised over $15.9 billion in the 2024 election cycle, making data-driven campaign management more critical than ever. This Excel dashboard template includes 5 interactive analysis pages, a structured Data Sheet, and a Support Sheet with pivot tables that auto-refresh your entire dashboard with a single click.
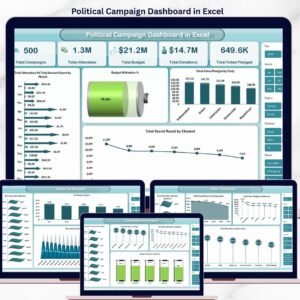
Whether you run a local council campaign, a state-level race, or a national party operation, this template gives you instant visibility into Total Campaigns, Total Attendees, Total Budget, Total Donations, Total Votes Pledged, Budget Utilization %, Total Social Reach, and Net Fund Balance. The dashboard tracks every key political campaign metric — giving you a complete, real-time picture of campaign health, voter engagement, and financial discipline at a glance.
📦 What’s Inside the Political Campaign Dashboard in Excel
This Excel dashboard template features 7 professionally designed worksheets covering every aspect of political campaign analytics:
📊 Overview Page: Your high-level command center displaying 5 key metric cards — Total Campaigns, Total Attendees, Total Budget, Total Donations, and Total Votes Pledged. Interactive slicers let you filter the entire dashboard instantly. Visual charts show Total Attendees Vs Total Amount Spent by Month, Budget Utilization %, Total Votes Pledged by Party, and Total Social Reach by Channel — giving leadership an at-a-glance view of campaign momentum and ROI.
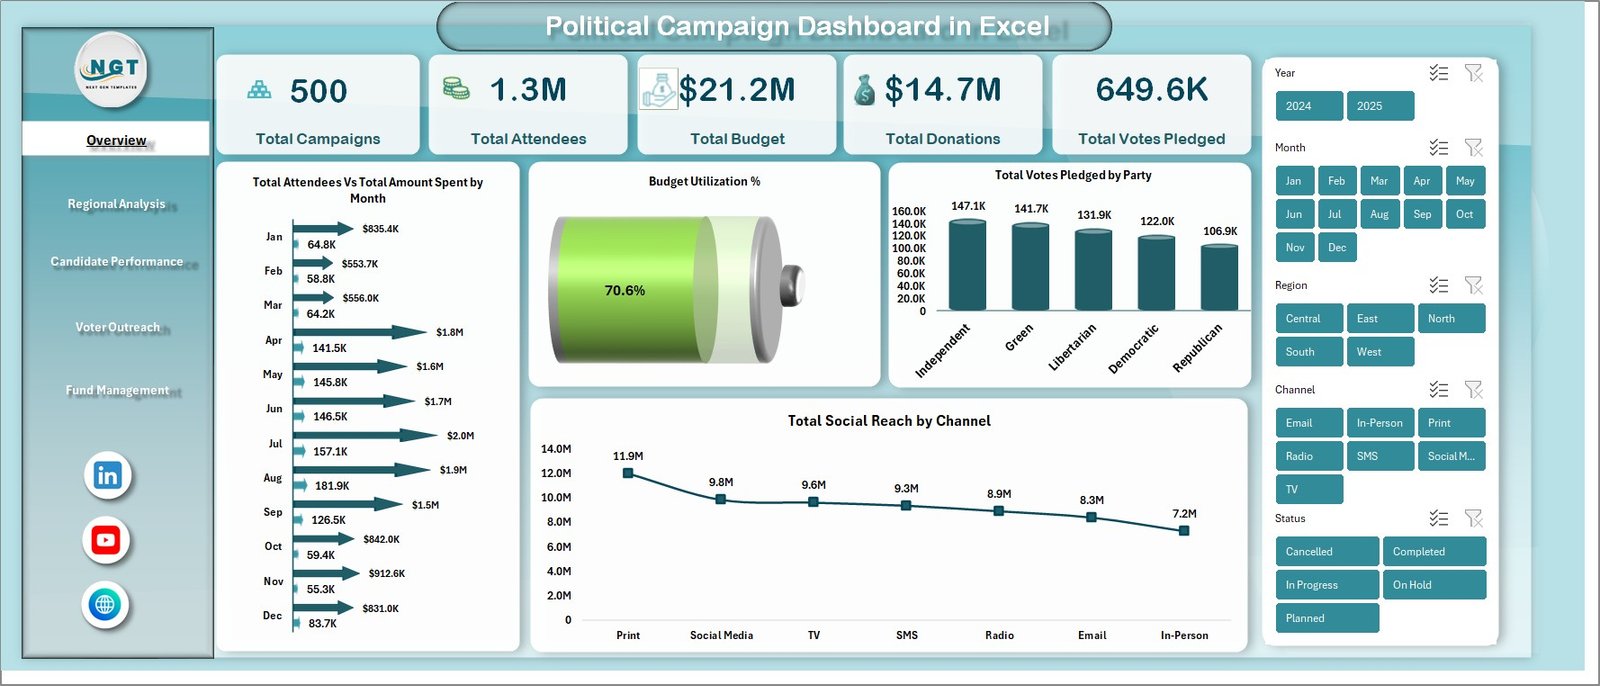 Political Campaign Dashboard in Excel
📈 Regional Analysis Page: Dive deep into geographic performance with charts showing Total Attendees by State, Total Budget by Region, and Completion Rate % by Constituency. Identify which regions over-perform and where to redirect campaign resources for maximum electoral impact.
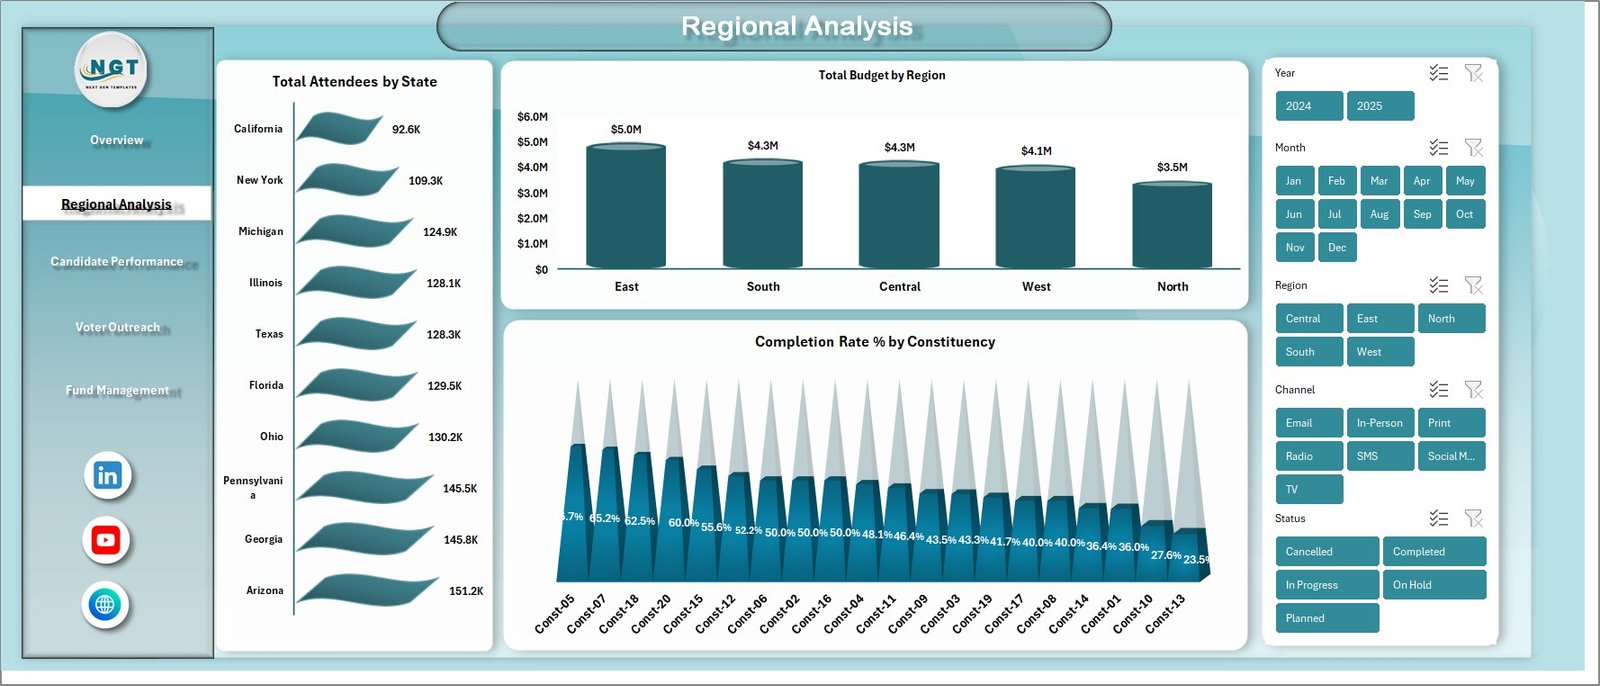 Regional Analysis
🎯 Candidate Performance Page: Evaluate individual candidates with Total Votes Pledged by Candidate, Total Donations by Party, Total Social Reach by Candidate, and Budget Utilization % by Party. See which candidates resonate with voters and which need more strategic support.
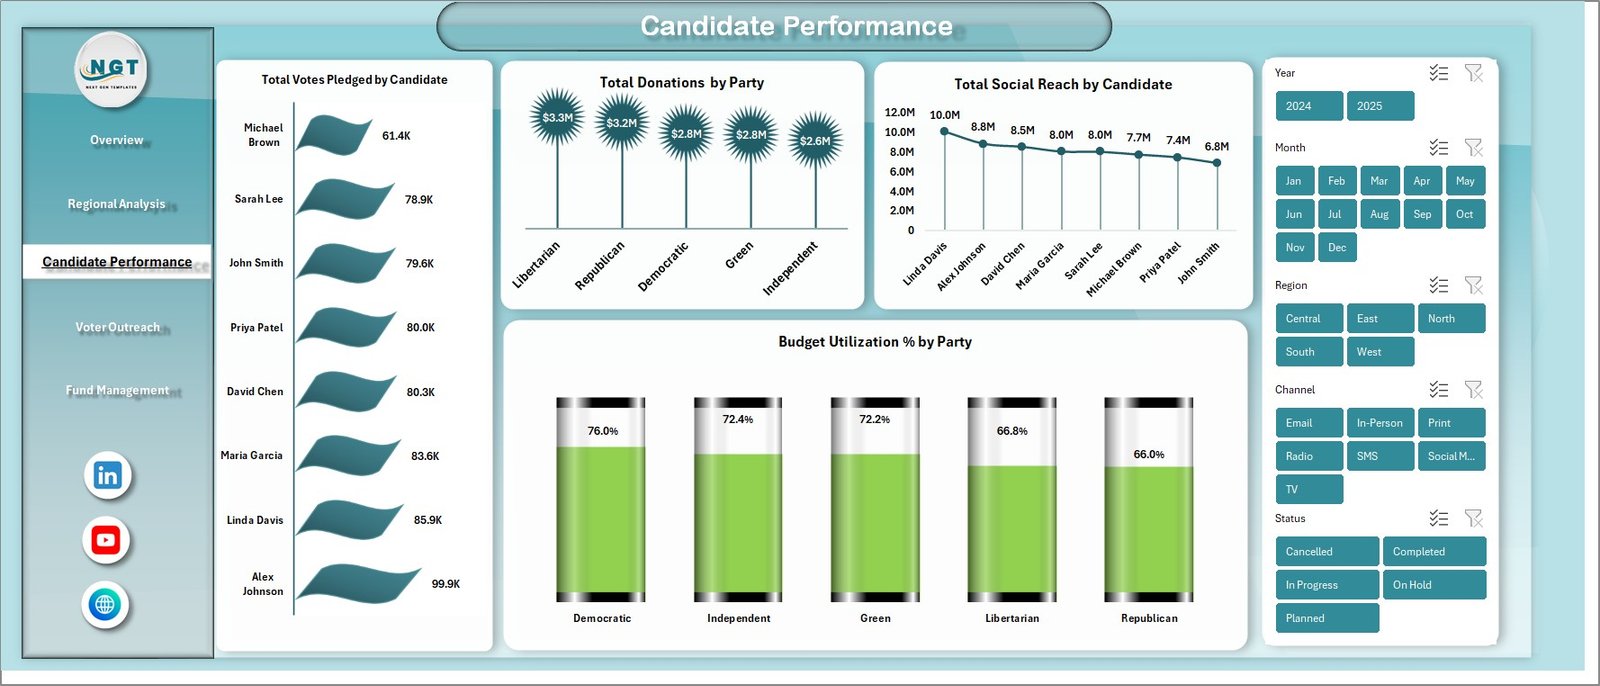 Candidate Performance
👥 Voter Outreach Page: Understand voter engagement with Total Attendees by Voter Segment, Total Social Reach by Demographic, Total Votes Pledged by Channel, and Total Attendees by Event Type. Optimize outreach tactics for the demographics and channels that deliver the highest pledged-vote conversions.
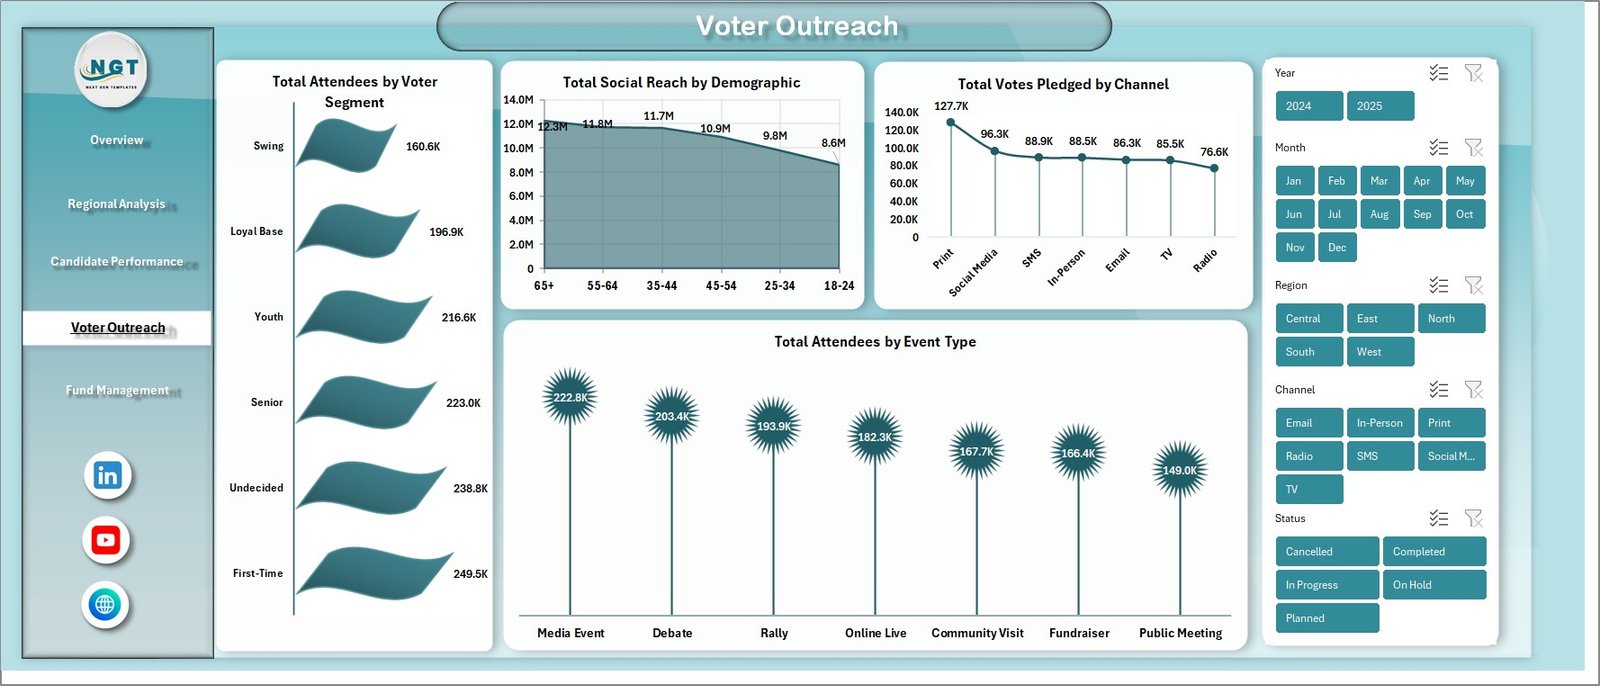 Voter Outreach
💰 Fund Management Page: Monitor financial discipline with Total Budget by Month, Total Amount Spent by Campaign Type, and Net Fund Balance Amt by Party. Spot overspending early, defend audit-ready budgets, and ensure FEC-compliant financial reporting.
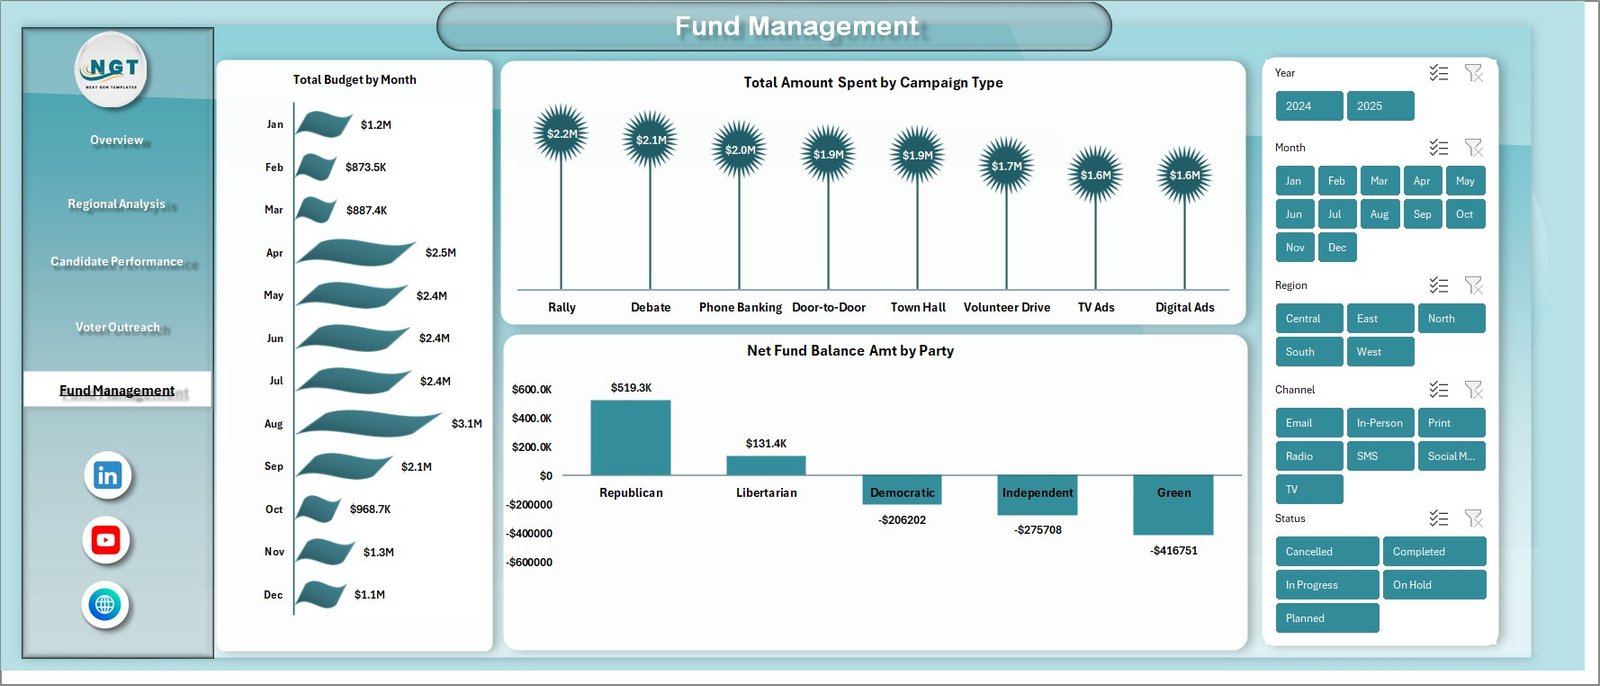 Fund Management
📋 Data Sheet: A structured data entry sheet where you input your campaign records — campaigns, candidates, parties, regions, voter segments, events, donations, social channels, and budget transactions. Simply add your data in the same format and refresh the dashboard.
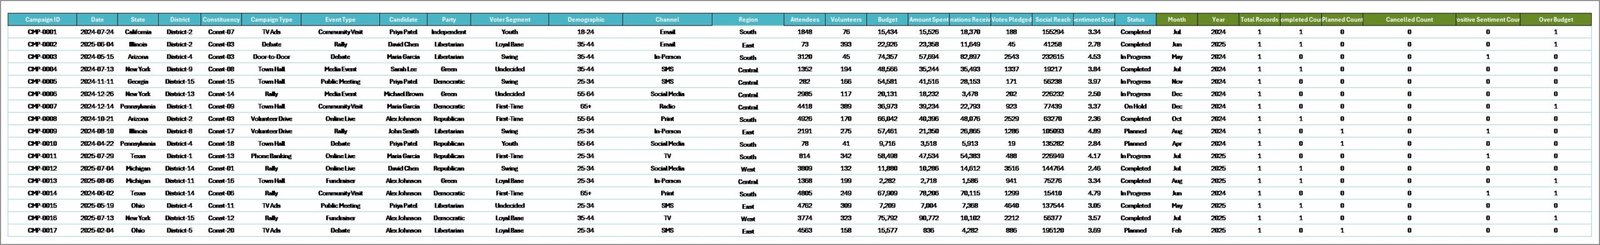 Data Sheet tab
⚙️ Support Sheet: Contains multiple pivot tables that power the entire dashboard dynamically. After updating your data, go to the Data tab in the Excel Ribbon and click Refresh All — every pivot and chart refreshes automatically. You can keep this sheet hidden for a clean user experience.
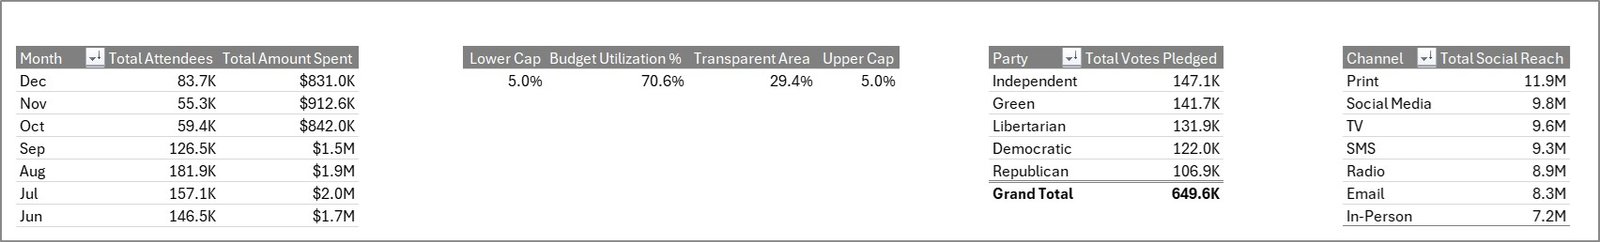 Support sheet tab
📊 Excel vs Google Sheets vs Political CRM Software
| Feature | Political Campaign Dashboard in Excel | Google Sheets equivalent | NGP VAN / NationBuilder / Salesforce for Nonprofits |
|---|---|---|---|
| One-time cost | $17.99 (lifetime) | $14.99 – $19.99 (lifetime) | $50 – $500+ per month |
| Works offline | ✅ Yes | ❌ No (cloud only) | ❌ No (cloud only) |
| Setup time | 5 minutes | 5 minutes | 2 – 8 weeks |
| Learning curve | Low (basic Excel) | Low (basic Sheets) | High (training + onboarding) |
| Customization | Full (you own the file) | Full (you own the file) | Limited (vendor-controlled) |
| Voter file integration | Manual import | Manual import | Native (state voter files) |
| Multi-user editing | Single-user (or shared drive) | Real-time multi-user | Real-time multi-user |
| Best for | Local, state, party operations | Team-based campaigns | Large national campaigns |
🎯 Who This Is For (and Who It’s Not For)
✅ Best fit: Local council, mayoral, state assembly, and parliamentary campaign managers. Party organizers tracking multiple candidates. Field directors managing voter outreach across constituencies. Campaign treasurers monitoring budgets and donations. Political consultants delivering reporting to candidates and PACs.
❌ Not for: National presidential campaigns with 1M+ voter records (use NGP VAN or NationBuilder instead). Teams that require real-time multi-user editing across 10+ field staff (use the Google Sheets edition). Campaigns that need automated SMS/email blasts (this is an analytics dashboard, not a CRM).
⚙️ How to Use the Political Campaign Dashboard in Excel
1️⃣ Download the file and open it in Microsoft Excel (2016 or later recommended).
2️⃣ Navigate to the Data Sheet and replace the sample data with your actual campaign records — campaigns, candidates, parties, regions, voter segments, events, donations, and budget entries.
3️⃣ Go to the Data tab in the Excel Ribbon and click “Refresh All” to update every pivot table and chart across all 5 dashboard pages.
4️⃣ Use the slicers on the Overview page to filter by party, region, candidate, voter segment, or campaign type for targeted analysis.
5️⃣ Share insights with your candidate, treasurer, party leadership, or PAC by printing dashboard pages or exporting to PDF.
🌍 Real-World Use Cases
🔹 State Assembly Campaign Manager: Sarah, running a 12-constituency state assembly campaign, used the dashboard to identify that her Total Social Reach by Channel showed Instagram outperforming Facebook 3-to-1 among the 18-34 voter segment. She redirected $4,000 of social ad spend, lifting Total Votes Pledged by 18% in the final 30 days.
🔹 Party Organizer: The state party tracked Total Donations by Party and Budget Utilization % by Party across 47 candidates. The dashboard surfaced 3 candidates burning budget faster than donations came in, allowing leadership to redirect treasury support before runoff weeks.
🔹 Campaign Treasurer: Marcus used the Fund Management page to monitor Net Fund Balance Amt and Total Amount Spent by Campaign Type. The audit-ready monthly view simplified FEC quarterly filing and caught a $2,300 vendor overcharge during reconciliation.
❓ Frequently Asked Questions
What KPIs does the Political Campaign Dashboard in Excel track?
The Political Campaign Dashboard in Excel tracks 5 key performance indicators on the Overview page: Total Campaigns, Total Attendees, Total Budget, Total Donations, and Total Votes Pledged. Additional metrics across the 5 analysis pages include Budget Utilization %, Total Social Reach by Channel and Demographic, Completion Rate % by Constituency, Net Fund Balance Amt by Party, and Total Amount Spent by Campaign Type.
Do I need advanced Excel skills to use this political campaign dashboard?
No advanced skills required. Simply replace the sample data in the Data Sheet with your own campaign records, then click Refresh All in the Data tab. All charts, KPI cards, and pivot tables update automatically. There are no formulas to write and no VBA or macros — just basic Excel knowledge is enough to operate the entire dashboard.
Can I customize parties, candidates, and constituencies in this template?
Yes. The dashboard is fully dynamic and pivot-driven. When you enter your own party names, candidate names, constituencies, voter segments, event types, and social channels in the Data Sheet, every chart and KPI card automatically reflects your unique campaign data after you click Refresh All.
How many dashboard pages does this template include?
The template includes 7 worksheets: 5 interactive dashboard pages (Overview, Regional Analysis, Candidate Performance, Voter Outreach, Fund Management), 1 Data Sheet for data entry, and 1 Support Sheet with pivot tables that power the entire dashboard. All 5 dashboard pages are slicer-enabled for instant filtering.
What is the best Excel template for tracking a political campaign?
The Political Campaign Dashboard in Excel from NextGenTemplates is one of the best options available. It offers 5 analysis pages covering campaigns, regions, candidates, voter outreach, and funds — with automated pivot tables and interactive slicers for instant filtering. It is ready to use with no setup, no coding, and no monthly subscription required.
Can I use this dashboard for FEC reporting and audit purposes?
Yes. The Fund Management page tracks Total Budget by Month, Total Amount Spent by Campaign Type, and Net Fund Balance Amt by Party — all sourced from the Data Sheet. You can export individual pages as PDFs to support FEC quarterly filings, treasurer reports, and internal audits. We recommend keeping a separate audit log of source documents alongside this dashboard.
Does this template work for non-U.S. political campaigns?
Absolutely. The dashboard is region-agnostic. Replace U.S.-specific labels (states, parties, constituencies) with your country’s political structure — UK constituencies, Indian Lok Sabha seats, Canadian ridings, Australian electorates. The pivot tables auto-adapt to whatever geographic and party labels you enter in the Data Sheet.
👨💻 About the Creator
This template was created by PK, a Microsoft Certified Professional with over 15 years of experience building Excel, Google Sheets, and Power BI dashboards for businesses, nonprofits, and political organizations across 40+ countries. PK runs three YouTube channels with a combined 300,000+ subscribers and has published over 5,600 dashboard templates trusted by 8,400+ customers worldwide.
🔹 YouTube.com/@PK-AnExcelExpert — Excel tutorials and dashboard walkthroughs
🔹 YouTube.com/@NextGenTemplates — Template demos and download guides
🔹 YouTube.com/@NeoTechNavigators — Google Sheets, Power BI, and tech tutorials
🔗 Explore Related Templates
If this template is useful, check out these complementary dashboards on NextGenTemplates:
🔹 Digital Marketing Campaign Dashboard in Excel — Track multi-channel marketing campaign ROI with the same pivot-powered design.
🔹 Nonprofit Fundraising Dashboard in Excel — Donor segmentation, campaign ROI, and regional fundraising analytics.
🔹 Event Management Analysis Dashboard in Excel — Manage rallies, town halls, and campaign event logistics end-to-end.
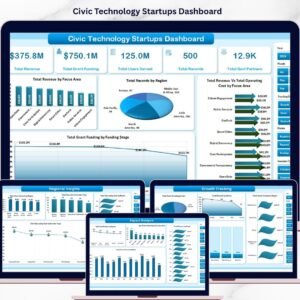
🔹 Civic Technology Startups Dashboard in Excel — Analytics for civic-tech and political-tech ventures.
🔹 Browse all Excel Dashboard Templates across 50+ industries.
📖 Click here to read the Detailed Blog Post about Political Campaign Dashboard in Excel
🎥 Visit our YouTube channel for step-by-step video tutorials
👉 YouTube.com/@NextGenTemplates
Watch the step-by-step video tutorial:
YouTube


Reviews
There are no reviews yet.