

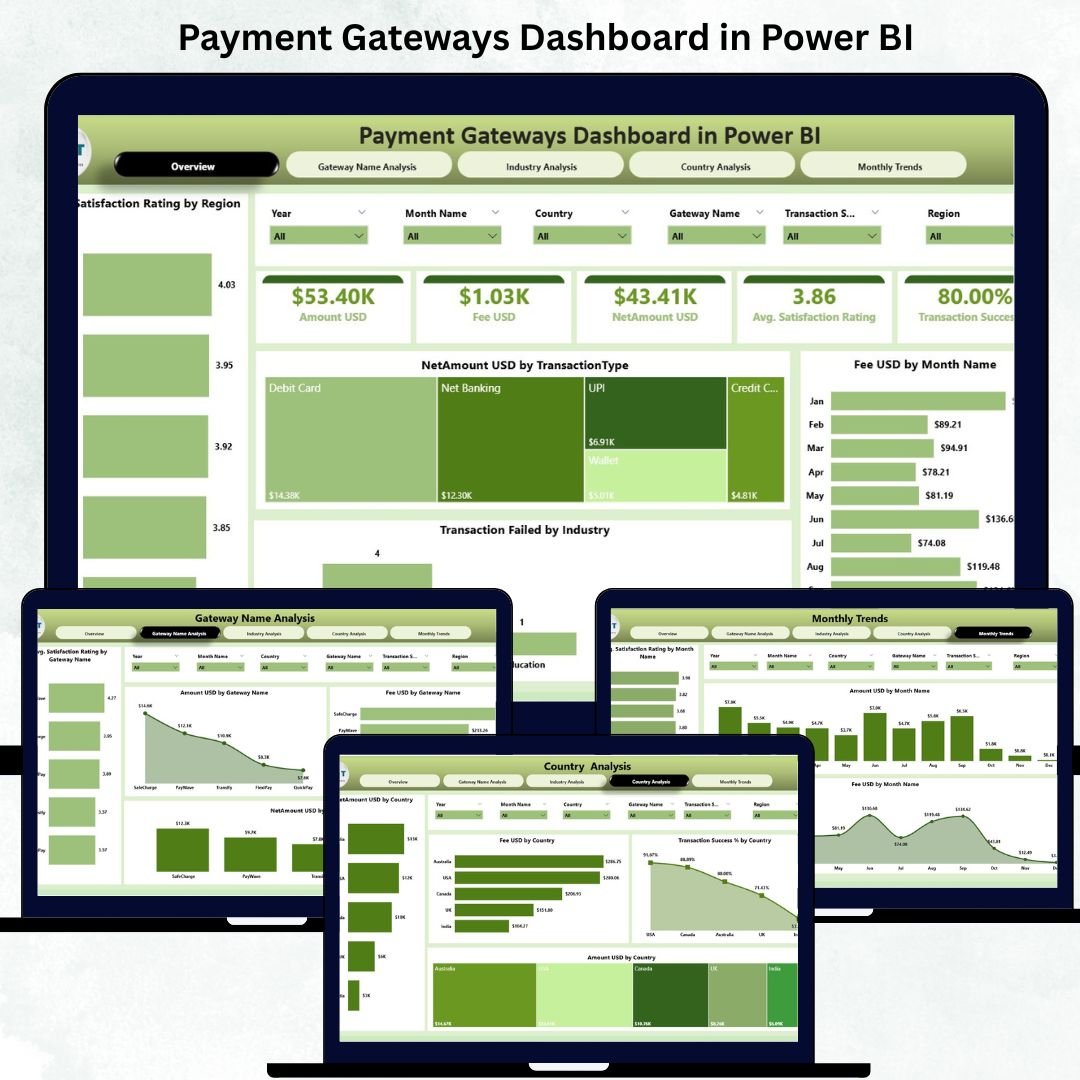
Digital payments are growing faster than ever. With thousands of transactions flowing in every single day, businesses need a clear and instant view of their payment performance. From success rates to gateway fees, regional trends to customer satisfaction—every number matters. That’s exactly why the Payment Gateways Dashboard in Power BI is the ultimate solution for payment analytics.
This ready-to-use dashboard gives you complete visibility over your digital transactions. Payment Gateways Dashboard in Power BI It updates automatically from your Excel file, helping finance teams, analysts, business owners, and product managers make accurate and fast decisions without struggling with complex spreadsheets.
Payment Gateways Dashboard in Power BI Whether you want to monitor payment success, reduce failures, compare gateway fees, or understand customer satisfaction across countries—this dashboard brings everything together in one visual platform.
✨ Key Features of the Payment Gateways Dashboard in Power BI
This dashboard is designed with clean visuals, easy navigation, powerful slicers, and automated charts—giving you a complete payment intelligence system.
📍 1. Overview Page – Instant Insights at a Glance
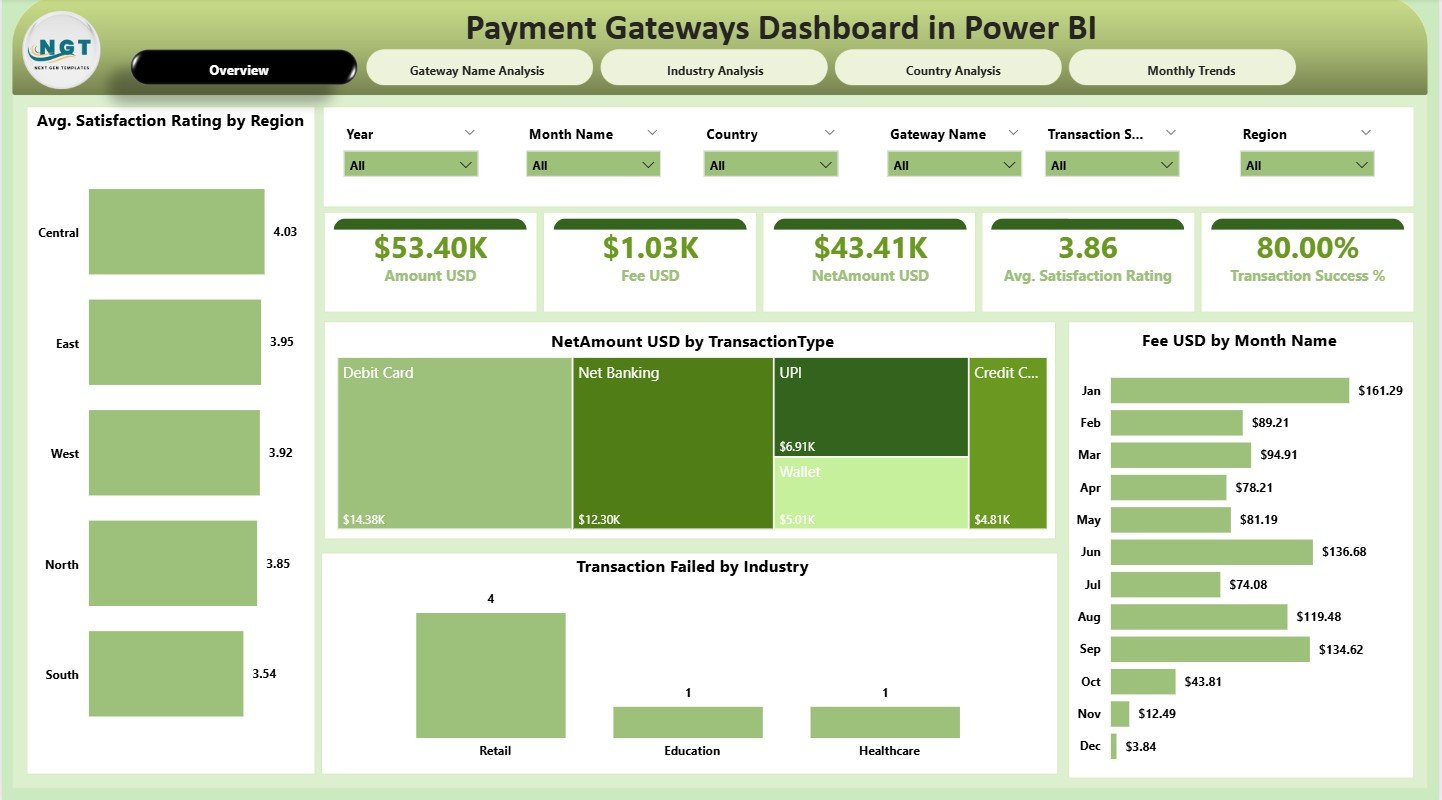
The Overview Page is the main dashboard that displays:
💰 Total Net Amount (USD)
💸 Total Fee Amount (USD)
🔢 Number of Transactions
❌ Failed Transactions Count
⭐ Average Customer Satisfaction Score
You also get important charts like:
Net Amount by Transaction Type
Fee Amount by Month
Transaction Failures by Industry
Regional Satisfaction Ratings
With dynamic slicers for month, gateway name, industry, and country, the page updates instantly making it easy to spot trends and issues.
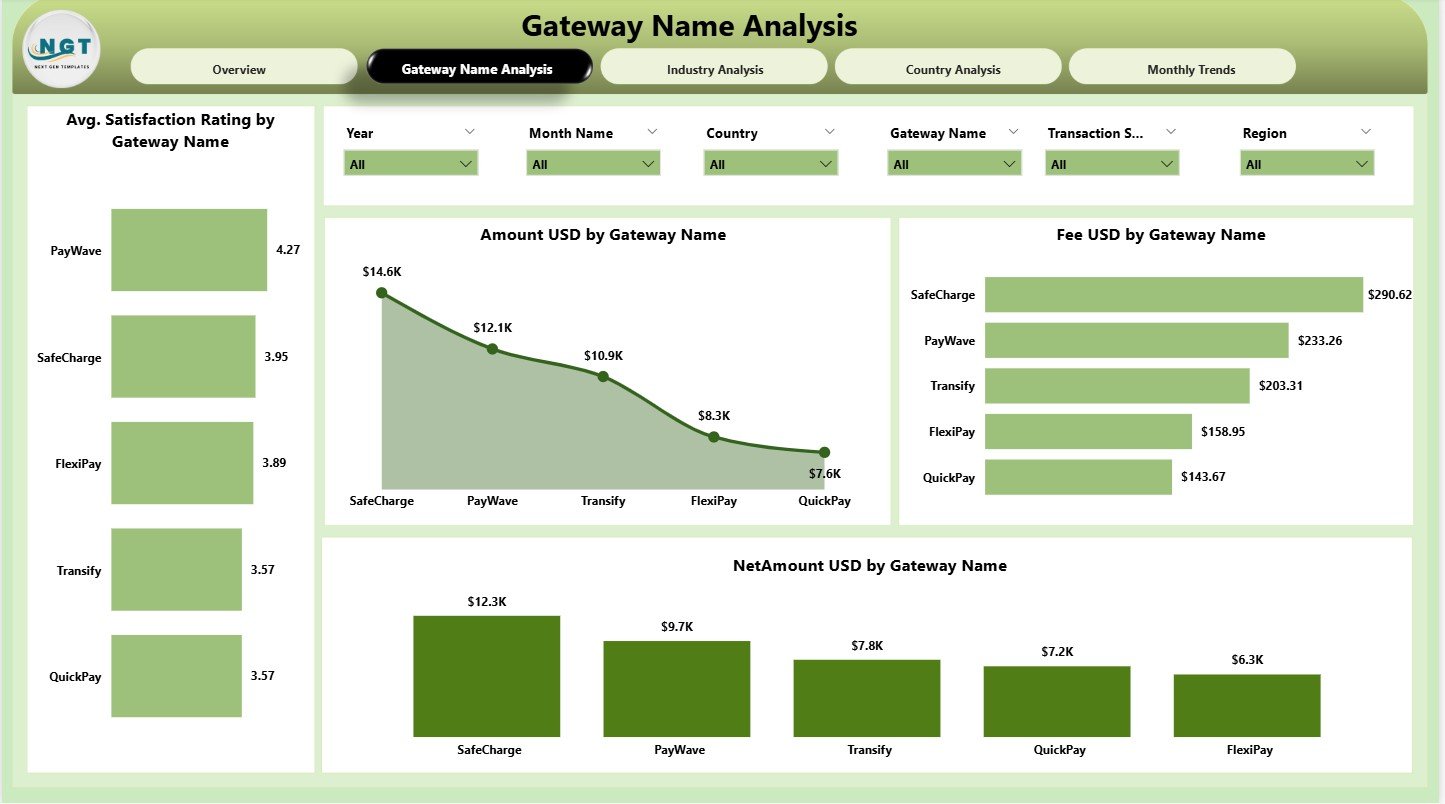
📍 2. Gateway Name Analysis – Compare Payment Gateways Easily
Every payment gateway behaves differently. This page helps you evaluate:
Amount (USD) by Gateway Name
Fee (USD) by Gateway Name
Net Amount (USD) by Gateway Name
Average Satisfaction Rating by Gateway
Perfect for identifying:
High-earning gateways
Costly gateways
Poor-performing gateways
Gateways with low customer satisfaction
This helps you choose the right gateways for your business and reduce unnecessary costs.
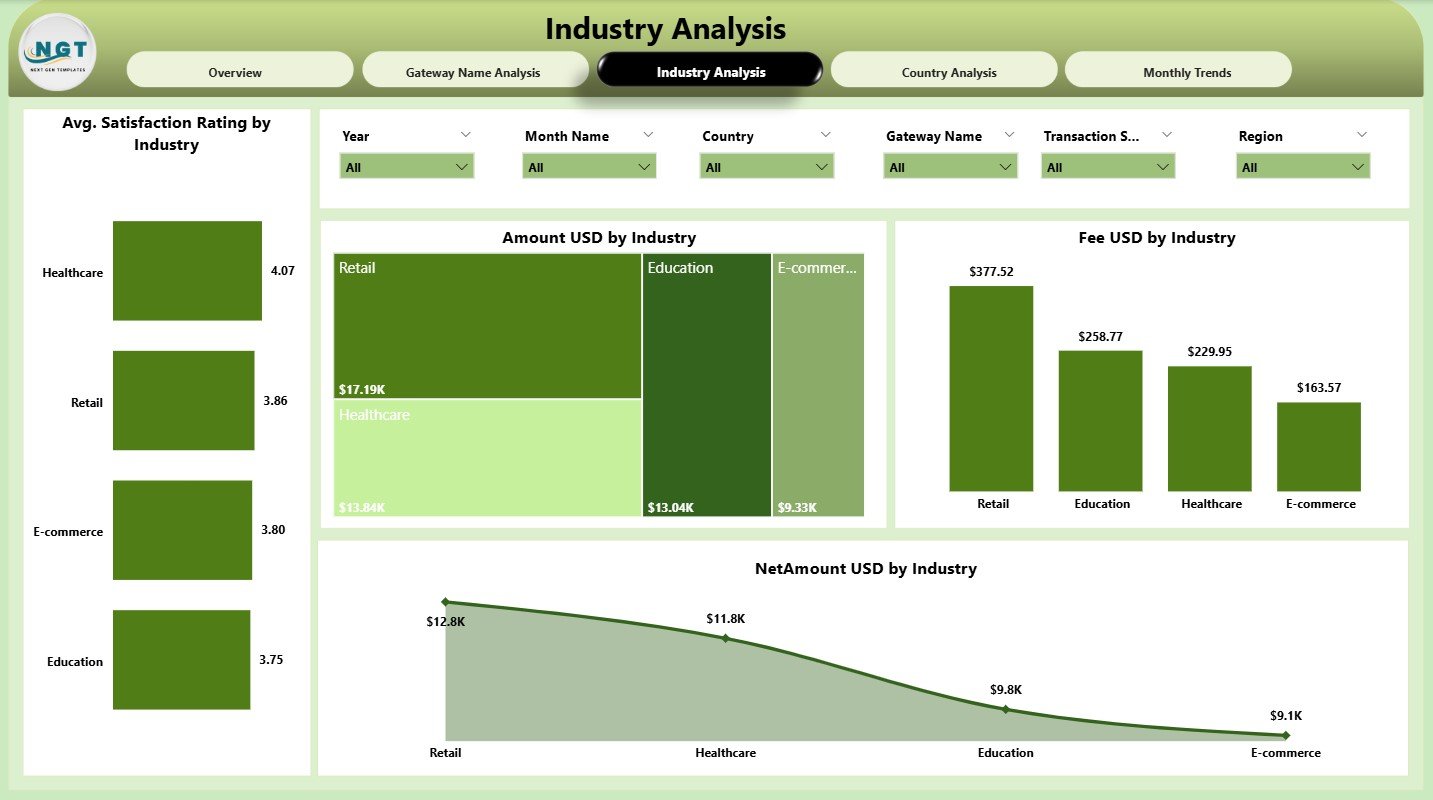
📍 3. Industry Analysis – Understand Which Industries Perform Best
This page gives clear industry-wise performance through charts showing:
Revenue
Fees
Net amounts
Satisfaction ratings
You instantly discover:
High-value industries
Industries with high failure rates
Sectors needing additional support
Customer experience differences across industries
Great for sales teams, finance teams, and leadership decision-making.
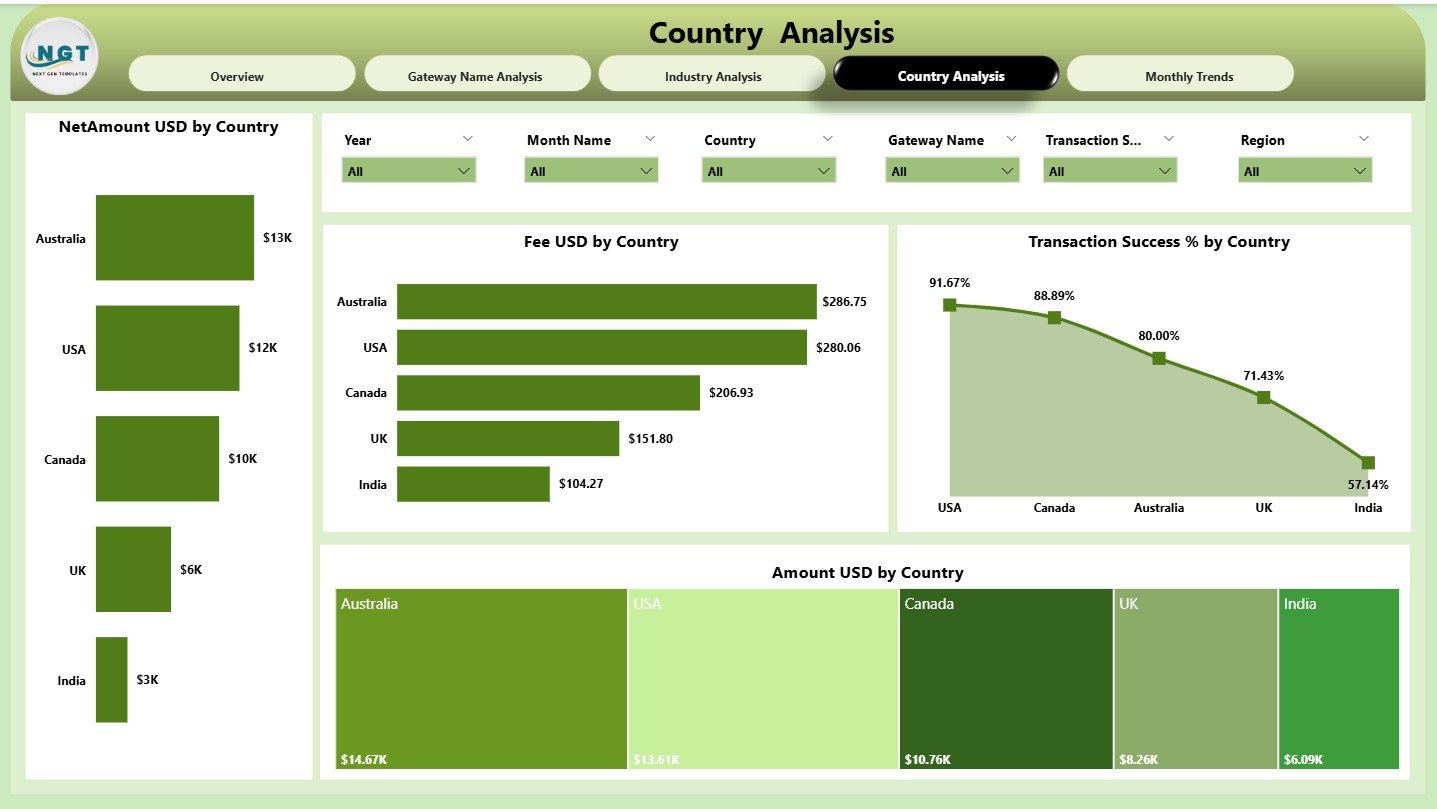
📍 4. Country Analysis – Track Performance Across Regions
Regional performance often varies due to banking infrastructure, gateway behavior, or user preferences.
This page visualizes:
Fee Amount by Country
Transaction Success % by Country
Amount (USD) by Country
Net Amount (USD) by Country
You clearly see:
Countries generating the most revenue
Countries with high failure rates
Regions where fees are significantly higher
Areas needing improved gateway settings
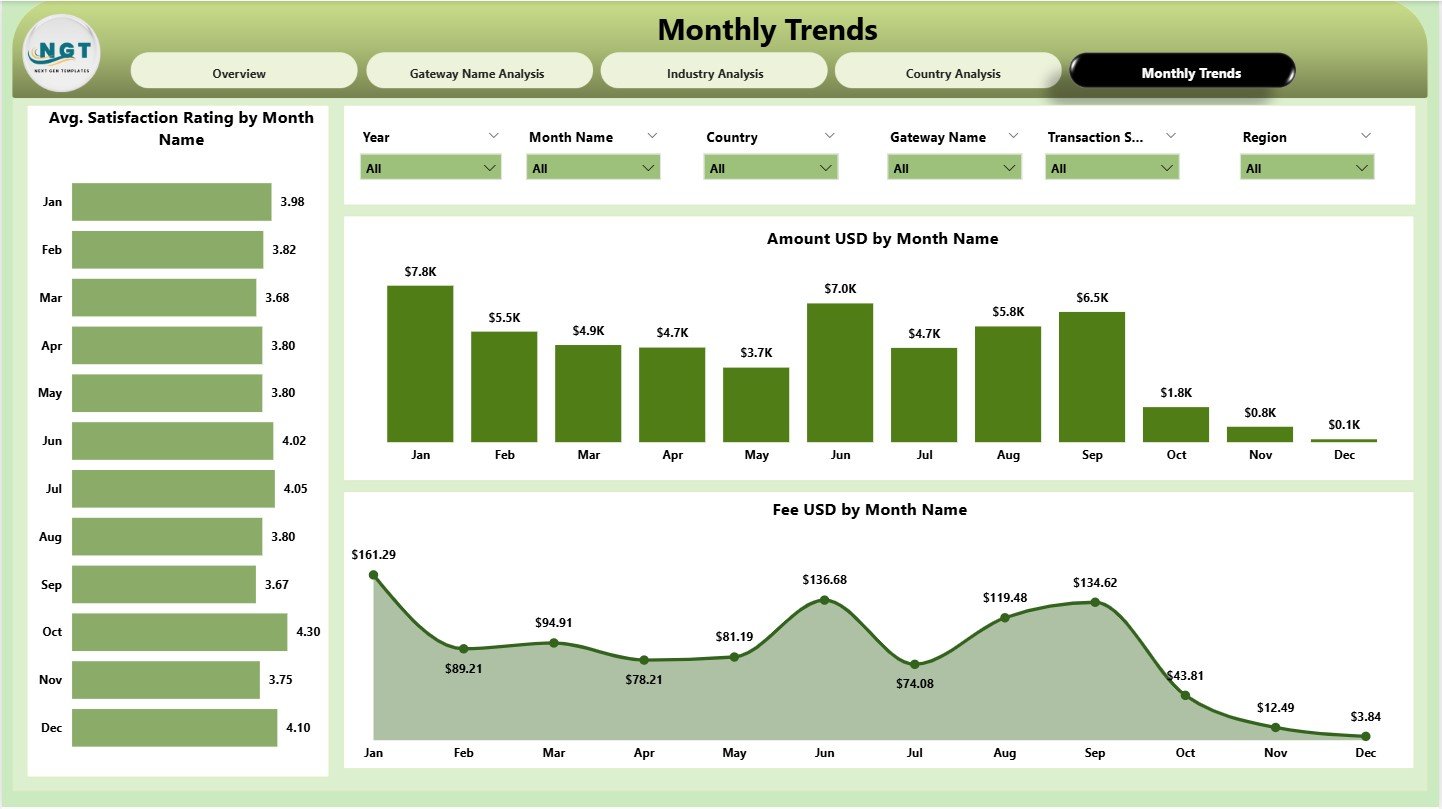
📍 5. Monthly Trends – Spot Seasonal Patterns Instantly
The Monthly Trends page shows long-term behavior with charts covering:
Monthly Revenue
Monthly Gateway Fees
Monthly Satisfaction Ratings
This helps leaders prepare for:
Festival seasons
Year-end campaigns
Slow months
Charges fluctuations
Perfect for forecasting and budgeting.
📦 What’s Inside the Product
This dashboard connects to a structured Excel file that includes:
Transaction details
Fees
Gateway names
Industry and region data
Monthly values
Customer satisfaction scores
Just update the Excel file—and Power BI refreshes everything instantly.
🧠 How to Use the Payment Gateways Dashboard in Power BI
Using this dashboard is extremely simple:
✔ Update your Excel source with the latest payment data
✔ Open the Power BI dashboard
✔ Click Refresh
✔ Apply slicers to view insights you want
✔ Download, export, or share reports instantly
No complex formulas. No coding. No manual reporting.
👥 Who Can Benefit from This Dashboard?
This dashboard is perfect for:
Finance Teams
E-Commerce Companies
SaaS Businesses
Marketplace Platforms
Retail Chains
Travel & Hospitality
Payment Operations Teams
Product Managers
Leadership Teams
Anyone who handles digital payments will benefit from this dashboard.
🚀 How This Dashboard Helps You Make Better Decisions
Identify high-fee gateways
Reduce failed transactions
Improve customer satisfaction
Track global payment performance
Control payment-related costs
Improve financial planning
Understand revenue trends
Compare industries & countries
Optimize gateway selection
This dashboard becomes your control center for payment intelligence.
📝 Best Practices for Using This Dashboard
Refresh your data daily or weekly
Use slicers before making decisions
Compare gateways monthly
Monitor success rates closely
Analyze fee spikes every month
Track customer satisfaction region-wise
Keep Excel data clean and structured
Use drill-down features for deeper analysis






























Reviews
There are no reviews yet.