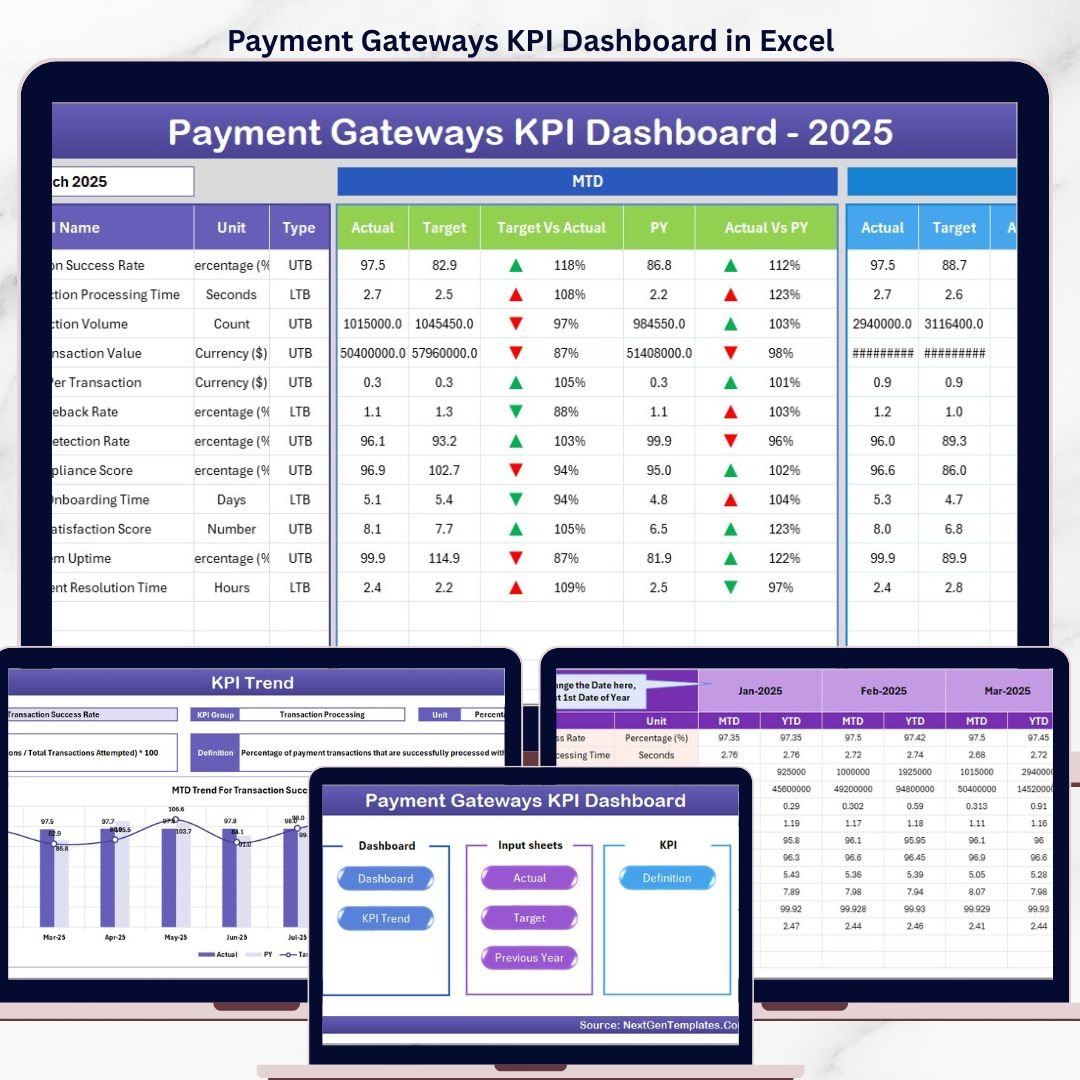


Key Features of Payment Gateways KPI Dashboard
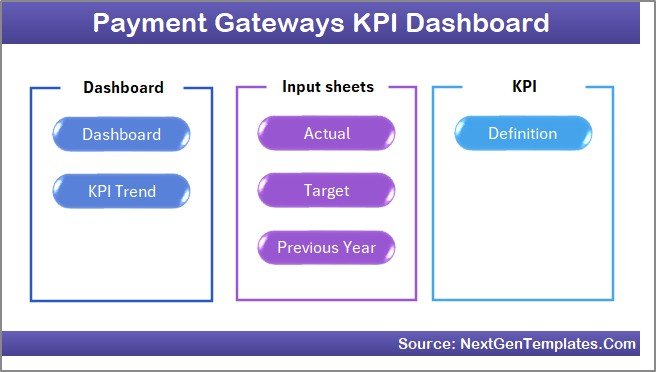
Unlock the full potential of your payment gateway analytics with our Payment Gateways KPI Dashboard. Designed to provide comprehensive insights and streamline your performance tracking, this digital product is an essential tool for finance teams, analysts, and business managers. The dashboard comes with 7 interactive worksheets that allow you to monitor, input, and analyze your KPIs effortlessly.
- 🏠 Home Sheet: Acts as the index page with 6 easy navigation buttons that take you to the respective sheets, ensuring a smooth user experience.
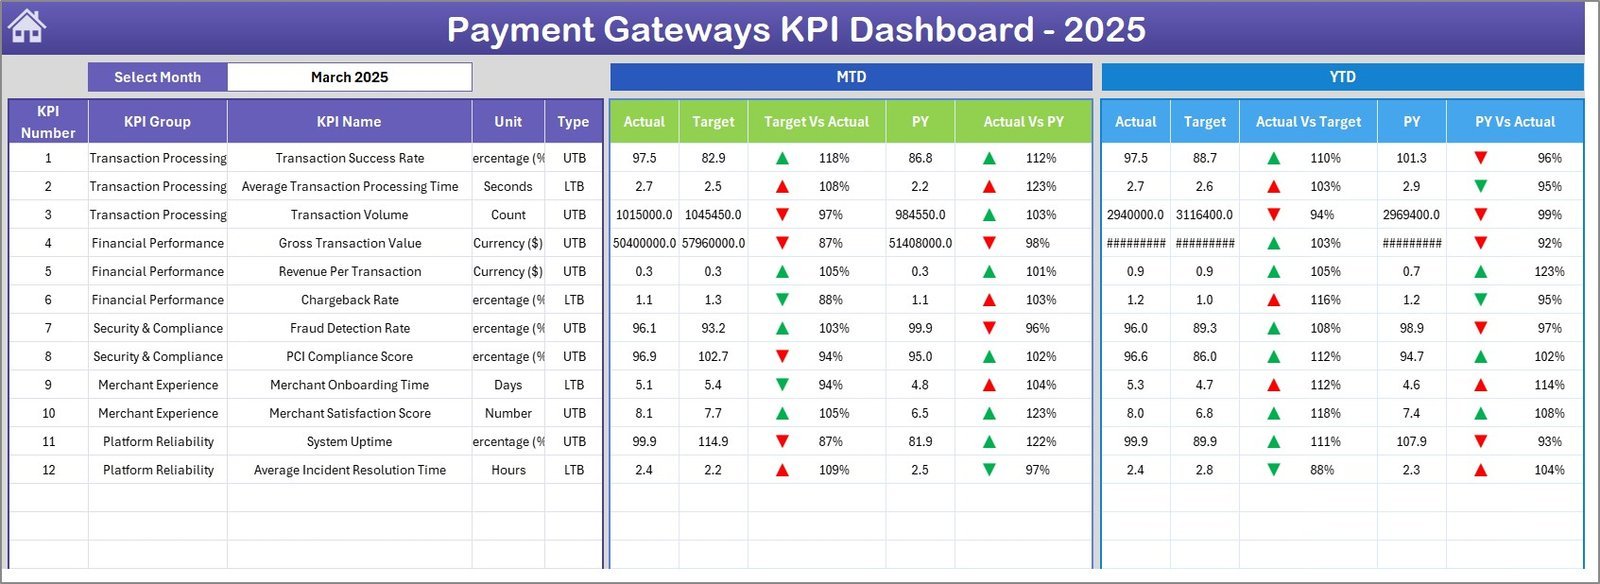
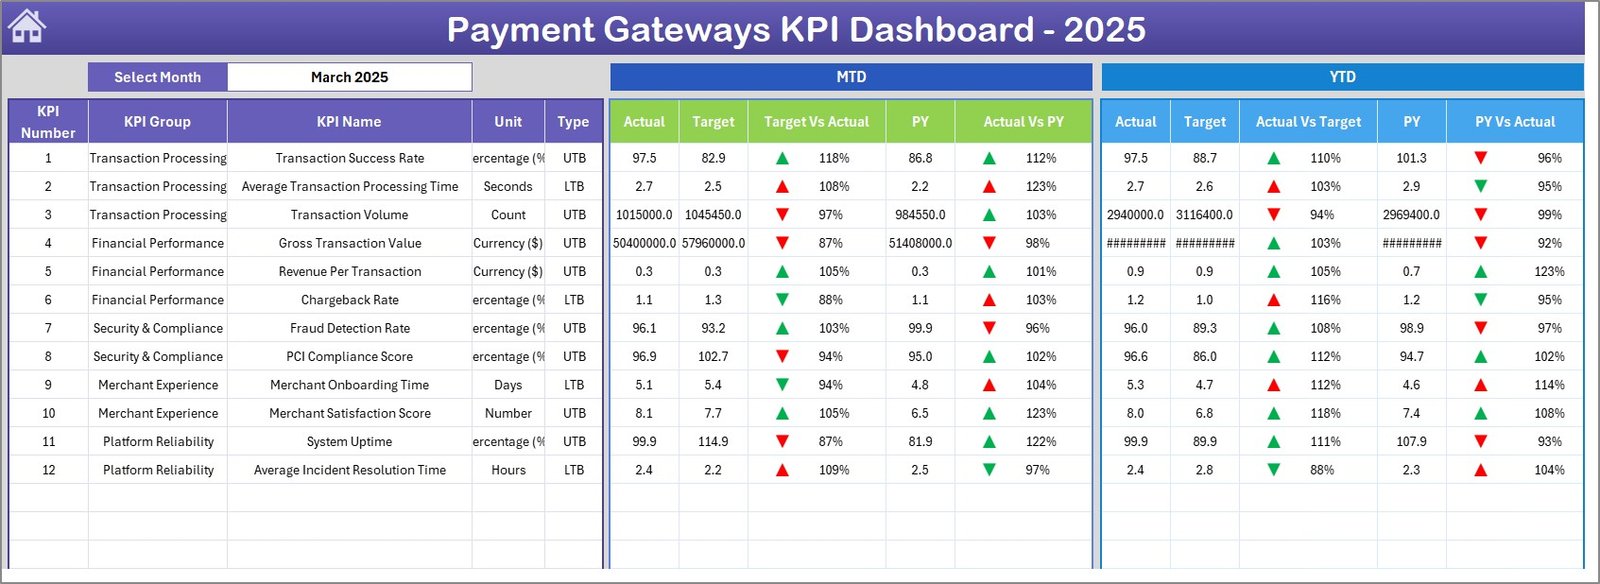
Home Page - 📊 Dashboard Sheet: The main control center where you select the month from a drop-down menu (cell D3) to view dynamic, up-to-date metrics. It shows MTD (Month-to-Date) Actual, Target, Previous Year data, plus YTD (Year-to-Date) comparisons with conditional formatting featuring up/down arrows for instant visual cues.
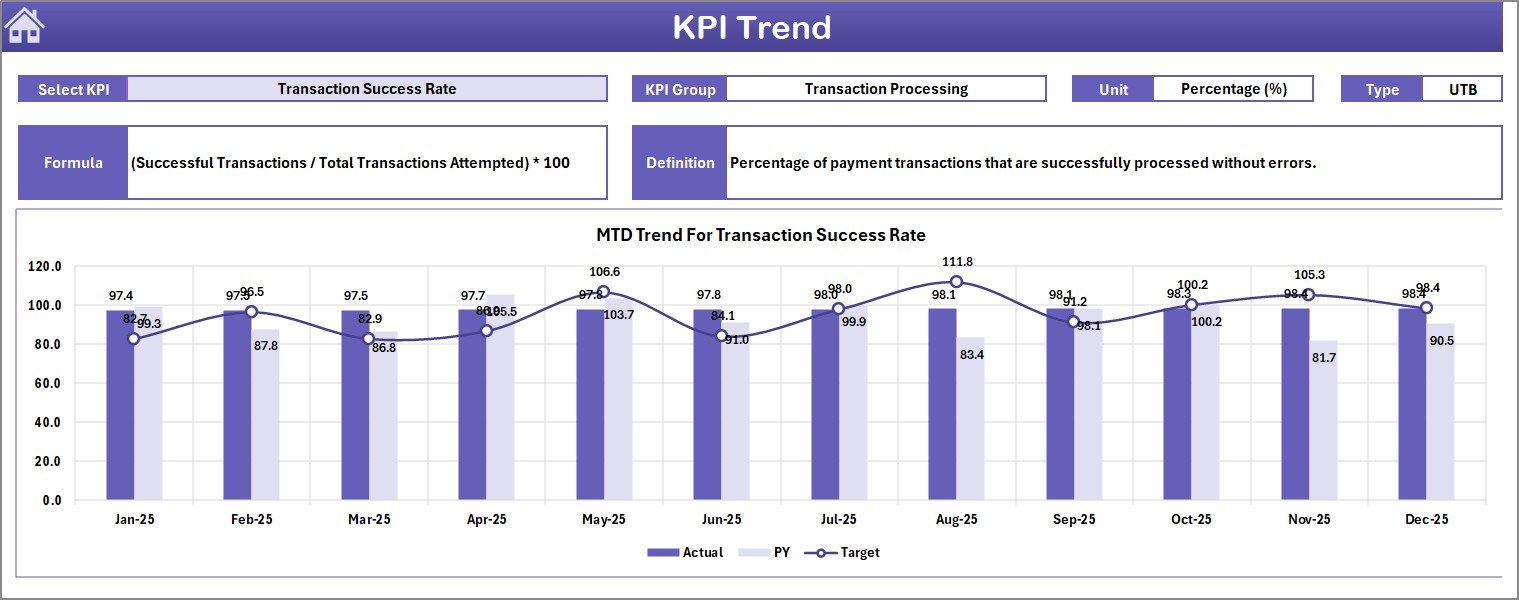
Payment Gateways KPI Dashboard - 📈 KPI Trend Sheet: Select any KPI from a drop-down (cell C3) to view its group, unit, formula, type (Lower the Better or Upper the Better), and a detailed definition. Visualize MTD and YTD trends for Actual, Target, and Previous Year numbers with clear charts.
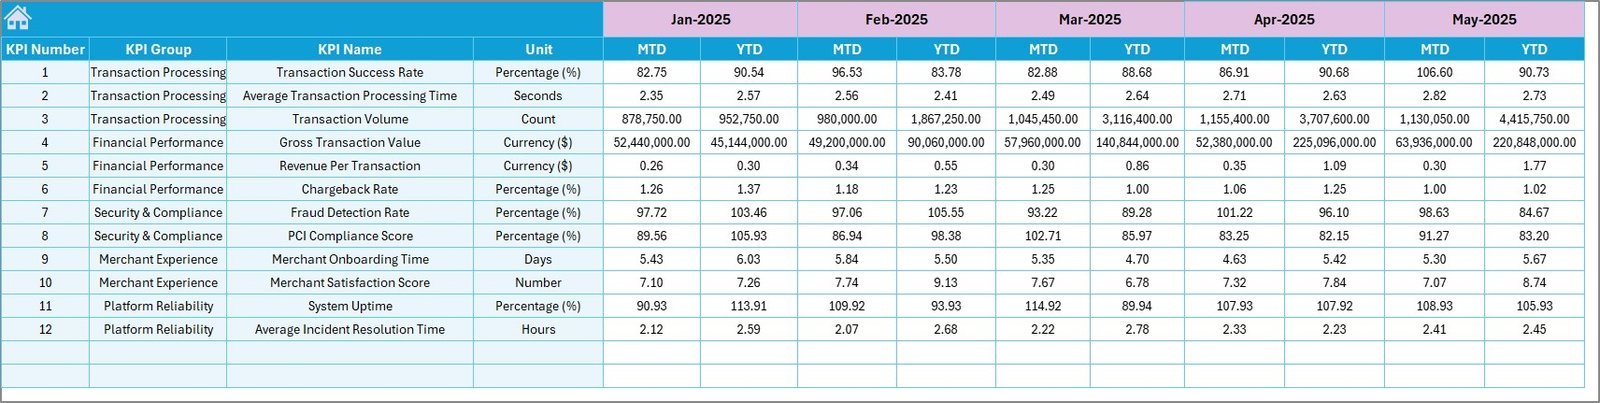
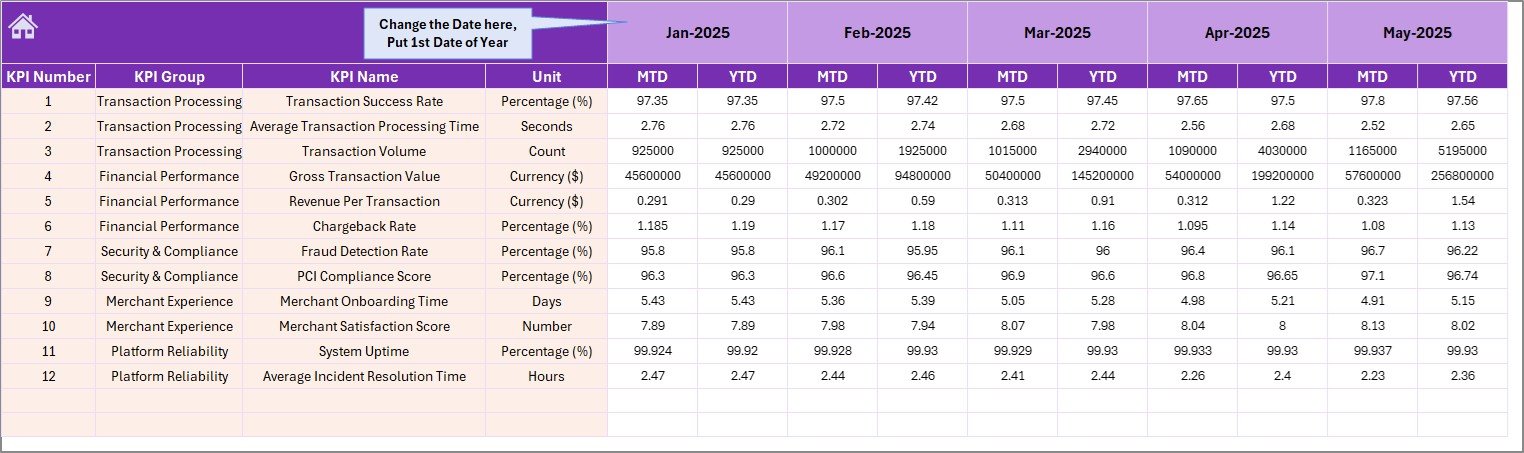
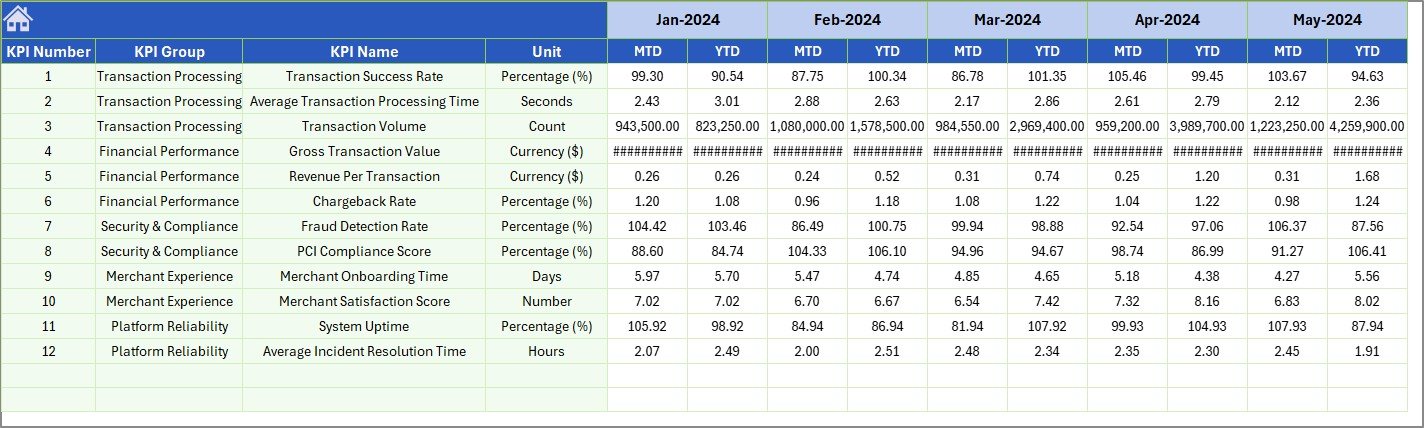
KPI Trend Sheet - 📝 Actual Numbers Input Sheet: Input your actual MTD and YTD numbers per month easily. Change the first month of the year in cell E1 to align data perfectly.
Actual Numbers Input sheet - 🎯 Target Number Input Sheet: Set monthly targets for each KPI, both for MTD and YTD, ensuring your goals are clear and trackable.

Target Number Input sheet - 📅 Previous Year Number Sheet: Enter last year’s numbers for direct comparison with current performance, enabling precise year-over-year analysis.
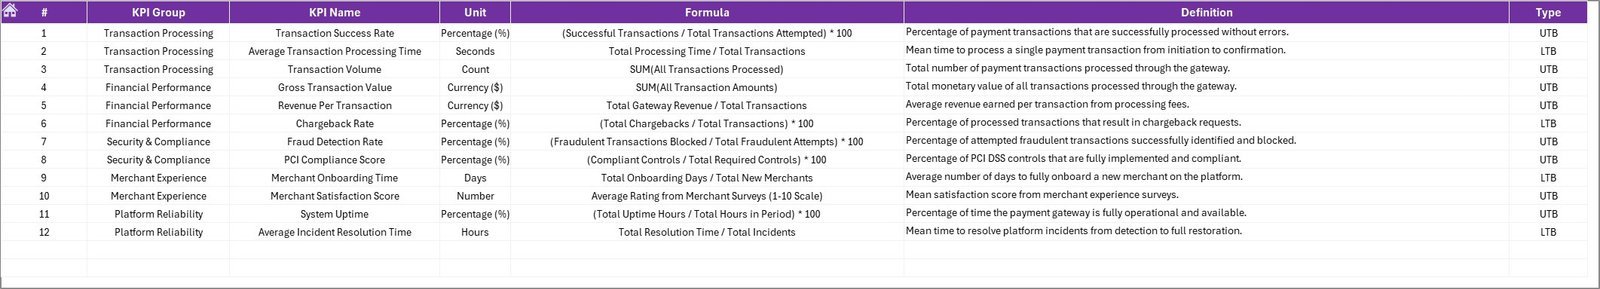
Previous Year Number Input sheet - 📚 KPI Definition Sheet: Maintain a clean and organized database of KPI names, groups, units, formulas, and definitions. Specify KPI type as LTB (Lower the Better) or UTB (Upper the Better) for accurate interpretation.

KPI Definition sheet
What’s Inside the Payment Gateways KPI Dashboard
This all-in-one digital dashboard equips you with everything needed to manage and optimize your payment gateway KPIs. From intuitive input sheets to visually engaging dashboards and trend analysis, the product is designed for ease and efficiency. The dashboard supports monthly updates, year-over-year comparisons, and actionable insights through conditional formatting and trend charts. It simplifies complex data into clear, visual formats that empower quick decision-making.
How to Use the Payment Gateways KPI Dashboard
Getting started is straightforward:
- 🔹 Begin at the Home Sheet to navigate to any section.
- 🔹 Enter your Actual Numbers and Target Numbers on respective sheets for each month.
- 🔹 Input previous year’s data for comparative analysis in the Previous Year Number Sheet.
- 🔹 Use the KPI Definition Sheet to add or update KPI details, ensuring clarity and consistency.
- 🔹 Select the month on the Dashboard Sheet to view dynamic KPI results, including MTD and YTD figures, with easy-to-understand conditional formatting.
- 🔹 Analyze trends on the KPI Trend Sheet by selecting specific KPIs to visualize performance over time.
This dashboard requires no advanced technical skills – just input your data and watch the automated calculations and visualizations do the rest.
Who Can Benefit from This Payment Gateways KPI Dashboard
- 💼 Finance Managers: Track financial KPIs accurately and meet monthly targets.
- 📊 Business Analysts: Analyze trends and provide actionable insights to stakeholders.
- 🛠️ Payment Gateway Operators: Monitor transaction volumes, success rates, and other critical KPIs.
- 🚀 Startup Founders and Executives: Gain a clear picture of payment gateway performance to drive growth.
- 📈 Project Managers: Keep projects aligned with financial goals through precise KPI monitoring.
- 🧑💻 Data Enthusiasts: Customize and expand KPI definitions and formulas for deeper insights.
Click here to read the Detailed blog post.
Visit our YouTube channel to learn step-by-step video tutorials


Reviews
There are no reviews yet.