


In the fast-paced digital economy, payment gateways are the heartbeat of modern business. From e-commerce stores to SaaS subscriptions, tracking transactions, fees, and refunds across multiple providers is crucial — yet complex.
The Payment Gateways Dashboard in Excel solves that problem. This ready-to-use, data-driven solution gives finance and business teams real-time insights into online payment operations — all within the familiar Excel interface.
With powerful analytics, built-in slicers, and automated KPIs, you can monitor gateway performance, identify issues, and improve profitability — without the need for expensive BI tools.
⚙️ Key Features of the Payment Gateways Dashboard in Excel
📊 5 Analytical Pages – Overview, Gateway Name Analysis, Industry Analysis, Country Analysis, and Monthly Trends.
🧭 Page Navigator – Quickly move between pages using the left-side menu.
💰 Comprehensive KPIs – Transaction Volume, Net Revenue, Refund %, Success Rate, and Satisfaction Score.
🎯 Dynamic Filters & Slicers – Filter by Month, Country, Industry, or Gateway Name.
📈 MTD & YTD Comparisons – Track Month-to-Date and Year-to-Date performance automatically.
🌍 Country & Industry Breakdowns – Evaluate which markets or sectors perform best.
🔄 Excel-Integrated Data Model – Refresh your dataset anytime with a single click.
📊 Charts & Visuals – Failure %, Fees by Gateway, Refund Trends, and Customer Satisfaction by Region.
💻 100 % Excel-Based – No coding or add-ins required — simply plug in your data and go.
📊 What’s Inside the Dashboard
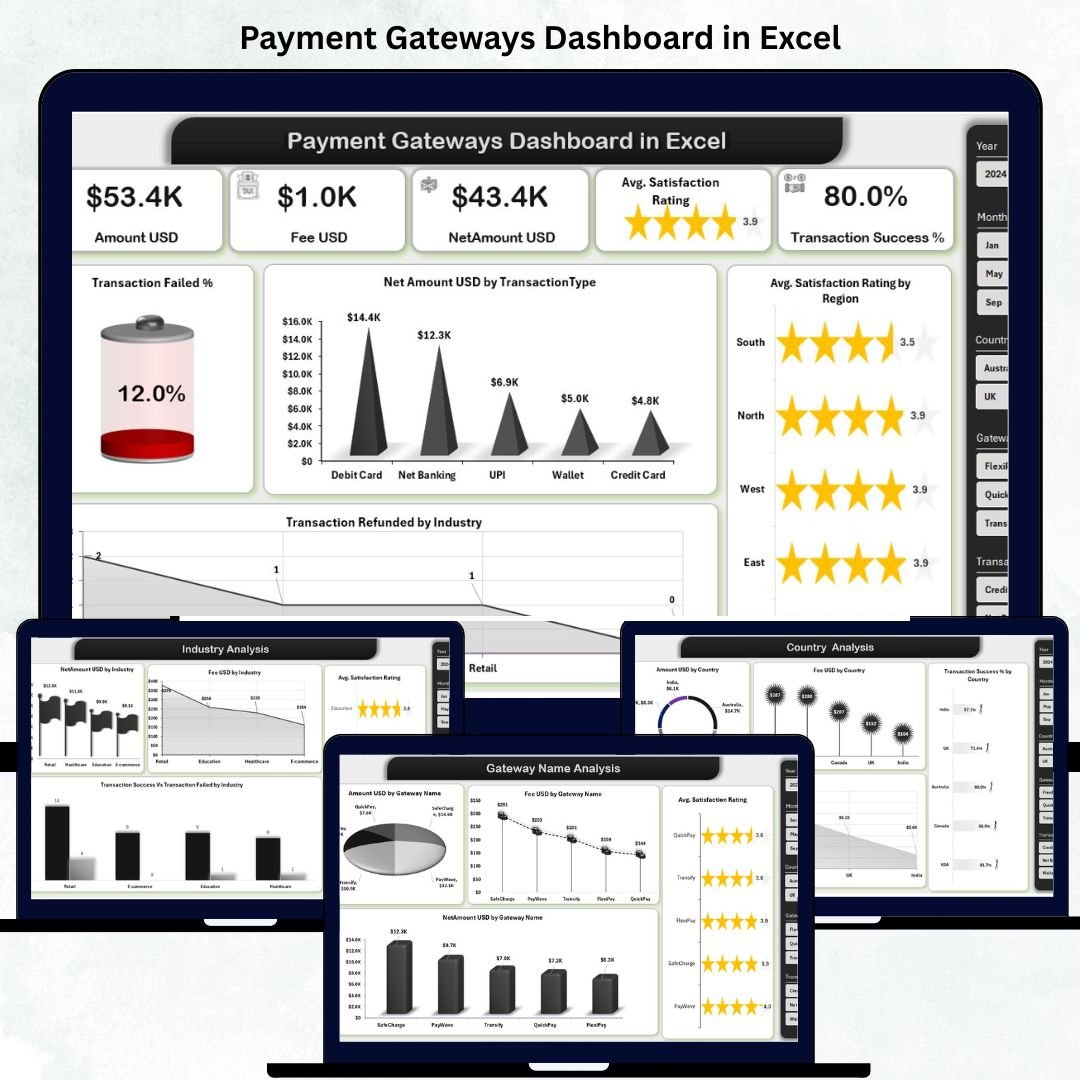
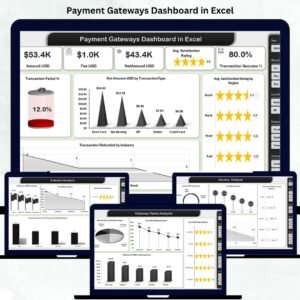
🏠 1️⃣ Overview Page — Your Central Control Panel
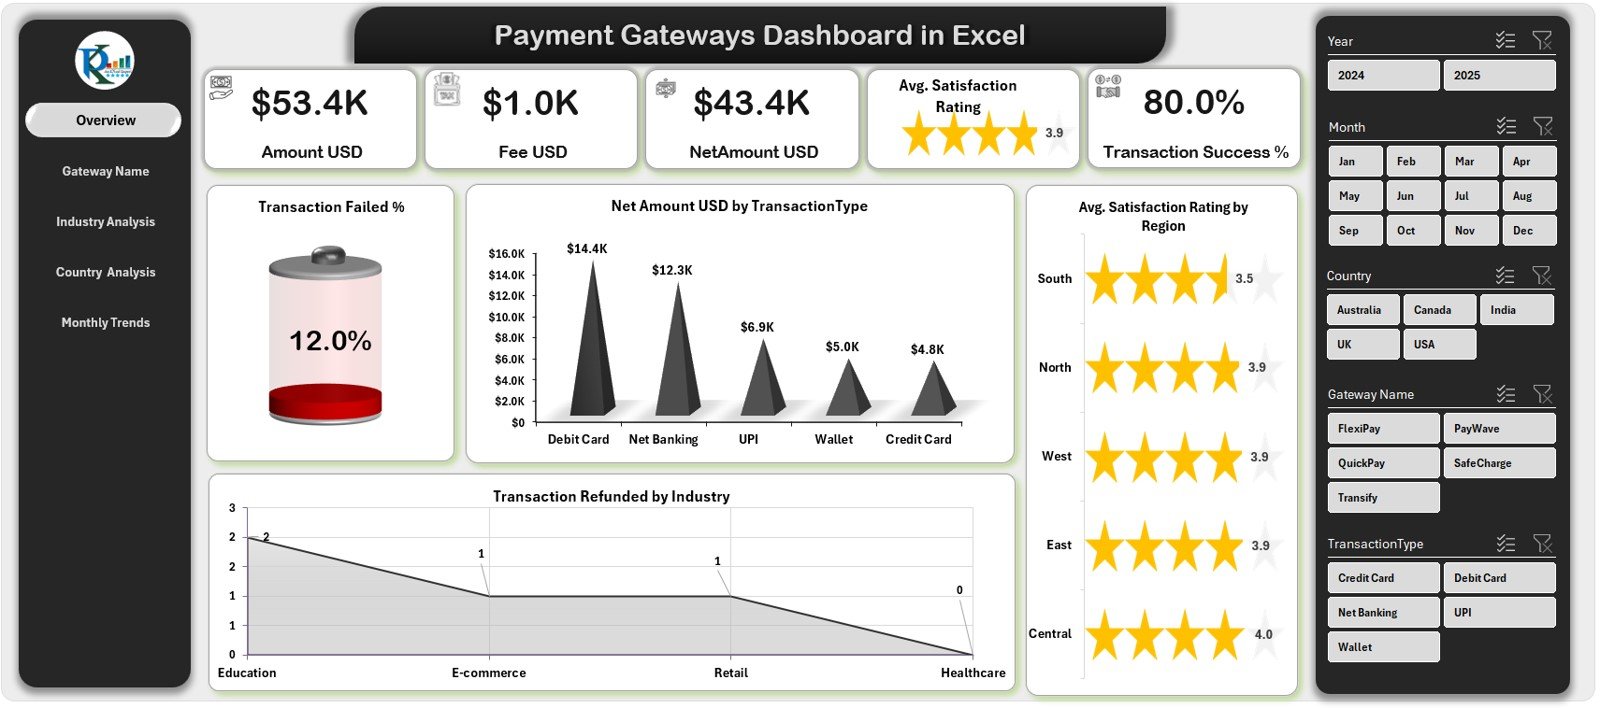
The main dashboard displaying all essential KPIs at a glance:
5 KPI Cards showing totals for Transactions, Net Revenue, Refund %, and Success Rate.
Charts for Failed Transactions %, Refunds by Industry, and Satisfaction Rating by Region.
🎯 Purpose: Give executives a quick snapshot of performance and identify trends instantly.
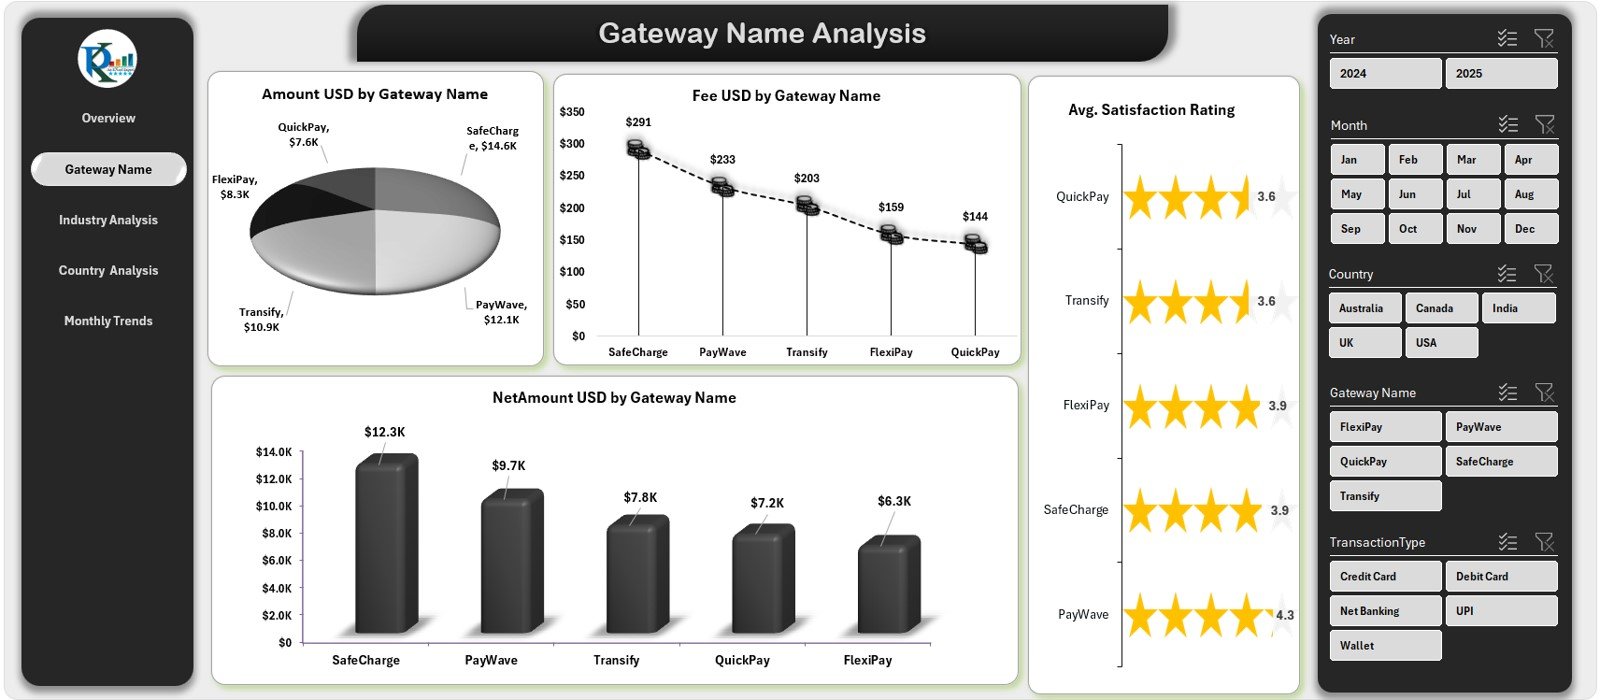
🧾 2️⃣ Gateway Name Analysis — Compare Providers
Analyze each payment gateway (PayPal, Stripe, Razor pay, etc.) side by side.
Charts for Total Amount, Fees, Net Revenue, and Average Satisfaction by Gateway.
Filter by month, industry, or country using interactive slicers.
💡 Purpose: Detect which gateways yield higher revenue and lower transaction costs.
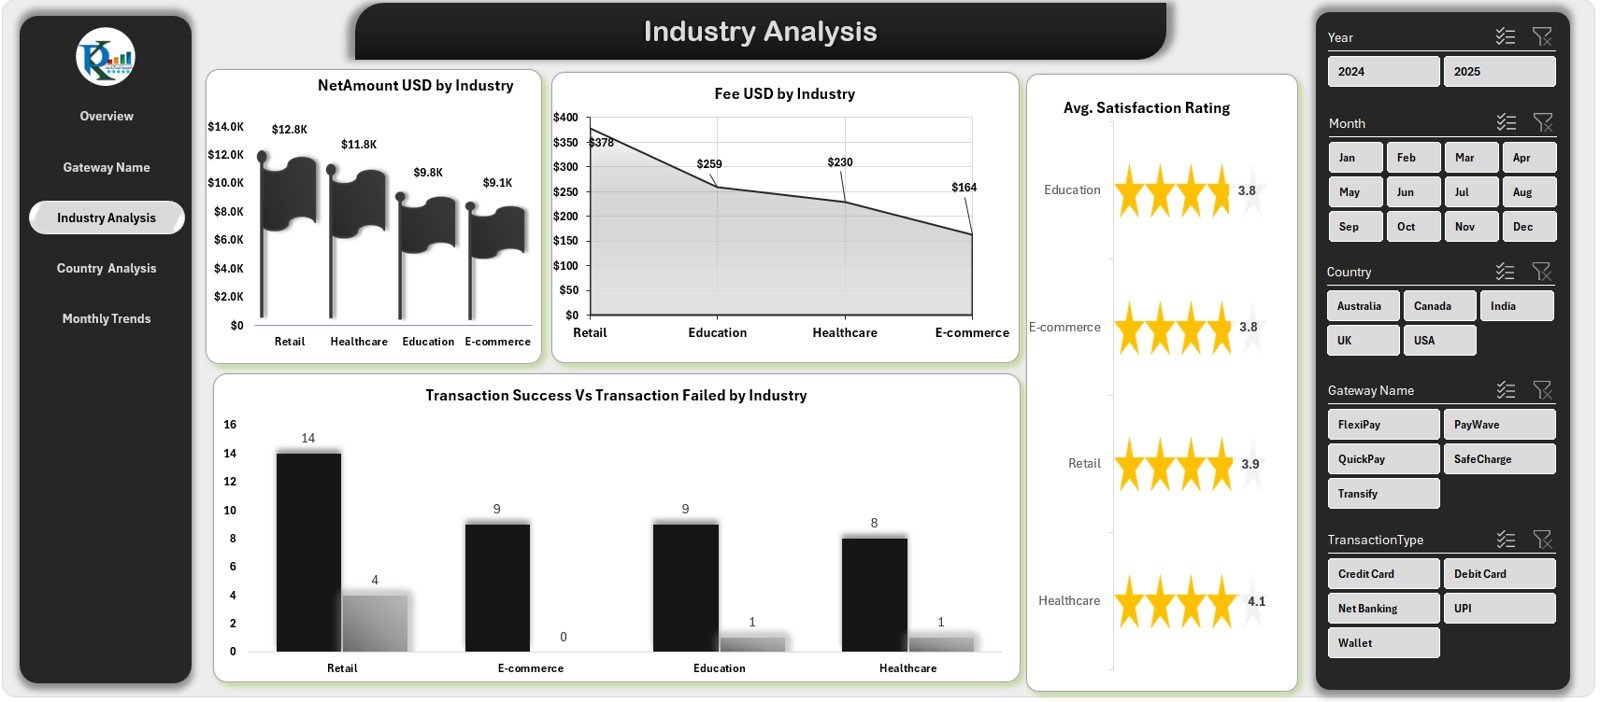
🏭 3️⃣ Industry Analysis — Know Your Sectors
Break down performance by industry such as retail, travel, or finance.
Charts for Net Amount by Industry, Fees, and Success vs Failure Rates.
Monitor average customer satisfaction by sector to enhance service quality.
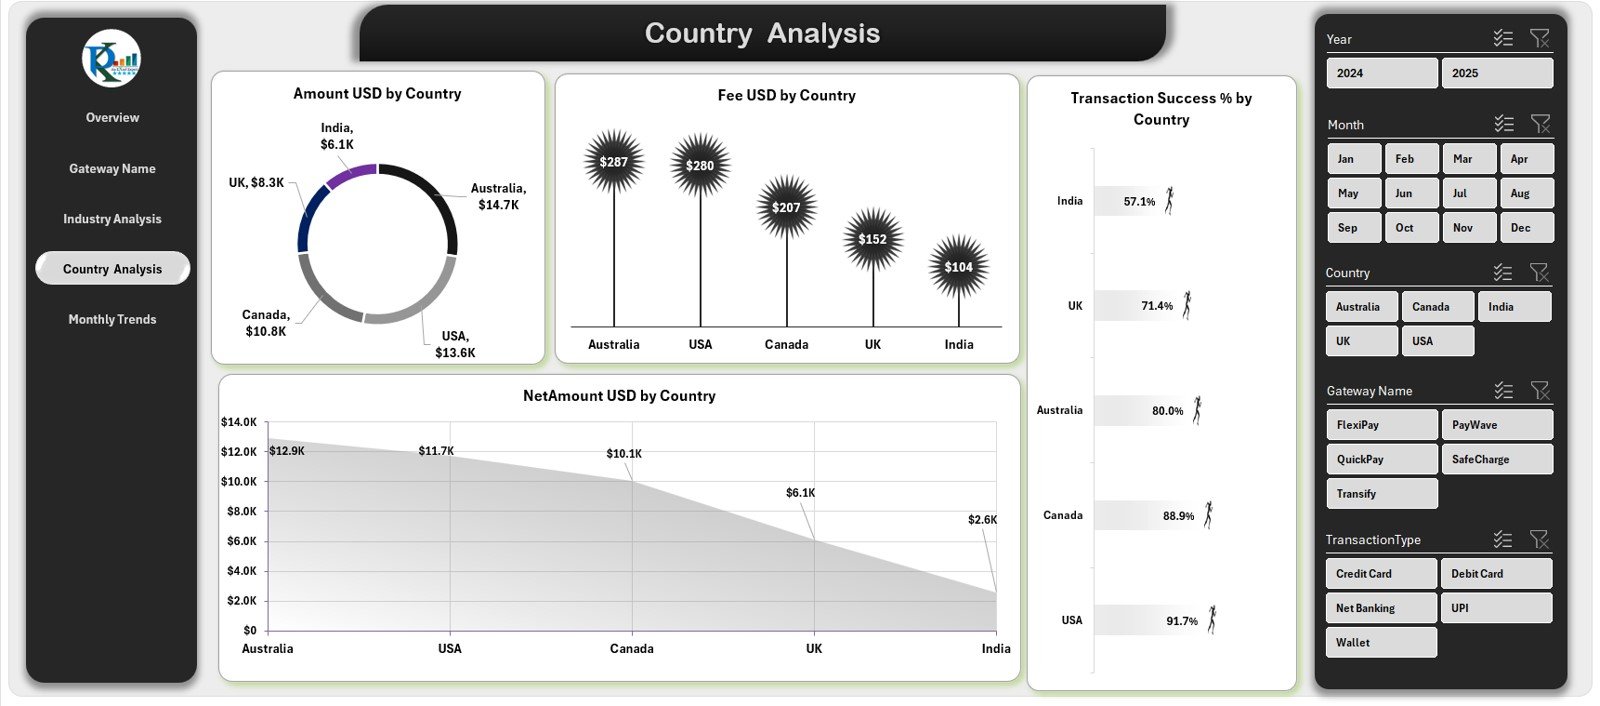
🌎 4️⃣ Country Analysis — Regional Performance View
Evaluate gateway performance across countries.
Visuals for Amount, Fee, Net Revenue, and Transaction Success %.
Understand regional differences in payment behavior and fees.
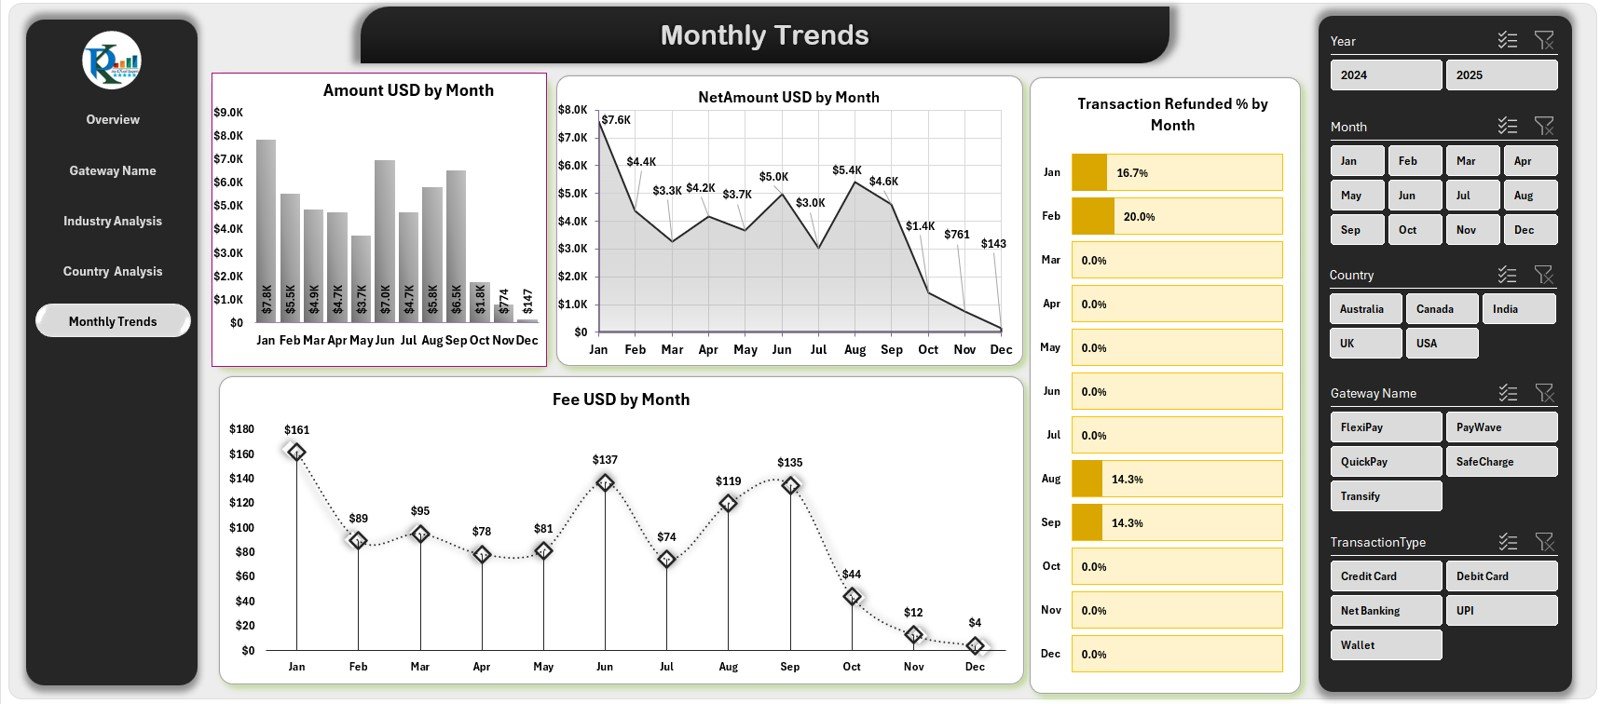
📅 5️⃣ Monthly Trends Page — Track Growth Over Time
Follow monthly changes in transactions, fees, refunds, and net revenue.
Charts for Amount by Month, Refund %, and Fee Variance.
Forecast future revenue based on seasonal patterns.
🌟 Advantages of the Payment Gateways Dashboard
✅ All-in-One Monitoring: Analyze Stripe, PayPal, Razor pay and more in one file.
✅ Real-Time Insights: Automatic updates enable faster financial decisions.
✅ Reduced Manual Work: No need for multiple reports or merging CSVs.
✅ Cost-Effective: Professional analytics without BI software fees.
✅ Customizable: Add KPIs like Chargeback Rate or Processing Time.
✅ Improved Accuracy: Eliminate manual errors with pre-built calculations.
✅ Customer Focus: Link payment data with satisfaction trends for experience improvement.
🧠 Best Practices for Effective Use
📌 Refresh data weekly or monthly for up-to-date insights.
📌 Validate gateway fees and refunds against provider reports.
📌 Protect sensitive financial data with password security.
📌 Use conditional formatting to spot performance shifts quickly.
📌 Focus on key KPIs like Success Rate and Refund % for clear decision-making.
👥 Who Can Benefit from This Dashboard
💼 Finance Teams: Simplify payment reconciliation and monthly analysis.
🛒 E-commerce Managers: Track sales and gateway fees by region or platform.
📊 Data Analysts: Uncover patterns and detect anomalies in transactions.
🏢 Executives & Founders: Gain a bird’s-eye view of payment health and customer experience.
🔗 Click Here to Read the Detailed Blog Post
📺 Visit our YouTube Channel for step-by-step tutorials.
Watch the step-by-step video tutorial:
Compatibility and Requirements
- Works in Microsoft Excel desktop (Excel 2016 or later, or Microsoft 365).
- The dashboard uses slicers to filter by month, country, industry and gateway name. Microsoft explains them in Use slicers to filter data.
Frequently Asked Questions
Which pages does the dashboard have?
Five pages: Overview, Gateway Name Analysis, Industry Analysis, Country Analysis and Monthly Trends. A page navigator on the left side moves you between them.
Which KPIs does it track?
Transaction volume, net revenue, refund %, success rate and customer satisfaction score. It also shows month-to-date and year-to-date figures.
Can I filter the data?
Yes. Slicers let you filter by month, country, industry or gateway name, so you can compare providers such as Stripe, PayPal and Razorpay side by side.
Do I need add-ins or coding skills?
No. The dashboard is built in Excel only. You add your own data and refresh the data model.
Is there a Power BI or KPI version?
Yes. See the Payment Gateways Dashboard in Power BI and the Payment Gateways KPI Dashboard in Excel.
Related Payment Templates
- Payment Gateways Dashboard in Power BI: the same topic as a Power BI report
- Payment Gateways KPI Dashboard in Excel: a KPI-focused view of gateway performance
- Vendor Payment Dashboard in Excel: track payments made to vendors
- Payment Processing Tracker in Google Sheets: log payments in a spreadsheet
- Finance & Accounting Command Center: 8 finance templates in one download
Browse all Excel dashboards.





















Reviews
There are no reviews yet.