

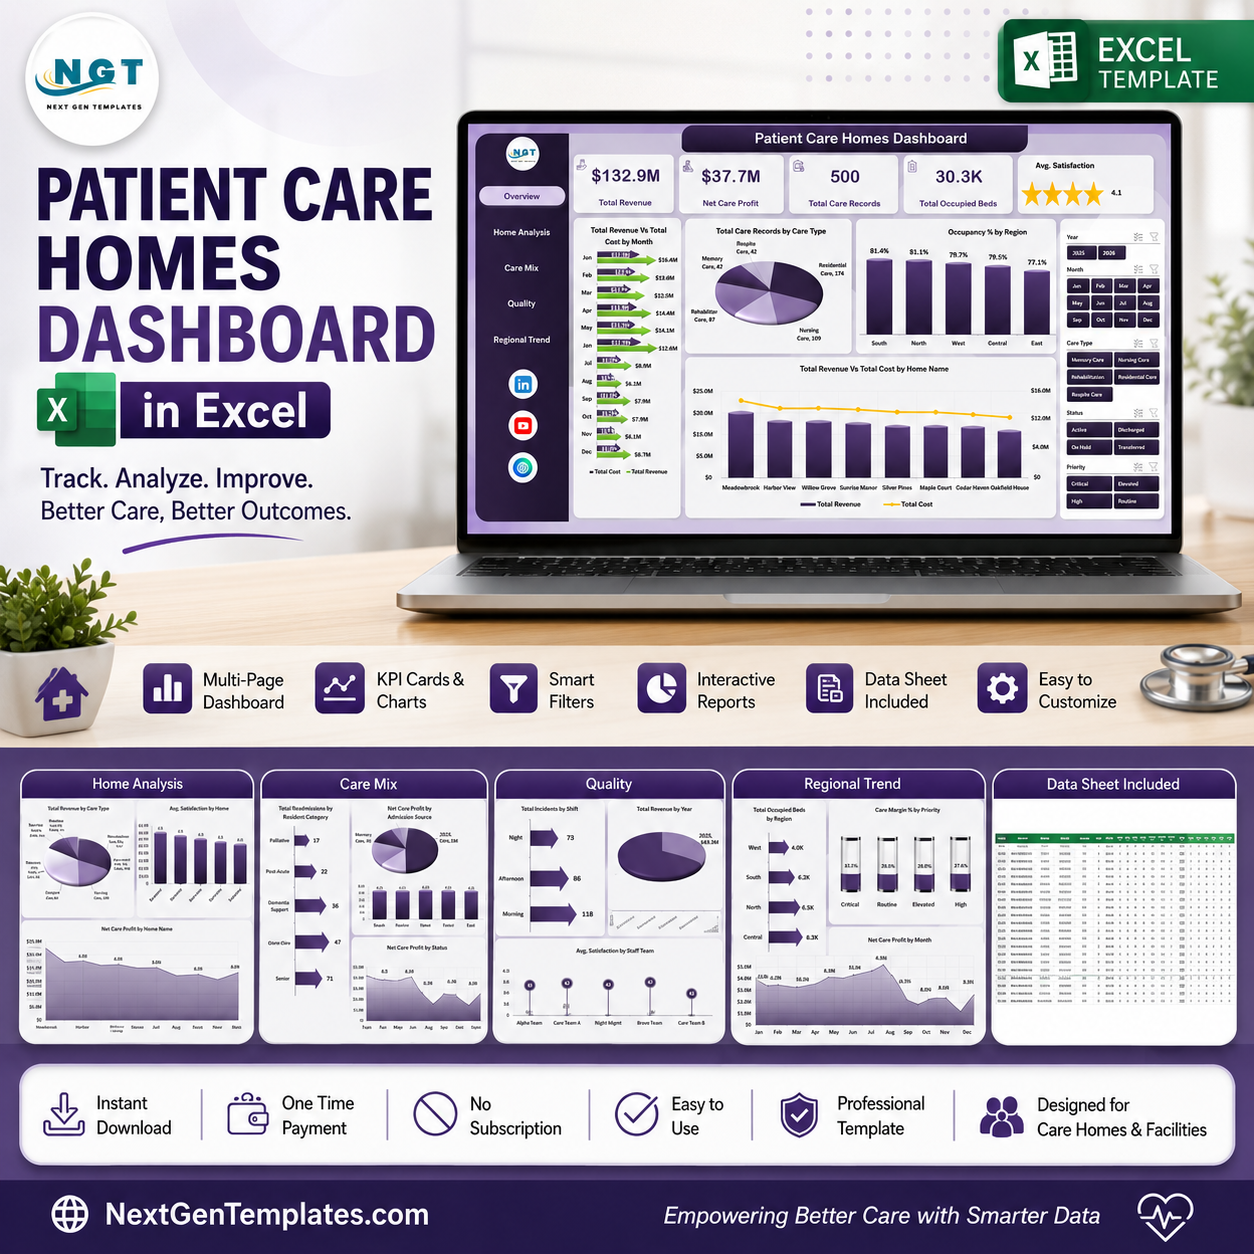



Patient Care Homes Dashboard in Excel helps care home owners, facility administrators, operations teams, finance leads, and quality managers monitor revenue, cost, occupancy, care records, readmissions, incidents, satisfaction, staff teams, regions, and care mix in one editable workbook. CDC FastStats reports 14,700 U.S. nursing homes, 1.6 million licensed beds, and 1.2 million residents in 2022, which shows why structured reporting matters in residential care. This template gives you a ready Excel reporting layer with no monthly software subscription, instant download, editable sheets, and a practical refresh workflow.
Key Features of Patient Care Homes Dashboard in Excel
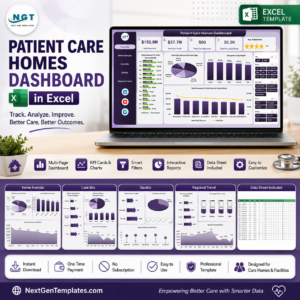
- 5 dashboard pages: Overview, Home Analysis, Care Mix, Quality, and Regional Trend.
- 5 KPI cards: Total Revenue, Net Care Profit, Total Care Records, Total Occupied Beds, and Avg. Satisfaction.
- 19 analysis charts: Review revenue, cost, profit, beds, occupancy, readmissions, incidents, care type, priority, status, shift, staff team, region, and home name.
- Interactive slicers: Filter the dashboard quickly and review only the care home records you need.
- Editable Data sheet: Add your source data in the same table format and refresh the dashboard.
- Pivot-powered Support sheet: Built with PivotTables so cards and charts update after Refresh All.
What’s Inside the Patient Care Homes Dashboard in Excel
1 – Overview Page
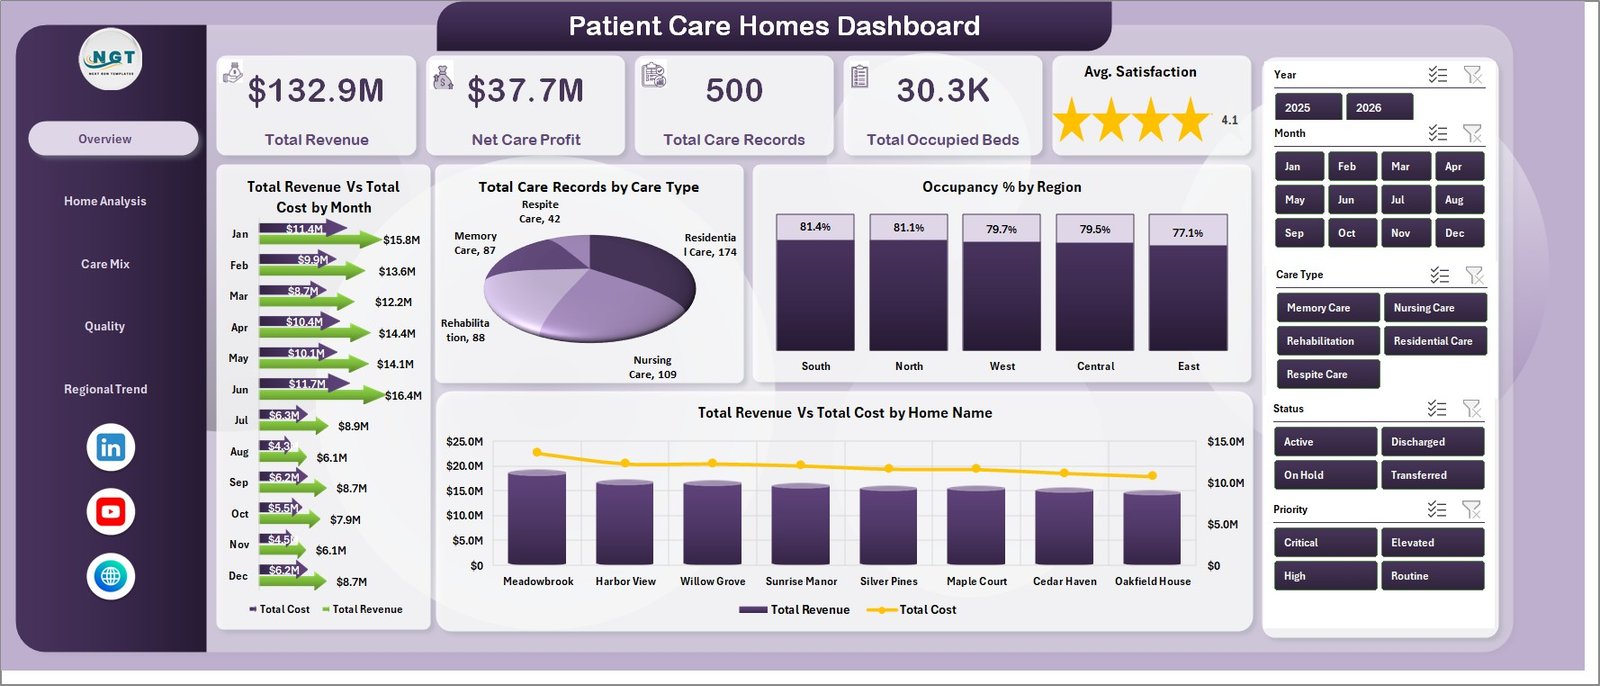
The Overview page gives a leadership-level snapshot of care home performance. KPI cards show Total Revenue, Net Care Profit, Total Care Records, Total Occupied Beds, and Avg. Satisfaction so users can review financial, operational, and experience metrics at a glance.
Total Revenue Vs Total Cost by Month: Compares monthly revenue and cost so finance teams can see whether care delivery remains profitable over time. It also helps highlight seasonal cost pressure or revenue dips.
Total Care Records by Care Type: Breaks care activity by care type so managers can understand the service mix. This is useful for planning staff capacity and reviewing demand across different care categories.
Occupancy % by Region: Shows how bed utilization differs by region. It helps leaders spot underused capacity or regions that may need more beds, staffing, or operational attention.
Total Revenue Vs Total Cost by Home Name: Compares financial performance across individual homes. It supports home-level review and helps identify locations with stronger or weaker care margins.
2 – Home Analysis
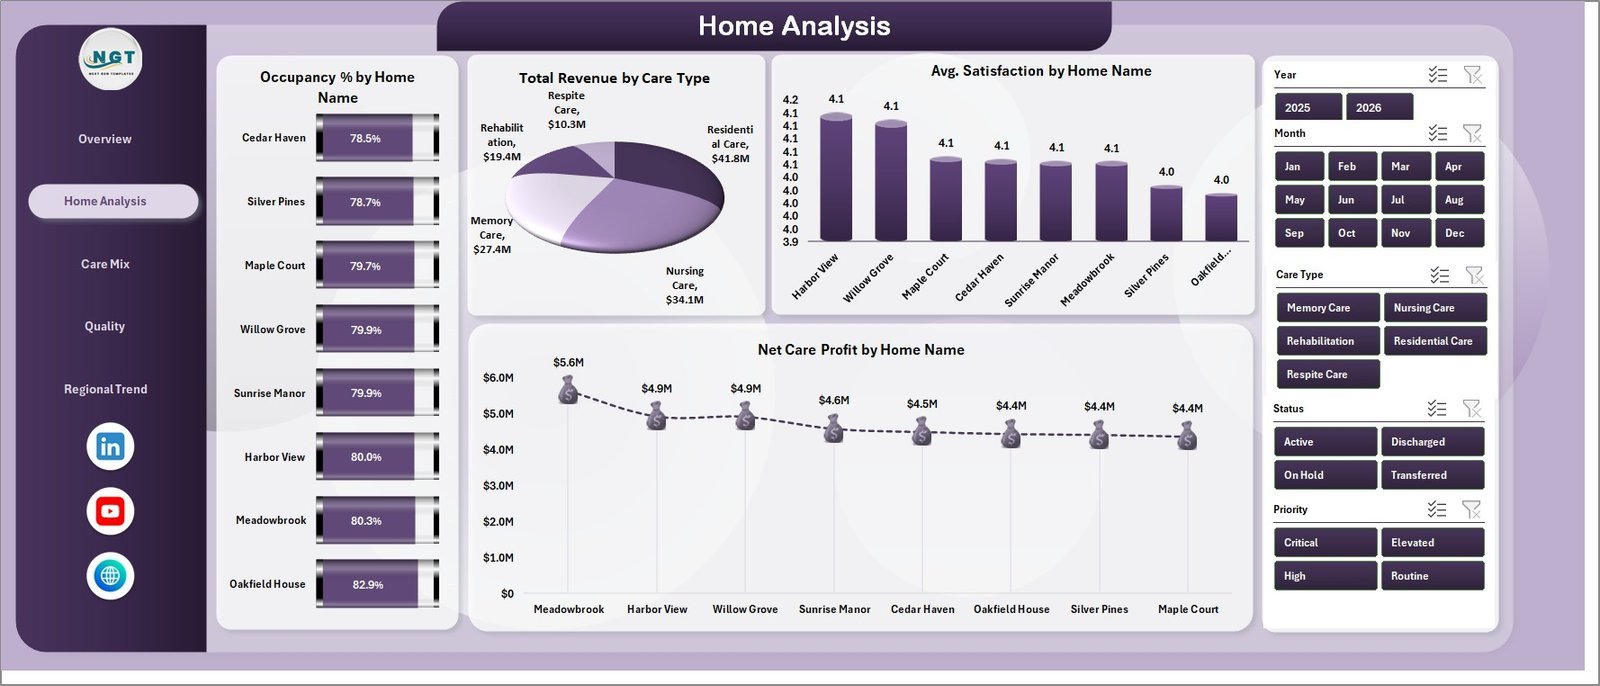
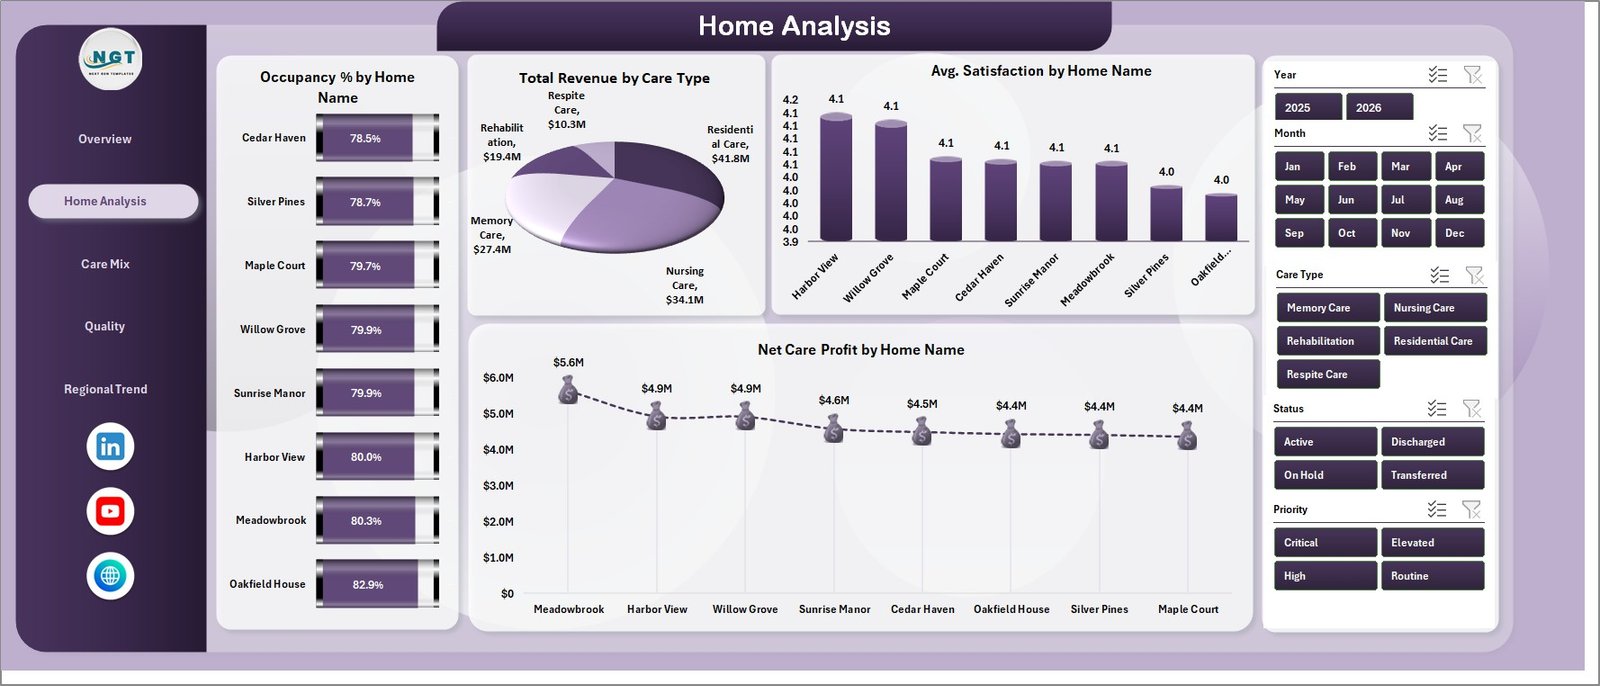
The Home Analysis sheet focuses on location-level performance. Occupancy % by Home Name compares bed usage across care homes. Total Revenue by Care Type shows which care services generate the most revenue. Avg. Satisfaction by Home Name compares resident or family experience across homes. Net Care Profit by Home Name highlights which homes contribute the most profit.
3 – Care Mix
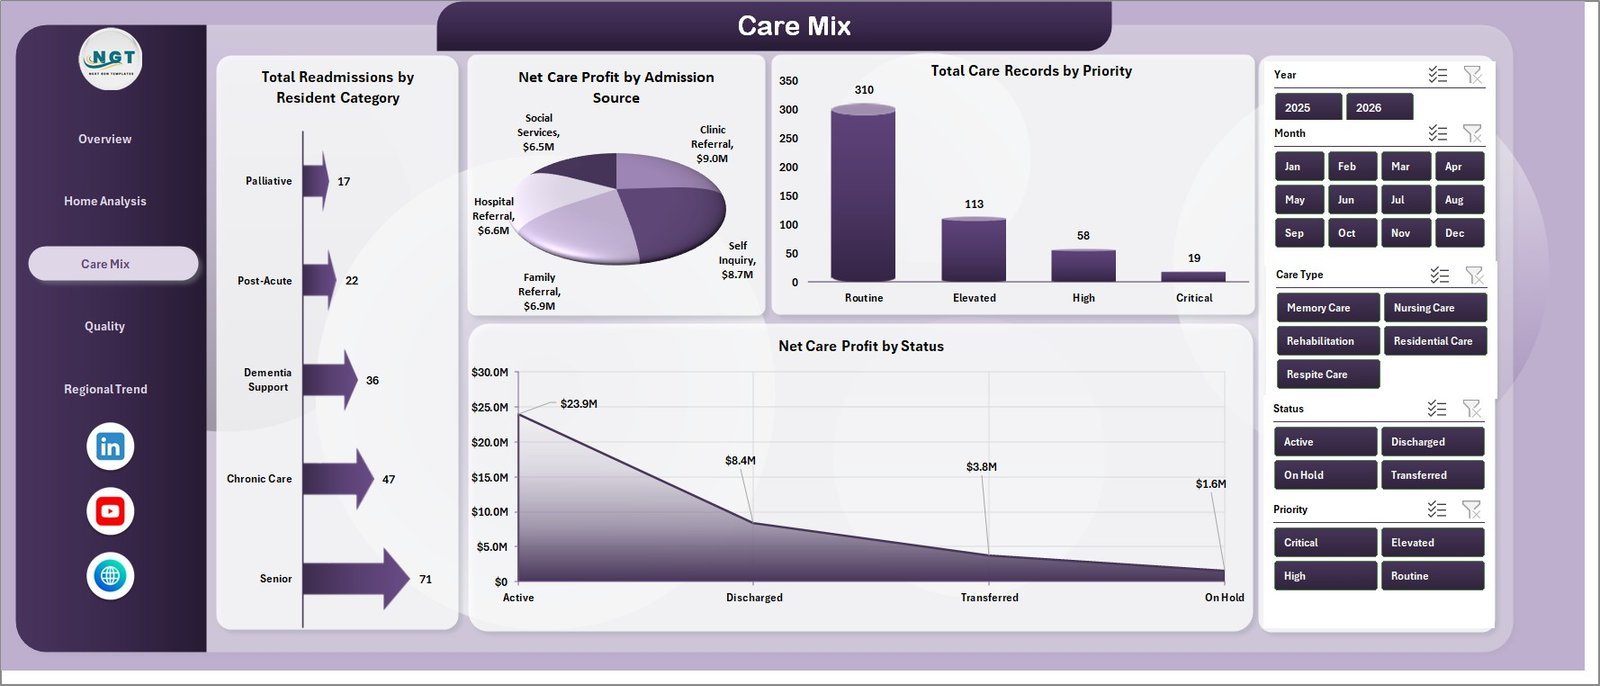
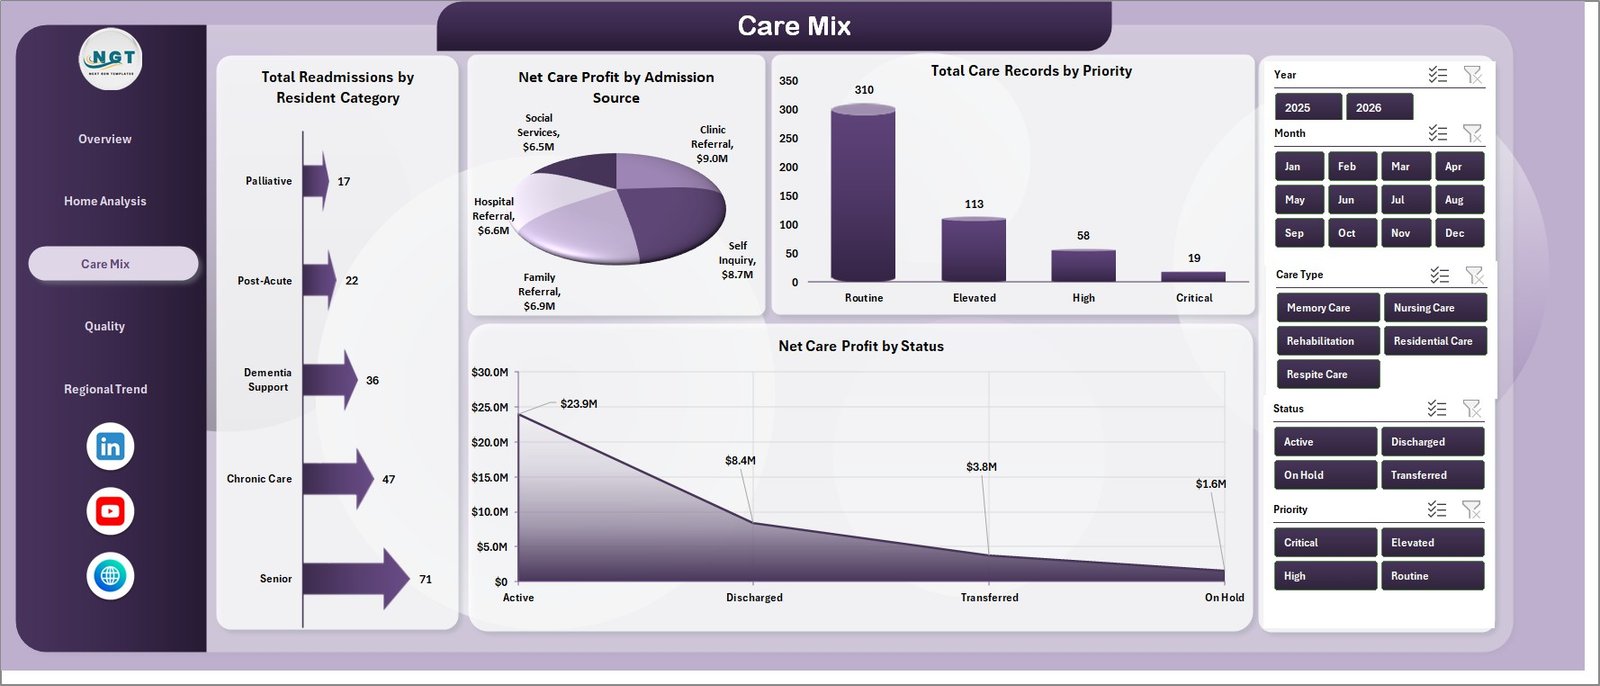
The Care Mix sheet reviews operational mix, admission sources, priorities, and case statuses. Total Readmissions by Resident Category helps identify categories with higher readmission volume. Net Care Profit by Admission Source compares profitability by referral or admission channel. Total Care Records by Priority shows workload by care priority. Net Care Profit by Status connects case status with financial results.
4 – Quality
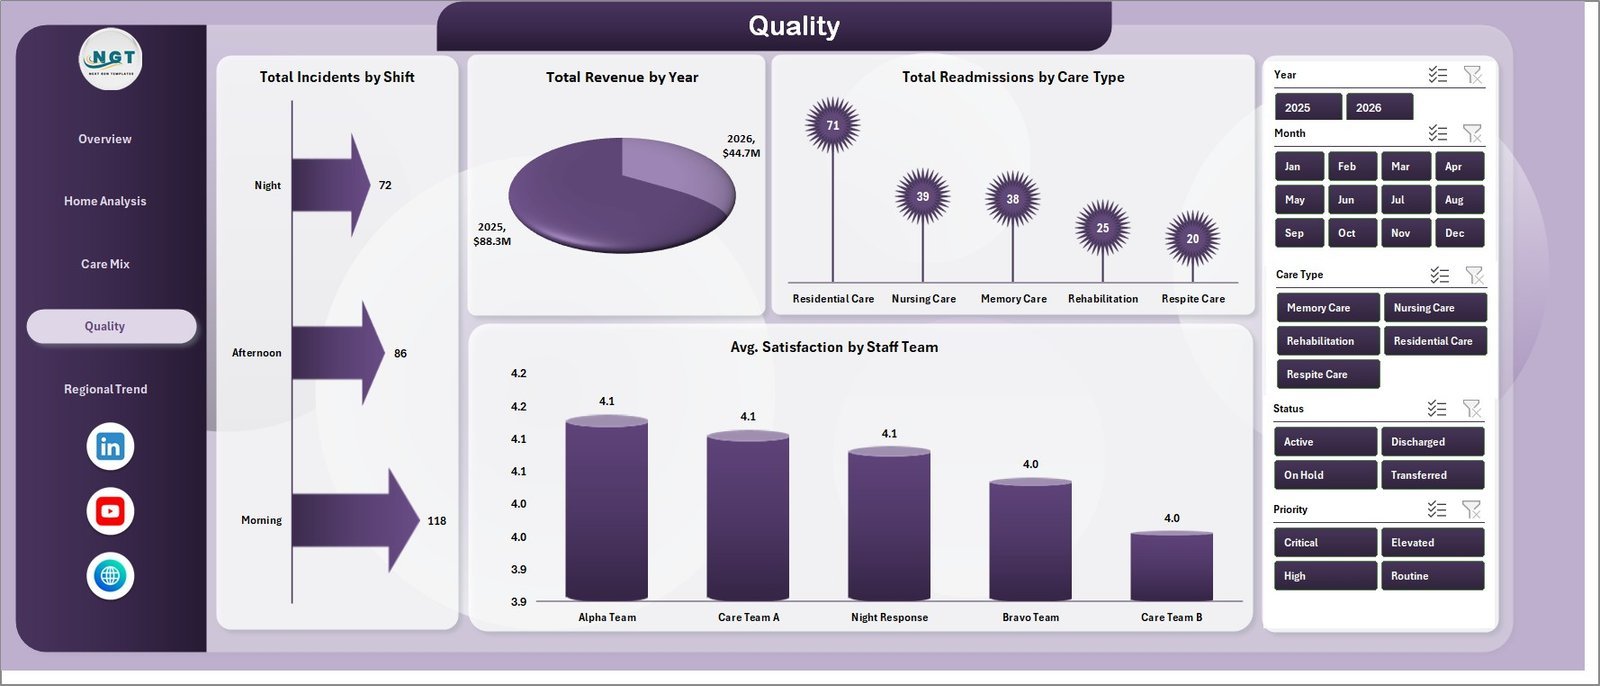
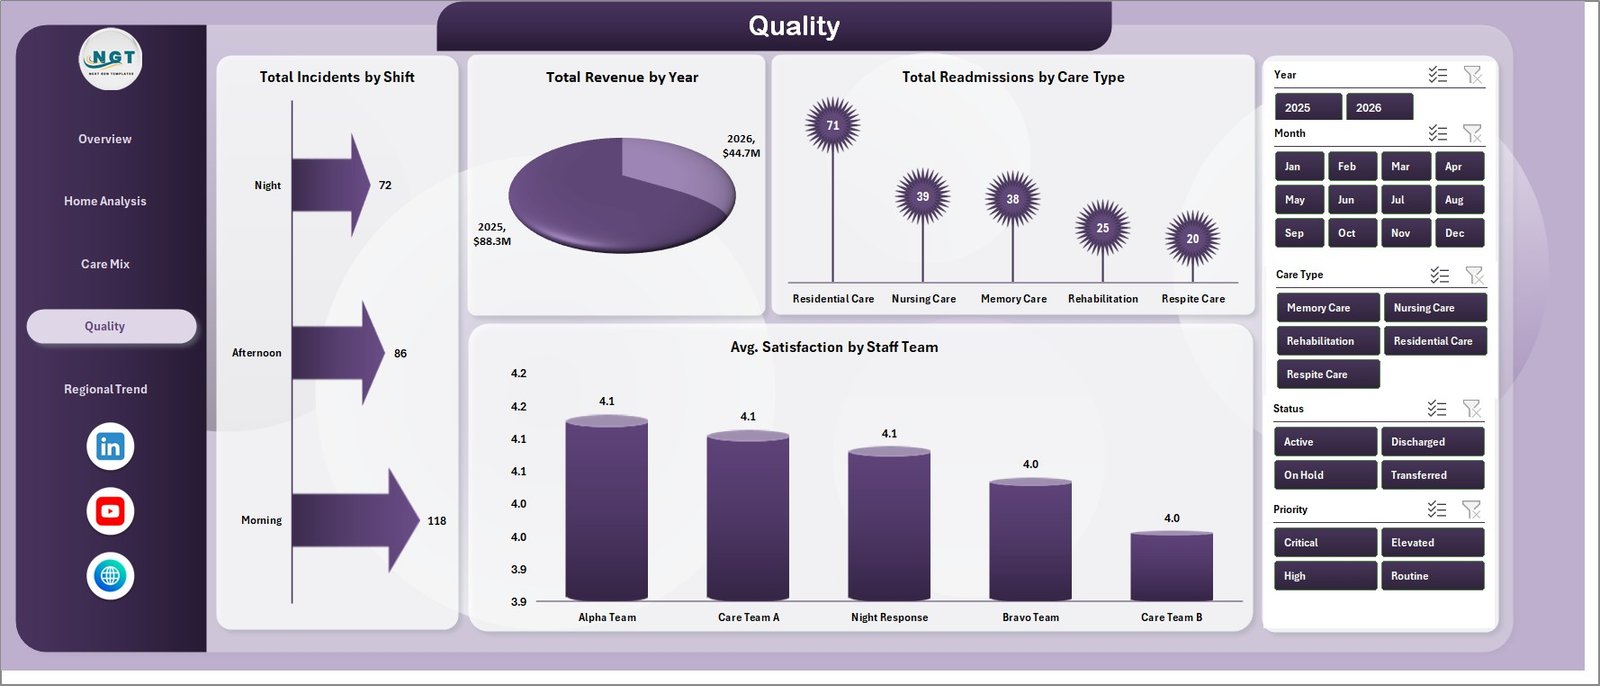
The Quality sheet supports care quality and outcome review. Total Incidents by Shift highlights when incidents occur most often. Total Revenue by Year shows annual revenue movement. Total Readmissions by Care Type helps teams review care areas linked with readmission volume. Avg. Satisfaction by Staff Team compares experience results across staff teams.
5 – Regional Trend
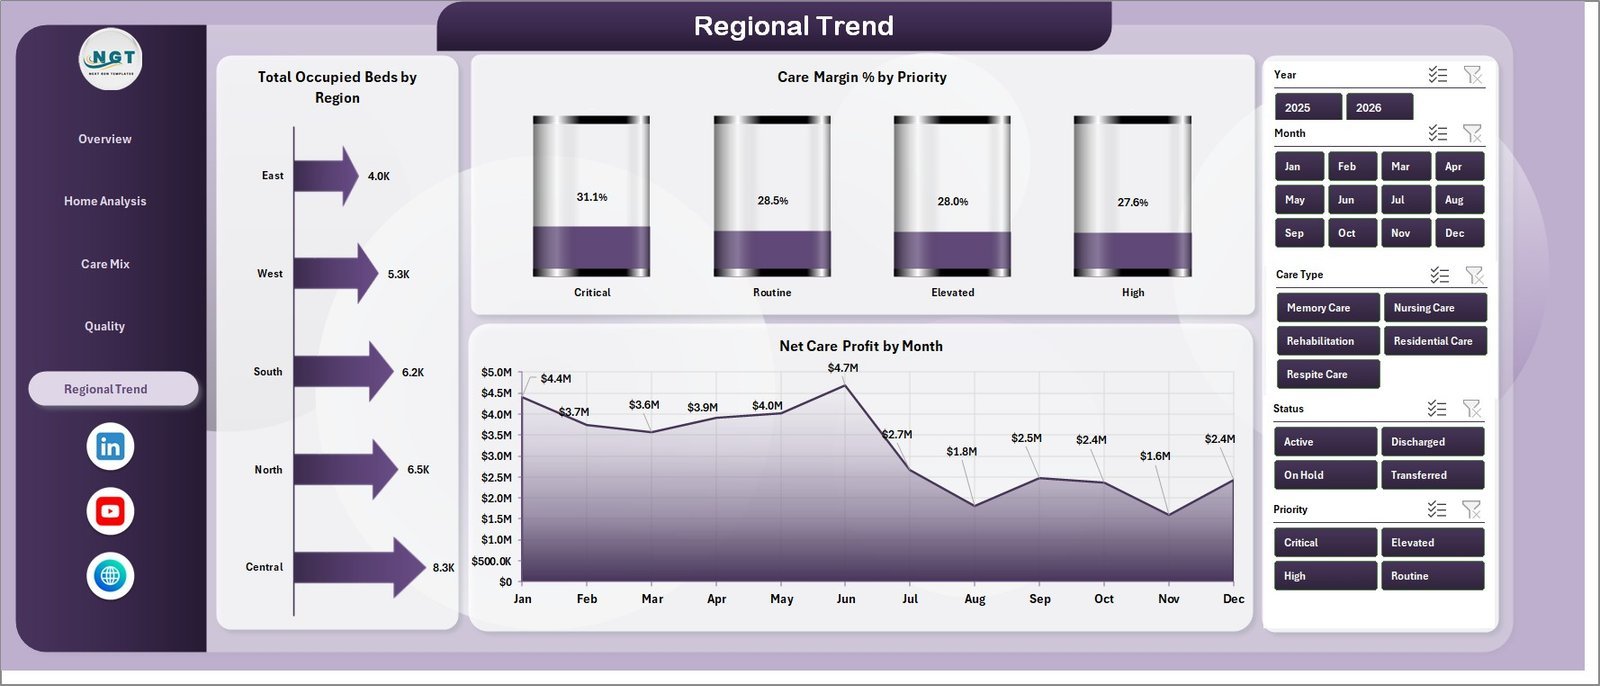
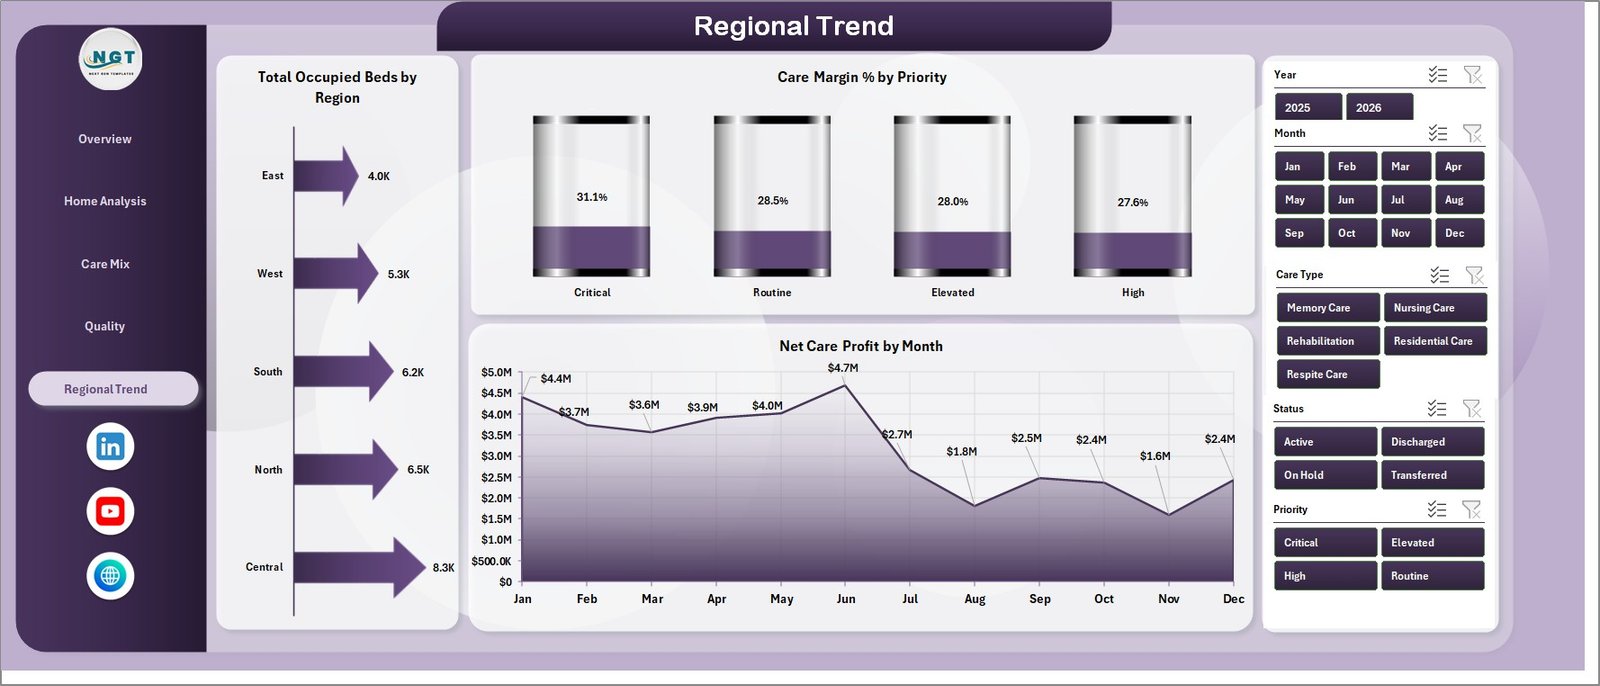
The Regional Trend page is designed for regional and monthly performance review. Total Occupied Beds by Region shows where care home occupancy is concentrated. Care Margin % by Priority compares profitability by priority level. Net Care Profit by Month tracks profit movement across time.
6 – Data Sheet Tab
The Data sheet is where you add your patient care home records in the same format as the sample table. Keep the headers and structure unchanged so the dashboard, slicers, PivotTables, and charts continue to work correctly.

7 – Support Sheet
The Support sheet contains multiple PivotTables used to create the dashboard dynamically. After updating the Data sheet, go to the Data tab in the Excel Ribbon and click Refresh All. You can keep this sheet hidden during normal dashboard use.

Patient Care Homes Dashboard in Excel vs. Google Sheets vs. Paid Healthcare SaaS – Where This Fits
| Feature | This Excel dashboard | Google Sheets alternative | Paid healthcare SaaS |
|---|---|---|---|
| Cost | $17.99 sale price, one-time | Low software cost, but often requires manual build | Monthly or annual subscription |
| Platform | Microsoft Excel | Browser spreadsheet | Vendor cloud system |
| Setup time | Replace data and refresh | Build pivots, charts, slicers, and permissions | Implementation and onboarding |
| Real-time team collaboration | Available through OneDrive or SharePoint | Native collaboration | Usually included by plan |
| Mobile access | Limited through Excel mobile or shared files | Good browser access | Usually included |
| Customizable fields | Editable workbook, data sheet, pivots, and charts | Editable but manual | Often limited by vendor configuration |
| Share with link | Possible through Microsoft 365 sharing | Native link sharing | Login controlled |
| Year-1 cost at 5 users | Template price plus any Microsoft licensing | Low license cost plus setup time | Often much higher |
| Care home reporting | Built around revenue, cost, occupancy, beds, satisfaction, readmissions, incidents, care type, priority, region, and home name | Requires custom design | Depends on reporting module and export access |
Who This Template Is For – and Who It’s Not For
This template is for patient care home owners, residential care administrators, operations managers, care quality leads, finance analysts, healthcare consultants, and regional managers who already have structured care home data and need a repeatable Excel dashboard.
It is not an EHR, clinical decision support product, claims system, patient registry, compliance platform, billing engine, or live care alert system. Use it as a management reporting workbook after your data has been exported or prepared in spreadsheet format.
How to Use the Patient Care Homes Dashboard in Excel
- Download and unzip the product file.
- Open the workbook in Microsoft Excel.
- Go to the Data Sheet tab and replace the sample rows.
- Keep the same column headers and table format.
- Open the Data tab in the Excel Ribbon and click Refresh All.
- Use slicers to filter the pages by home, region, care type, status, priority, staff team, shift, month, or other available fields.
Real-World Use Cases
Care home administrator: Reviews occupancy, beds, satisfaction, incidents, and care records before weekly operations meetings.
Healthcare finance analyst: Compares revenue, cost, net care profit, care margin, and admission source performance for monthly reporting.
Quality manager: Tracks readmissions, incidents by shift, satisfaction by staff team, and care type trends for improvement planning.
Frequently Asked Questions
What does this dashboard track?
It tracks revenue, cost, net care profit, care records, occupied beds, satisfaction, occupancy percentage, readmissions, incidents, care type, home name, region, priority, status, shift, staff team, admission source, and month.
Can I use my own care home data?
Yes. Replace the sample rows on the Data sheet while keeping the same structure, then refresh the workbook.
Does it require macros?
No macro requirement is stated. The workflow uses Excel tables, PivotTables, slicers, charts, and Refresh All.
Can I customize the dashboard?
Yes. You can edit charts, colors, formulas, fields, slicers, sheet names, and PivotTables in Microsoft Excel.
Can the Support sheet be hidden?
Yes. The Support sheet powers the dashboard and can remain hidden for normal users.
Is this a clinical system?
No. It is an analytics workbook for prepared data, not a clinical record system or compliance application.
About the Author
Built by PK – Microsoft Certified Professional with 15+ years of Excel, Google Sheets, and Power BI experience. Founder of NextGenTemplates, reaching 300K+ subscribers across YouTube channels. Every template is hand-built and tested before release.
Explore Related Templates
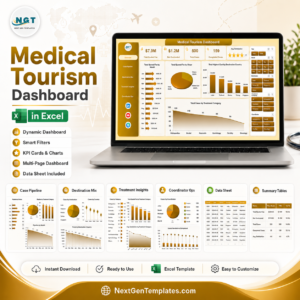
You may also like Nursing Homes Dashboard in Excel, Palliative Care Dashboard in Excel, and Medical Tourism Dashboard in Excel. Browse more Excel Dashboard templates and Health and Safety Excel templates.
Download the Patient Care Homes Dashboard in Excel to review revenue, cost, occupancy, satisfaction, quality, and regional trends in one editable workbook.
Last updated: July 21, 2026
Watch the step-by-step video tutorial:
Compatibility and Requirements
- Works in Microsoft Excel desktop (Excel 2016 or later, or Microsoft 365).
- The dashboard uses slicers to filter by home, region, care type and other fields. Microsoft explains them in Use slicers to filter data.
More Questions About This Template
Is there a Power BI version?
Yes. See the Patient Care Homes Dashboard in Power BI.
Do I need a different dashboard for home healthcare?
This template is built around care homes and their beds, occupancy and care records. For care delivered at a patient’s own home, see the Home Healthcare Dashboard in Excel.
Why do the charts not change after I paste new rows?
The charts are built on PivotTables on the Support sheet. After you update the Data sheet, open the Data tab in the Excel Ribbon and click Refresh All.
Which charts show readmissions and incidents?
Readmissions appear by resident category on the Care Mix page and by care type on the Quality page. Incidents appear by shift on the Quality page.
Related Healthcare Dashboards
- Patient Care Homes Dashboard in Power BI: the same care home reporting in Power BI
- Healthcare Dashboard in Excel: a broader healthcare view in Excel
- Home Healthcare Dashboard in Excel: for care delivered at the patient’s home
- Healthcare KPI Dashboard in Excel: a KPI-focused healthcare workbook
- Healthcare & Hospital Management Bundle: 8 healthcare templates in one download
Browse all Excel KPI dashboards.




















Reviews
There are no reviews yet.