

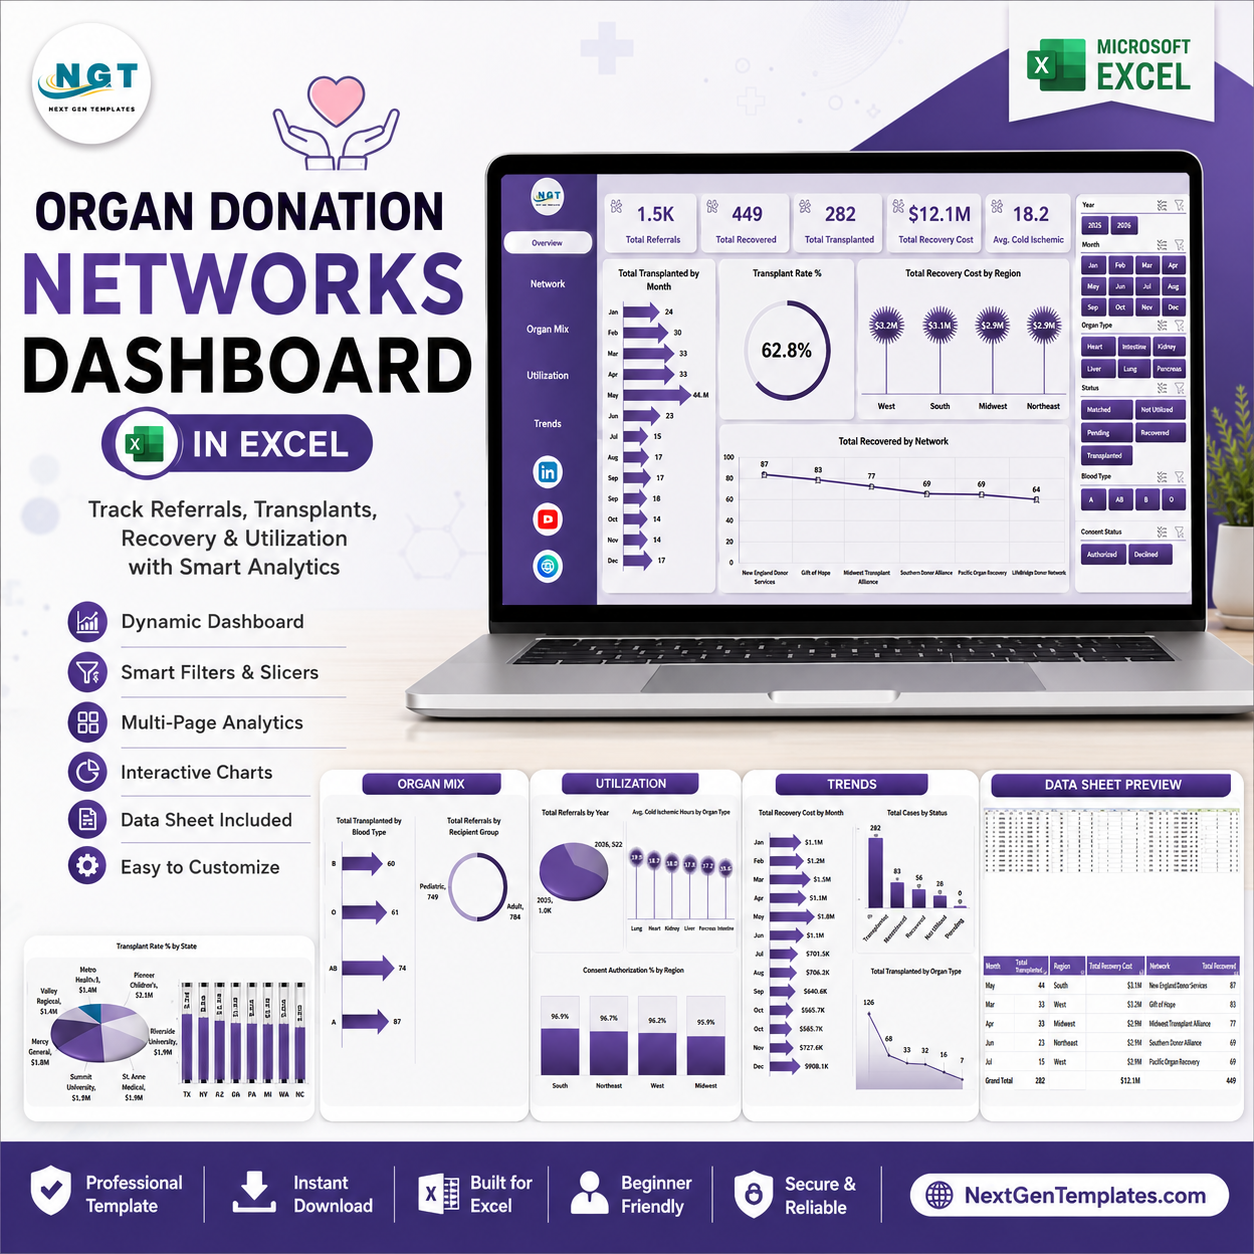



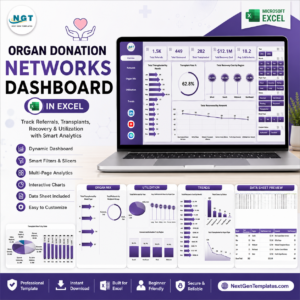
Organ Donation Networks Dashboard in Excel helps organ procurement, transplant coordination, and healthcare analytics teams review referrals, recovered organs, transplanted organs, recovery cost, cold ischemic time, consent authorization, non-utilization, region, network, hospital, organ type, and monthly trends in one editable workbook. OrganDonor.gov reports more than 103,000 people on the U.S. transplant waiting list, and HRSA reported more than 48,000 organ transplants in 2024. This Excel dashboard gives analysts a faster way to review operational performance without rebuilding PivotTables and charts from scratch. Instant download, one-time payment, no subscription, and lifetime access.
Key Features of Organ Donation Networks Dashboard in Excel
- 5 dashboard pages: Overview, Network, Organ Mix, Utilization, and Trends.
- 5 high-level KPI cards: Total Referrals, Total Recovered, Total Transplanted, Total Recovery Cost, and Avg. Cold Ischemic.
- 20 analysis charts: Review transplant activity, recovery cost, network performance, organ mix, utilization, consent authorization, and monthly movement.
- Interactive slicers: Filter dashboard pages quickly during review meetings.
- Editable Data sheet: Replace sample records with your own organ donation network data.
- Pivot-powered Support sheet: Refresh All updates PivotTables, charts, and dashboard pages.
What’s Inside the Organ Donation Networks Dashboard in Excel
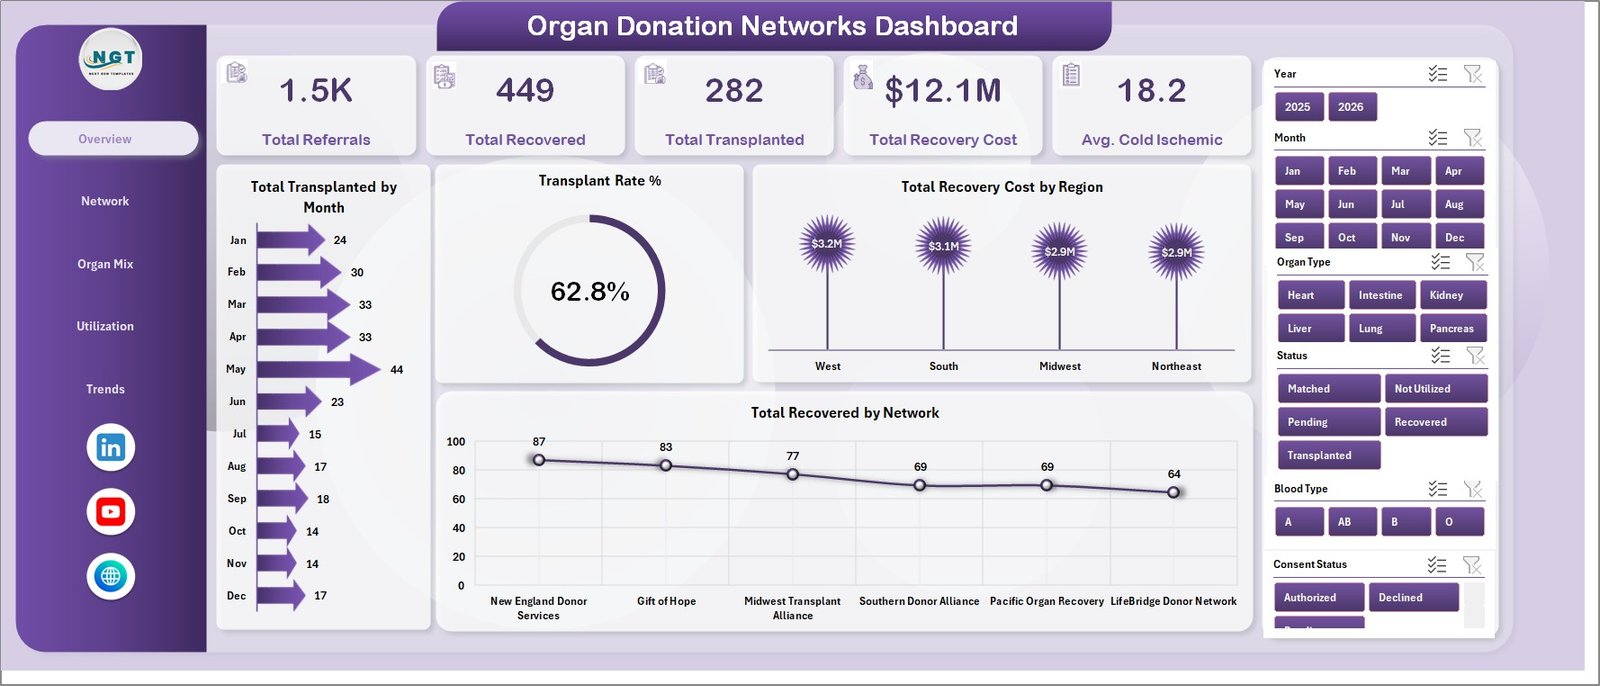
1 – Overview Page
The Overview page gives leadership a fast summary of the organ donation network. KPI cards show Total Referrals, Total Recovered, Total Transplanted, Total Recovery Cost, and Avg. Cold Ischemic.
Total Transplanted by Month: Shows transplant volume by month and helps identify peaks, dips, and seasonal movement.
Transplant Rate % by Overall Cases: Compares transplanted outcomes against overall cases for referral-to-transplant monitoring.
Total Recovery Cost by Region: Highlights cost differences across regions for finance and operations review.
Total Recovered by Network: Compares recovered organs by network and shows where recovery performance is strongest.
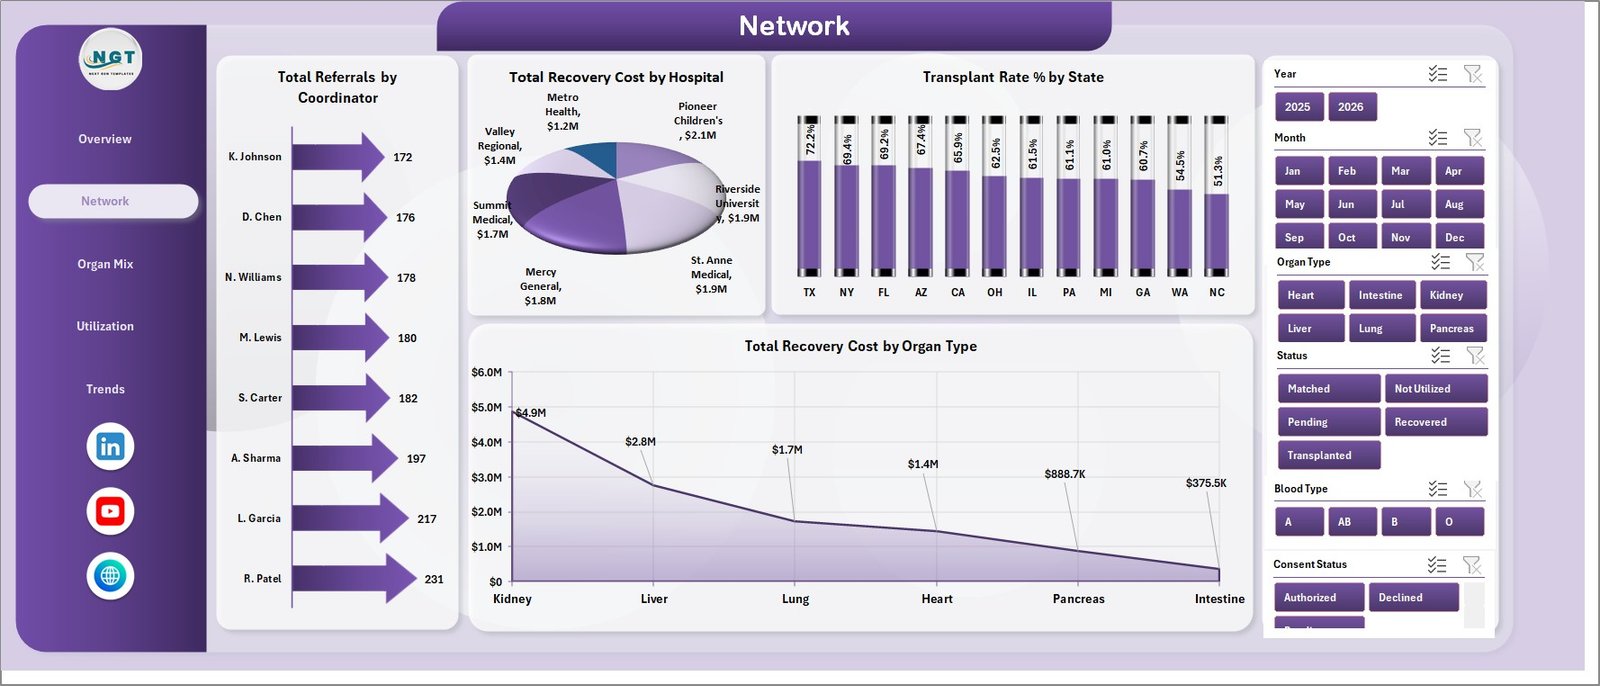
2 – Network
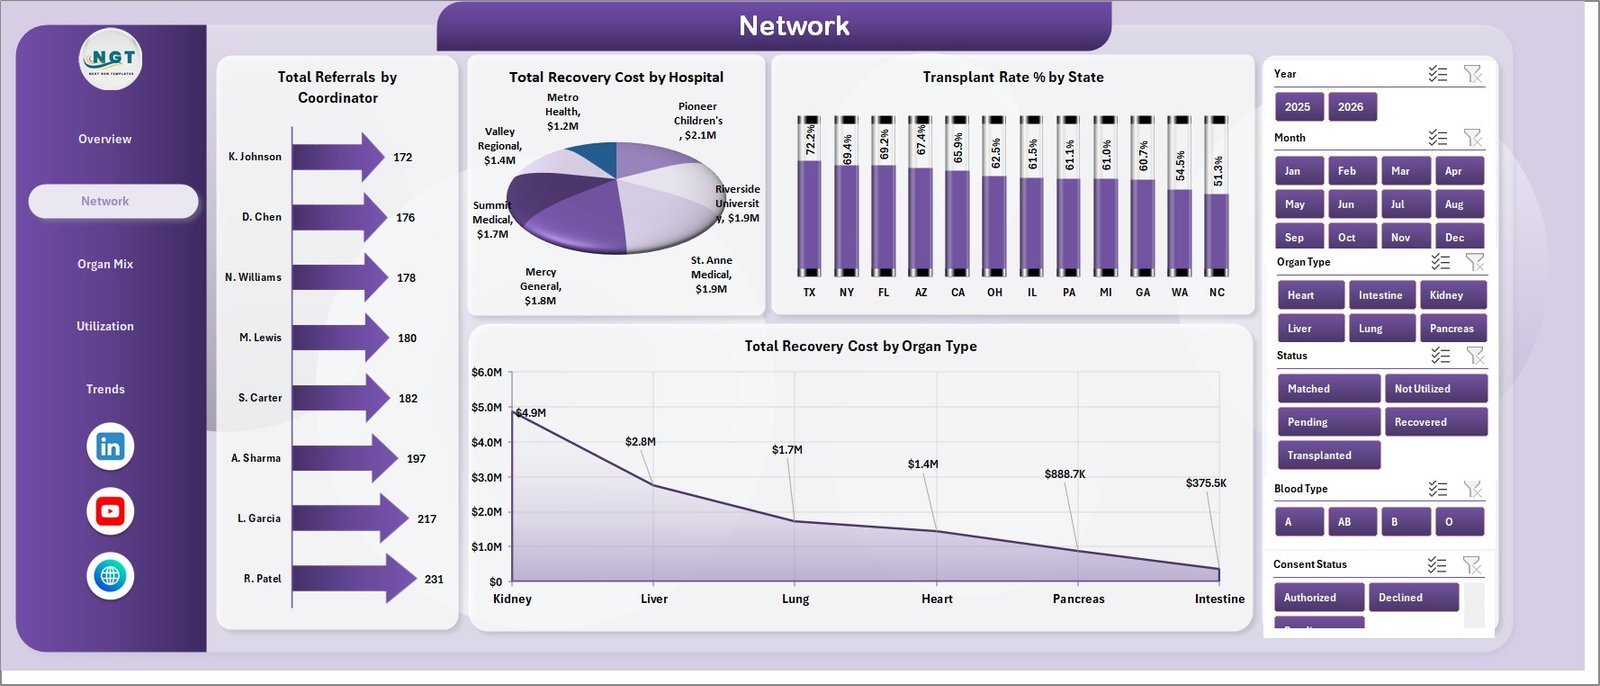
The Network sheet covers coordinator, hospital, state, and organ type analysis.
Total Referrals by Coordinator: Shows referral volume by coordinator and helps review workload balance.
Total Recovery Cost by Hospital: Compares recovery cost by hospital and highlights cost concentration.
Transplant Rate % by State: Reviews transplant rate by state for regional comparison.
Total Recovery Cost by Organ Type: Breaks recovery cost down by organ category.
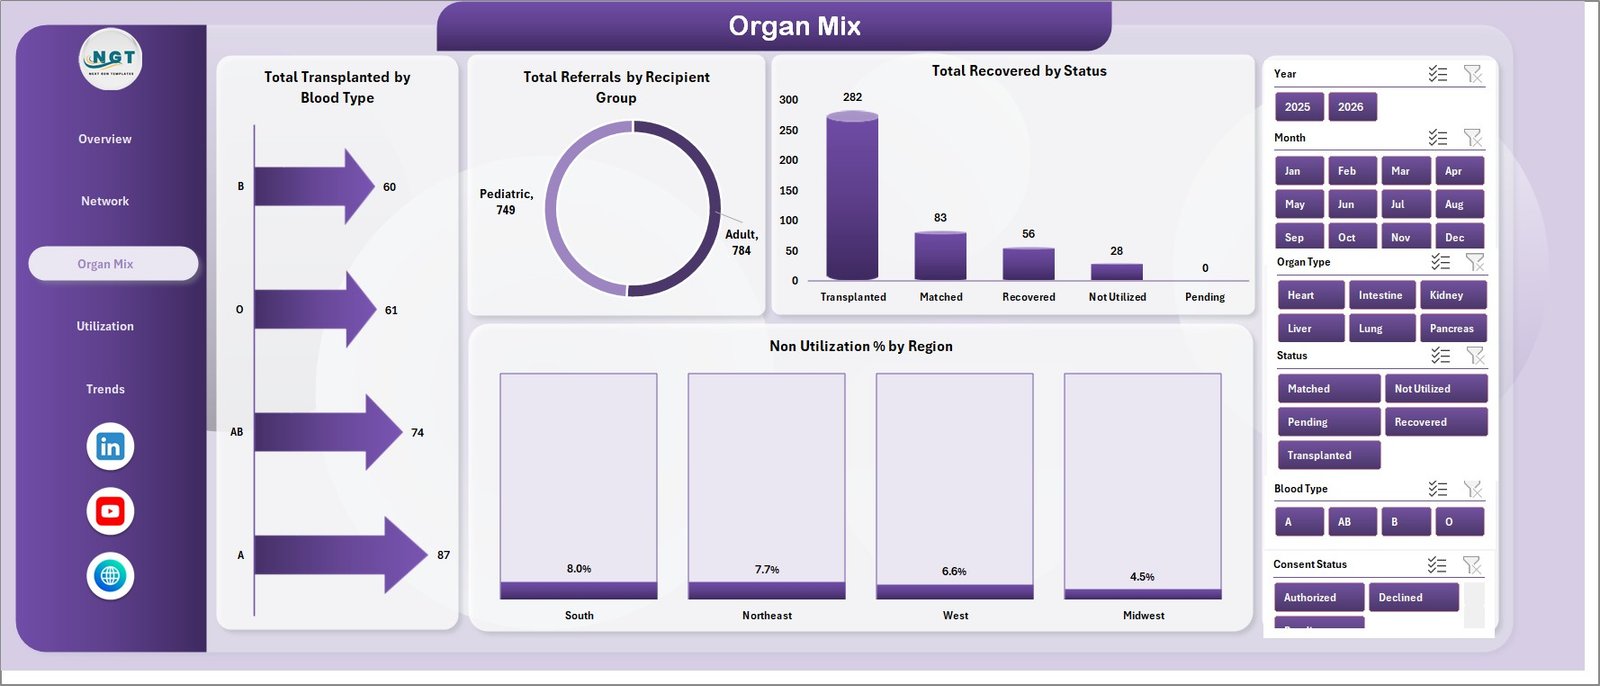
3 – Organ Mix
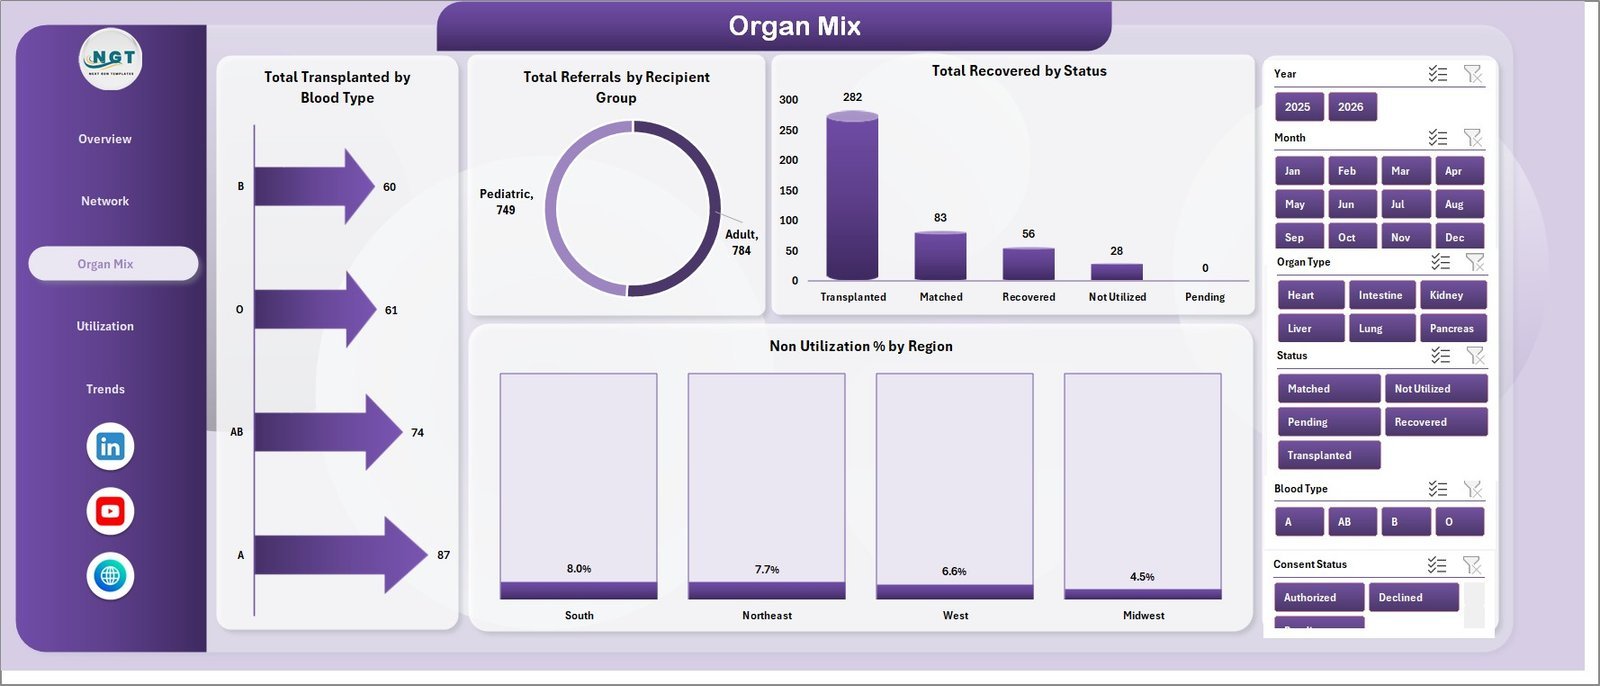
The Organ Mix sheet helps users understand transplant and recovery patterns by blood type, recipient group, status, and region.
Total Transplanted by Blood Type: Compares transplanted volume by blood type.
Total Referrals by Recipient Group: Shows referral volume by recipient group for population-level planning.
Total Recovered by Status: Breaks recovered counts by status and shows the recovery pipeline mix.
Non Utilization % by Region: Highlights non-utilization percentage by region for deeper operational review.
4 – Utilization
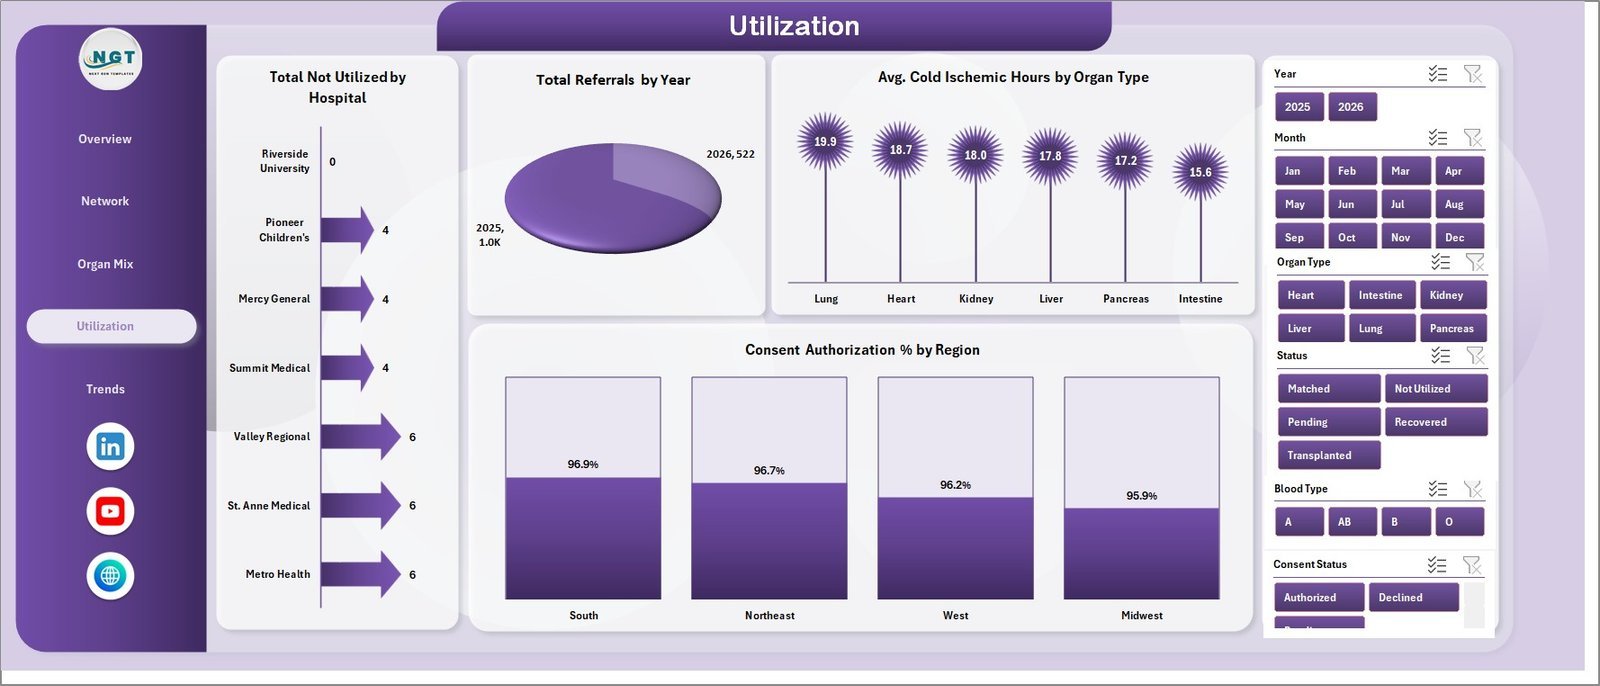
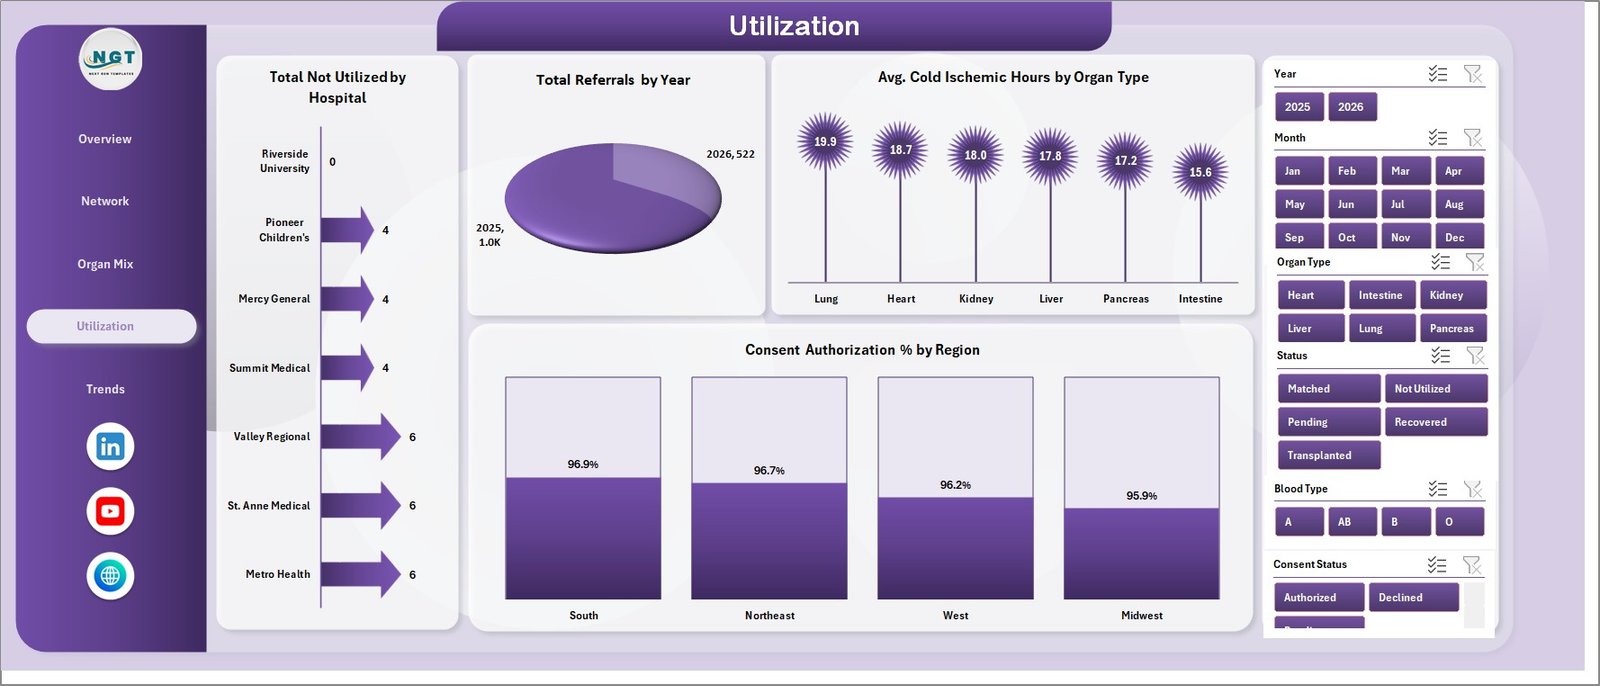
The Utilization sheet focuses on non-utilized volume, referral trend by year, cold ischemic time, and authorization performance.
Total Not Utilized by Hospital: Compares non-utilized volume by hospital and points teams toward process review.
Total Referrals by Year: Shows long-term referral movement.
Avg. Cold Ischemic Hours by Organ Type: Tracks preservation and logistics time by organ category.
Consent Authorization % by Region: Compares authorization percentage across regions.
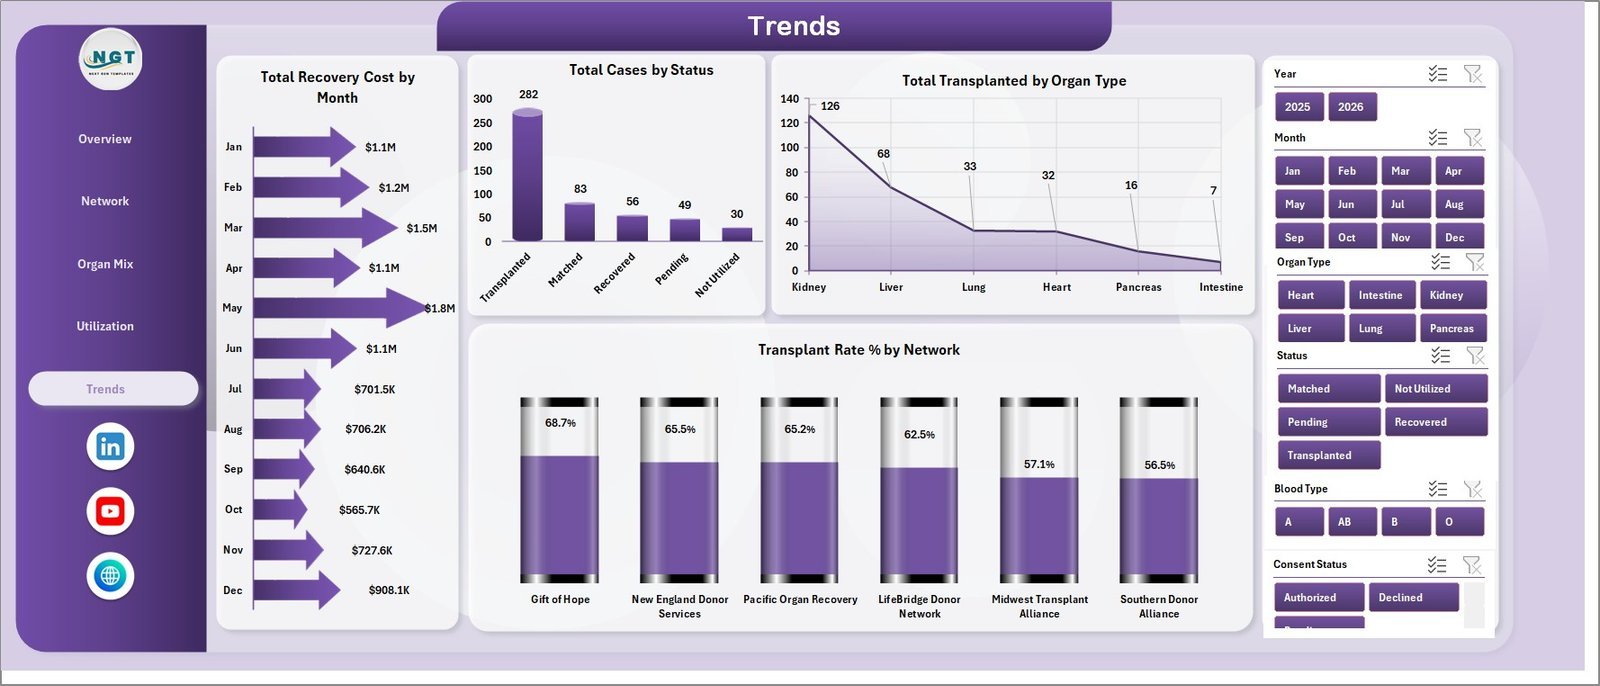
5 – Trends
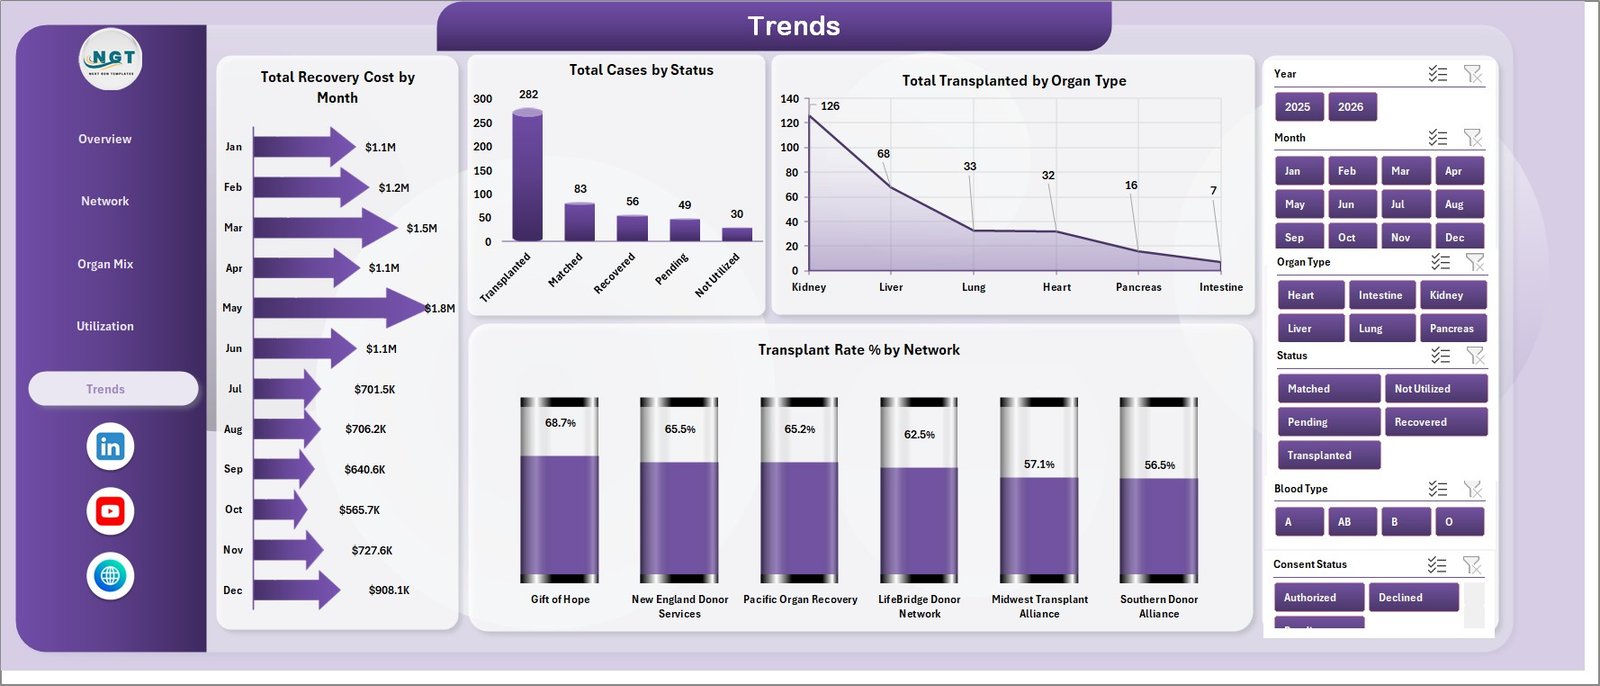
The Trends sheet supports time-based review of recovery cost, case status, organ type, and network-level transplant rate.
Total Recovery Cost by Month: Tracks monthly cost movement and helps identify budget spikes.
Total Cases by Status: Shows case volume by status across the donation workflow.
Total Transplanted by Organ Type: Compares transplanted counts by organ type.
Transplant Rate % by Network: Compares transplant conversion across networks.
6 – Data Sheet Tab
The Data sheet is where you add or replace records in the same format. Keep the column structure unchanged, paste your updated data, and refresh the workbook.

7 – Support Sheet
The Support sheet contains the PivotTables used to create the dynamic dashboard. After updating the Data sheet, go to the Data tab in the Excel Ribbon and click Refresh All. You can keep this sheet hidden while using the workbook.

Organ Donation Networks Dashboard in Excel vs. Google Sheets vs. Paid Healthcare SaaS – Where This Fits
| Feature | This Excel dashboard | Google Sheets alternative | Paid healthcare SaaS |
|---|---|---|---|
| Cost | $17.99 sale price, one-time | Low cost, but usually built manually | Monthly or annual subscription |
| Platform | Microsoft Excel | Browser-based spreadsheet | Vendor cloud platform |
| Setup time | Replace data and refresh | Build charts, pivots, and slicers yourself | Implementation and onboarding |
| Real-time collaboration | Possible through OneDrive or SharePoint | Strong browser collaboration | Plan-dependent |
| Customizable fields | Fully editable workbook | Fully editable sheet | Limited by vendor configuration |
| Donation network analytics | Pre-built for referrals, recovery, transplant, cost, utilization, and cold ischemic time | Must be designed manually | Depends on report access and license tier |
Who This Template Is For – and Who It’s Not For
This template is for organ procurement organizations, transplant coordination teams, healthcare analysts, hospital operations teams, nonprofit healthcare networks, and consultants who need an Excel reporting layer for donation and transplant workflow metrics.
It is not an EHR, clinical decision system, donor registry, patient matching platform, compliance product, or live OPTN connection. Use it for analytics and reporting after your data has been exported or prepared in spreadsheet format.
How to Use the Organ Donation Networks Dashboard in Excel
- Download and unzip the file.
- Open the workbook in Microsoft Excel.
- Replace the sample rows on the Data sheet.
- Keep the same column headers and data format.
- Click Data, then Refresh All.
- Use slicers to filter the dashboard pages.
Real-World Use Cases
Transplant operations manager: Reviews monthly transplanted totals, cold ischemic hours, and network-level transplant rate before an operations meeting.
OPO finance analyst: Uses recovery cost by region, hospital, organ type, and month to prepare a cost variance review.
Healthcare consultant: Creates a client-ready dashboard from exported donation workflow data without rebuilding charts from zero.
Frequently Asked Questions
What does this dashboard track?
It tracks referrals, recovered organs, transplanted organs, recovery cost, average cold ischemic hours, transplant rate, consent authorization, non-utilization, hospitals, states, regions, networks, organ types, blood types, recipient groups, status, month, and year.
Can I use my own data?
Yes. Replace the sample records on the Data sheet while keeping the same structure, then refresh the workbook.
Does it require macros?
No macros are required for the standard workflow. The dashboard uses Excel tables, PivotTables, charts, and slicers.
Is this a clinical system?
No. It is an analytics workbook, not a clinical decision tool, donor registry, EHR, matching engine, or compliance system.
Can I customize the dashboard?
Yes. You can edit the charts, slicers, colors, formulas, PivotTables, and source data fields in Microsoft Excel.
About the Author
Built by PK – Microsoft Certified Professional with 15+ years of Excel, Google Sheets, and Power BI experience. Founder of NextGenTemplates, reaching 300K+ subscribers across YouTube channels. Every template is hand-built and tested before release.
Explore Related Templates
You may also like Online Therapy Apps Dashboard in Excel, Dialysis Centers Dashboard in Excel, and Nonprofit Organizations Dashboard in Google Sheets. Browse more Excel Dashboard templates and Health and Safety Excel templates.
Download the Organ Donation Networks Dashboard in Excel to review referrals, recovery, transplant outcomes, cost, utilization, and network performance in one editable workbook.
Last updated: July 18, 2026
Watch the step-by-step video tutorial:
Compatibility and Requirements
- Works in Microsoft Excel desktop (Excel 2016 or later, or Microsoft 365).
- The dashboard filters with slicers. Microsoft explains them in Use slicers to filter data.
More Questions About This Template
Is there a Power BI version?
Yes. See the Organ Donation Networks Dashboard in Power BI.
How do I update the charts after adding my data?
Paste your records on the Data sheet in the same column format, then click Refresh All on the Data tab. The PivotTables on the Support sheet, the charts and the dashboard pages update.
How many dashboard pages and charts are there?
There are 5 dashboard pages (Overview, Network, Organ Mix, Utilization and Trends) with 5 KPI cards and 20 charts.
Can I filter the dashboard by region or organ type?
Yes. The interactive slicers filter the dashboard pages, and the data includes region, hospital, state, network, organ type, blood type and recipient group.
Related Healthcare and Nonprofit Templates
- Organ Donation Networks Dashboard in Power BI: the same topic in Power BI
- Nonprofit Organizations Dashboard in Excel: an Excel dashboard for nonprofit teams
- Nonprofit Organizations KPI Dashboard in Excel: a KPI view for nonprofits
- Donation Request Tracker in Excel: a tracker for donation requests
- Healthcare & Hospital Management Bundle: 8 healthcare templates in one download
Browse all Excel dashboards or template bundles.






















Reviews
There are no reviews yet.