
Managing operations efficiently requires clear visibility into performance metrics such as costs, delays, service level agreements (SLA), and operational trends. However, many organizations still rely on scattered spreadsheets and manual reports that make analysis difficult and time-consuming.
The Operations Dashboard in Google Sheets solves this challenge by providing a ready-to-use, interactive dashboard template that transforms raw operational data into clear visual insights. This professionally designed dashboard helps operations managers, analysts, and business leaders monitor performance, analyze trends, and identify operational issues quickly.
Because the dashboard is built in Google Sheets, it offers powerful collaboration capabilities. Multiple team members can access the dashboard simultaneously, review performance metrics, and make data-driven decisions in real time.
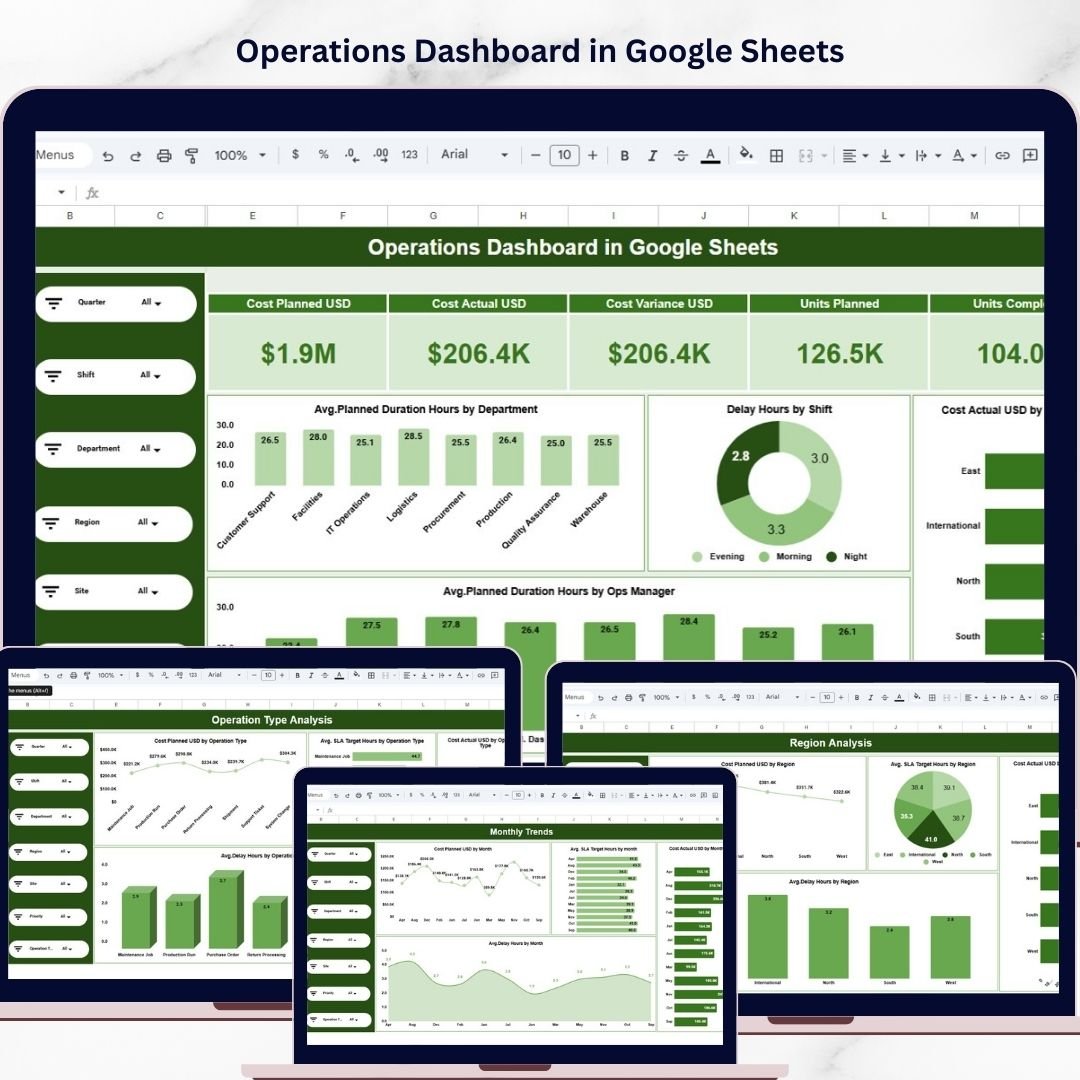
The template includes multiple analytical pages, interactive slicers, KPI cards, and several chart types that allow you to analyze operations from different perspectives such as department, region, operation type, and monthly trends.
Simply update the Data sheet, refresh the file, and the dashboard automatically updates all visuals and metrics. As a result, you can focus on analysis instead of spending hours creating reports.
🚀 Key Feature of Operations Dashboard in Google Sheets
📊 Ready-to-Use Dashboard Template
Start analyzing operations immediately without building dashboards from scratch.
📈 Interactive Data Filtering
Use slicers to filter the dashboard by Department, Region, Shift, Manager, or Operation Type.
📊 Multiple Visualization Types
Includes column charts, bar charts, line charts, donut charts, and pie charts for powerful insights.
📌 High-Level KPI Cards
Quickly monitor important metrics such as average planned duration, delays, and operational costs.
📅 Monthly Trend Analysis
Track operational performance over time to identify patterns and seasonal trends.
📂 Multi-Page Analytical Dashboard
Dedicated pages for Overview, Department Analysis, Region Analysis, Operation Type Analysis, and Monthly Trends.
🔎 Search Functionality
Quickly locate records or operational tickets using the Search sheet.
⚡ Automatic Dashboard Updates
Update the Data sheet and the dashboard visuals refresh automatically.
🌐 Google Sheets Collaboration
Share the dashboard with your team and collaborate in real time.
📦 What’s Inside the Operations Dashboard in Google Sheets
This digital template includes seven structured worksheet tabs designed to provide comprehensive operational analysis.
1️⃣ Overview Dashboard
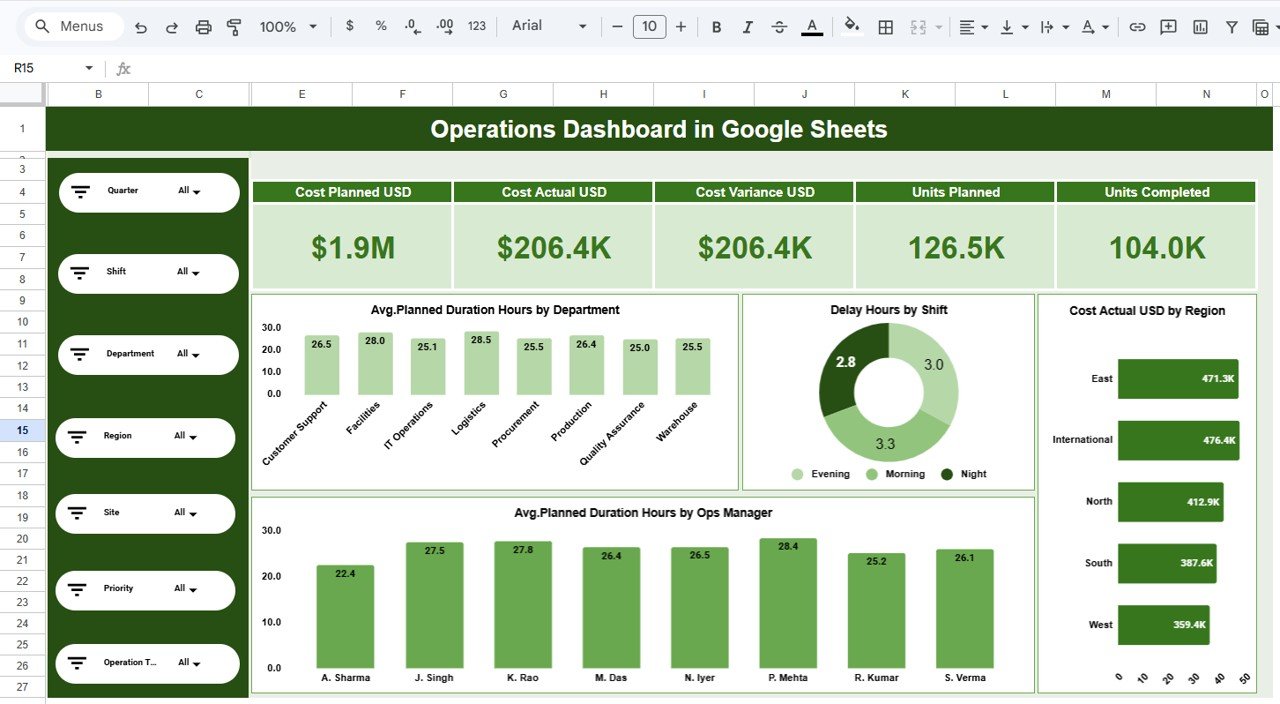
The Overview page provides a high-level snapshot of operational performance.
It includes KPI cards and charts that help you quickly understand the overall health of operations.
Charts available on this page include:
Avg. Planned Duration Hours by Department — Column Chart
Delay Hours by Shift — Donut Chart
Cost Actual USD by Region — Bar Chart
Avg. Planned Duration Hours by Operations Manager — Column Chart
These visuals allow managers to identify delays, cost drivers, and operational efficiency instantly.
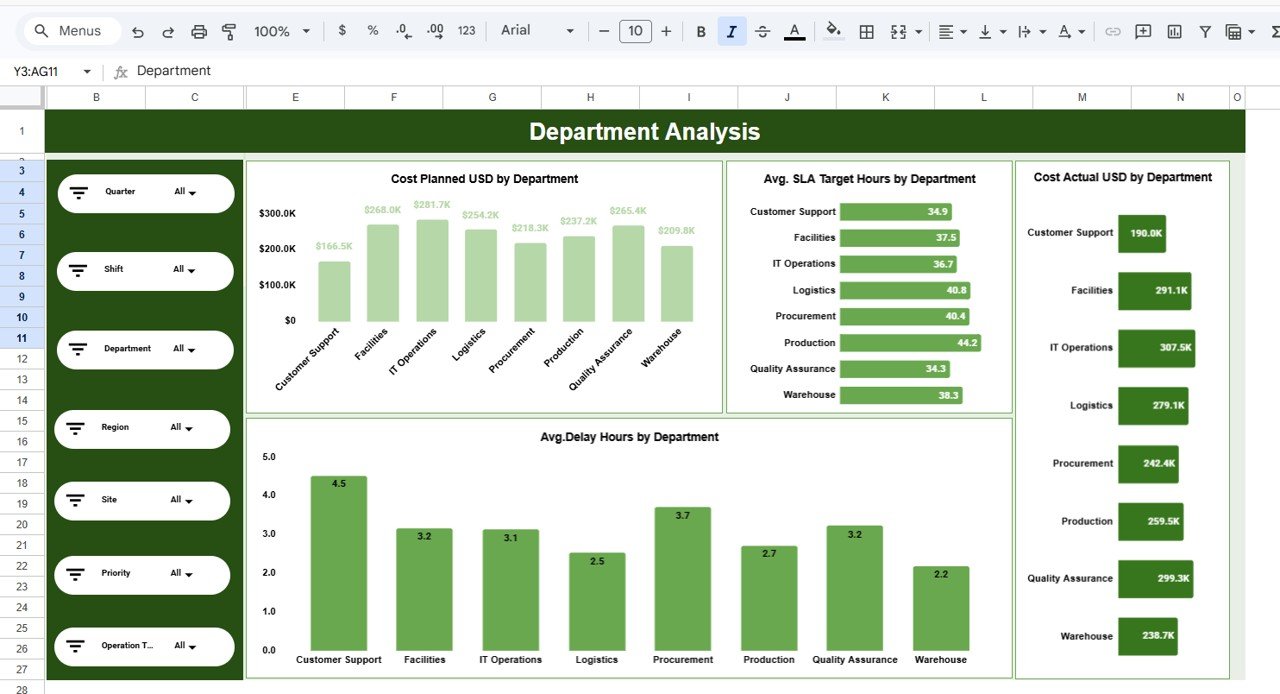
2️⃣ Department Analysis
The Department Analysis page focuses on comparing department-level operational metrics.
It helps managers determine which departments are experiencing higher costs or delays.
Charts included:
Cost Planned USD by Department
Avg. SLA Target Hours by Department
Avg. Delay Hours by Department
Cost Actual USD by Department
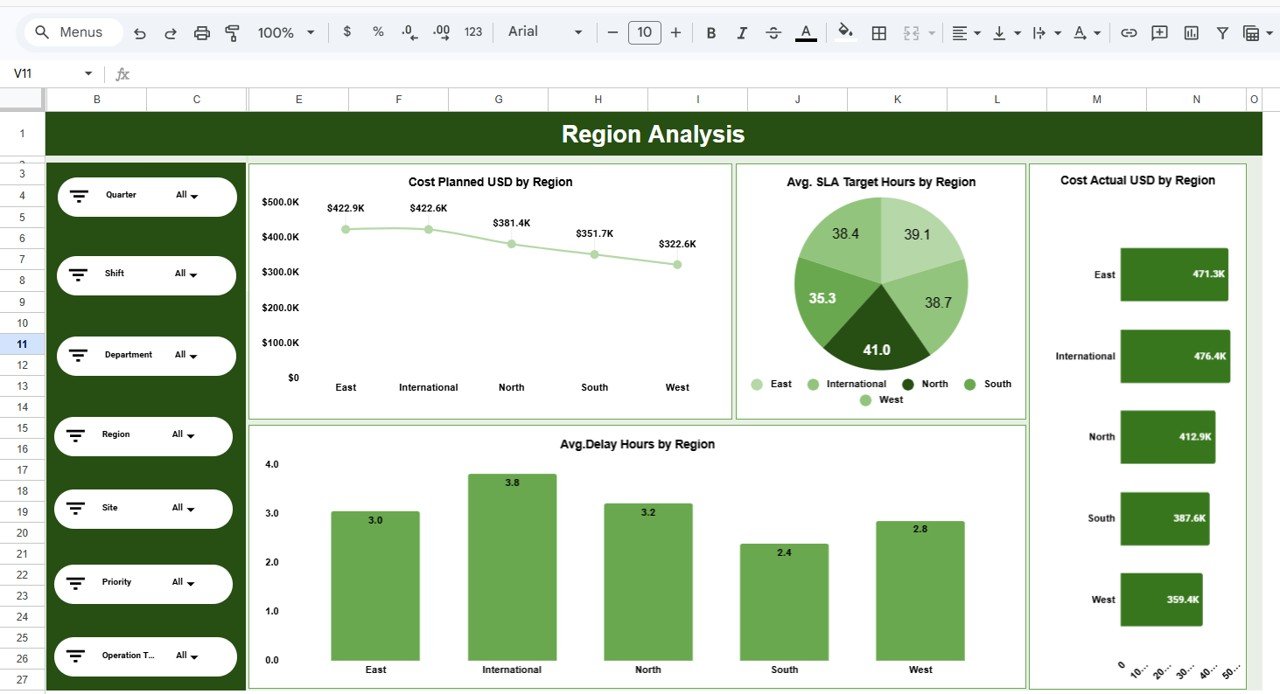
3️⃣ Region Analysis
The Region Analysis tab compares performance across different geographical regions.
Charts included:
Cost Planned USD by Region — Line Chart
Avg. SLA Target Hours by Region — Pie Chart
Avg. Delay Hours by Region — Column Chart
Cost Actual USD by Region — Bar Chart
This page helps organizations identify regional performance differences.
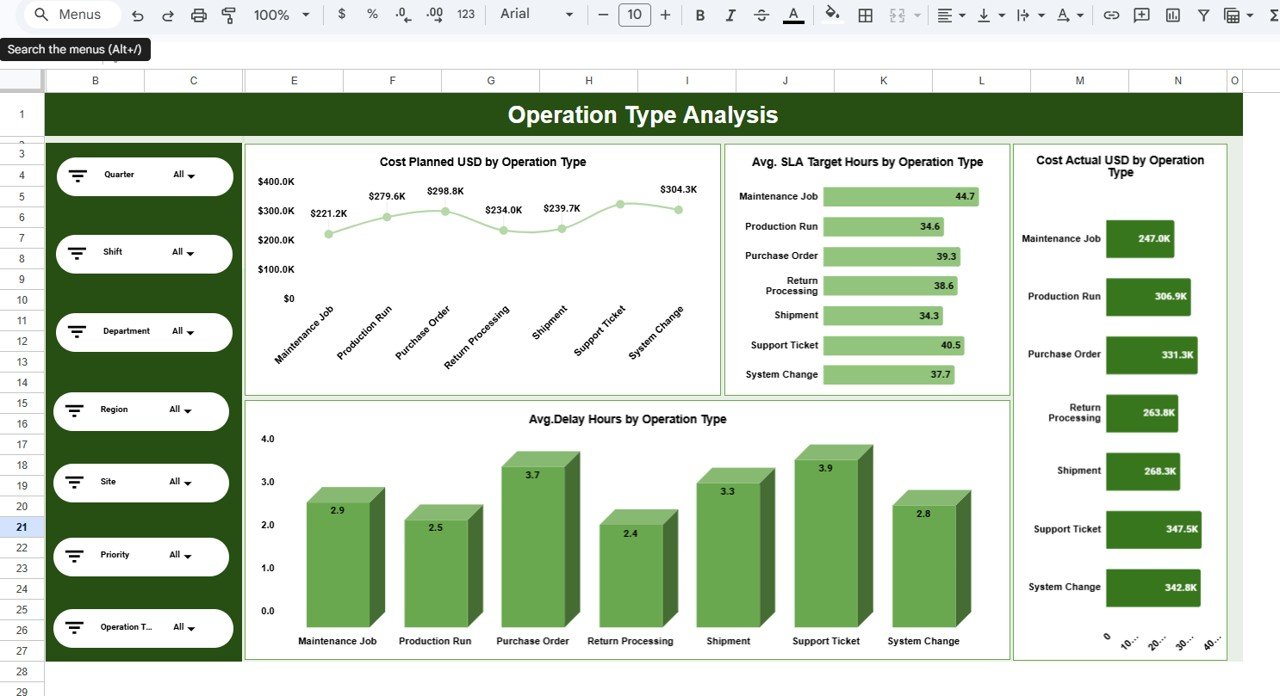
4️⃣ Operation Type Analysis
This page analyzes operational efficiency based on different operation types.
Charts included:
Cost Planned USD by Operation Type
Avg. SLA Target Hours by Operation Type
Avg. Delay Hours by Operation Type
Cost Actual USD by Operation Type
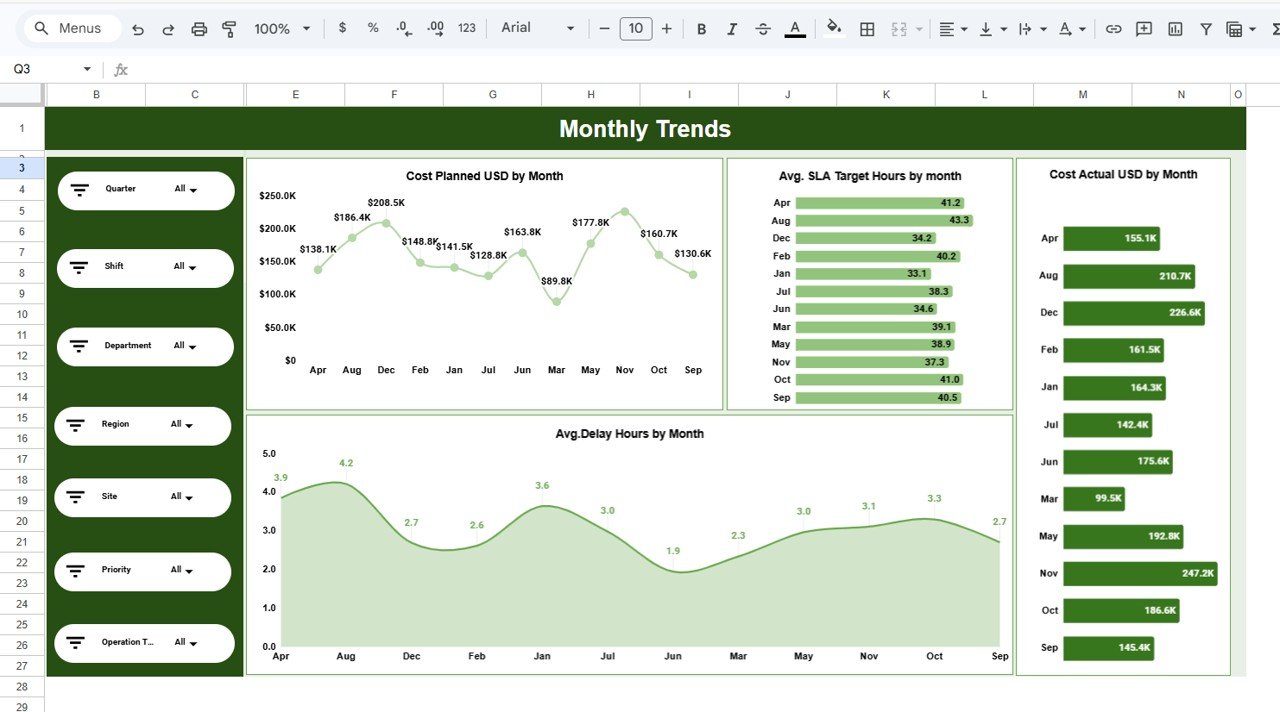
5️⃣ Monthly Trends
The Monthly Trends page shows performance patterns across months.
Charts include:
Cost Planned USD by Month
Avg. SLA Target Hours by Month
Avg. Delay Hours by Month
Cost Actual USD by Month
This page helps identify seasonal patterns and long-term trends.
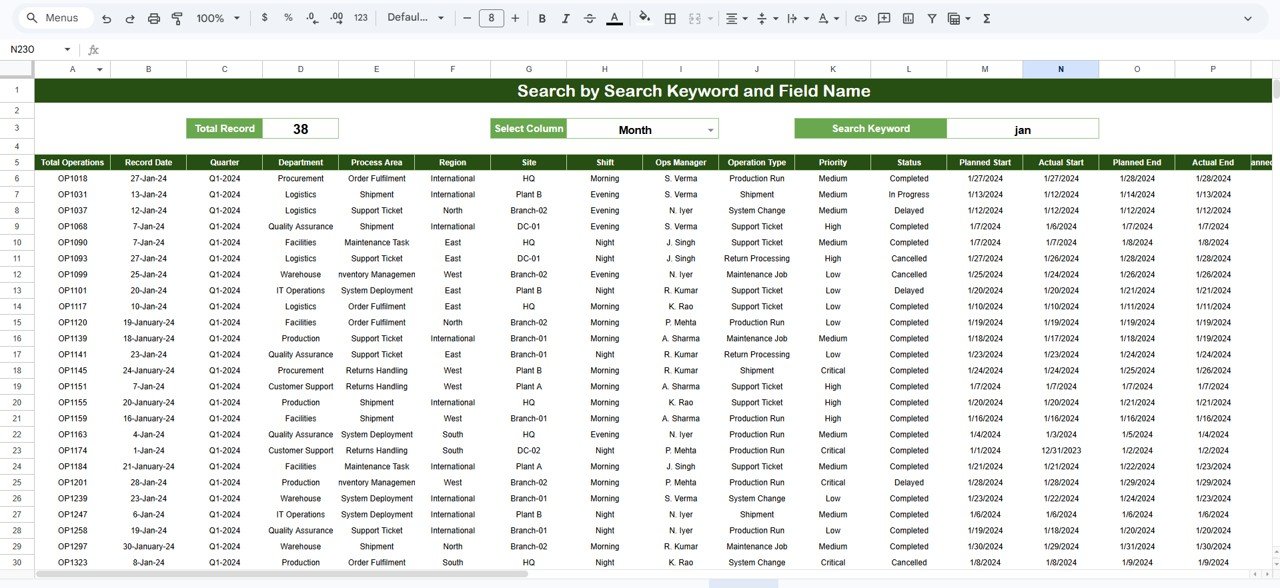
6️⃣ Search Sheet
The Search sheet allows users to search specific operational records by selecting a column and entering a keyword.
This feature is extremely useful for investigating operational tickets, projects, or tasks.
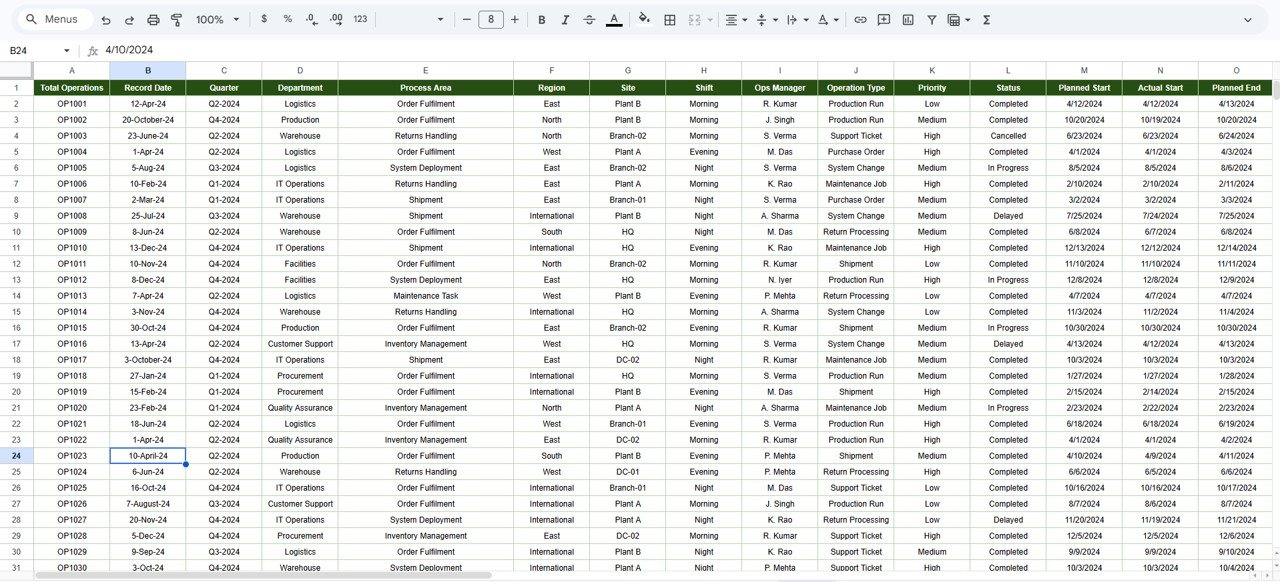
7️⃣ Data Sheet
The Data sheet acts as the primary data source for the dashboard.
Users simply paste or update operational data in this sheet while maintaining the same column format. Once the data is updated, charts and slicers automatically reflect the new information.
⚙️ How to Use the Operations Dashboard in Google Sheets
Using this dashboard is simple and requires no advanced technical skills.
1️⃣ Download and open the Google Sheets Operations Dashboard template.
2️⃣ Enter or paste your operational data into the Data sheet.
3️⃣ Ensure the column structure remains consistent.
4️⃣ Refresh or reopen the file.
5️⃣ All charts, slicers, and KPI cards will automatically update.
Within minutes, you will have a fully interactive operational dashboard ready for analysis.
🎯 Who Can Benefit from This Operations Dashboard in Google Sheets
This dashboard is ideal for organizations that want better operational visibility.
👨💼 Operations Managers — Monitor delays, costs, and team performance.
📊 Business Analysts — Analyze operational efficiency and performance trends.
🏢 Operations Teams — Track SLA performance and project timelines.
🌍 Regional Managers — Compare performance across different locations.
📈 Business Leaders — Make data-driven operational decisions quickly.
Because the dashboard simplifies operational analytics, it becomes a powerful performance management tool for organizations of all sizes.
Click here to read the Detailed blog post
Watch the step-by-step video tutorial:
Visit our YouTube channel to learn step-by-step video tutorials
Compatibility and Requirements
- Works in Google Sheets. You need a free Google account and a web browser.
- The dashboard pages use charts and slicers to filter by Department, Region, Shift, Manager or Operation Type. Google explains how charts work in Add and edit a chart.
Frequently Asked Questions
Which sheets are included?
Seven sheets: Overview, Department Analysis, Region Analysis, Operation Type Analysis, Monthly Trends, Search and Data.
How do I update the dashboard with my own data?
Paste or enter your operational data in the Data sheet and keep the same column structure. Refresh or reopen the file and the charts, slicers and KPI cards update.
What can I filter by?
Slicers filter the dashboard by Department, Region, Shift, Manager or Operation Type.
Can I find a specific record?
Yes. On the Search sheet you select a column and enter a keyword to find operational records, tickets or tasks.
Is there a Power BI or Excel version?
Yes. See the Operations KPI Dashboard in Power BI and the Operations KPI Dashboard in Excel.
Related Operations Templates
- Operations KPI Dashboard in Power BI: the Power BI edition for operations metrics
- Operations KPI Dashboard in Excel: the same topic in Excel
- Operations KPI Scorecard in Excel: a scorecard view of operations KPIs
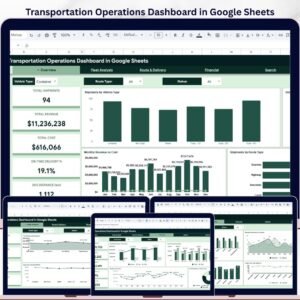
- Transportation Operations Dashboard in Google Sheets: another operations dashboard in Google Sheets
- Google Sheets Business Pack (Pro): 14 business templates in one download
Browse all Google Sheets dashboards.