



Efficient operations are the backbone of any successful organization. Yet, without clear visibility into performance data, even the best processes can struggle. The Operations KPI Scorecard in Excel bridges that gap — offering a powerful, easy-to-use system for monitoring, analyzing, and improving operational performance in real time.
This ready-to-use Excel template turns your raw operational data into a visual and actionable scorecard. Whether you manage manufacturing, logistics, services, or corporate operations, it provides an instant snapshot of performance against targets — empowering you to make informed, data-driven decisions quickly.
⚙️ Key Features of the Operations KPI Scorecard
📊 Four Smart Worksheets – Scorecard, KPI Trend, Input Data, and KPI Definition.
🎯 Dynamic Dropdown Filters – Switch between Month-to-Date (MTD) and Year-to-Date (YTD) views instantly.
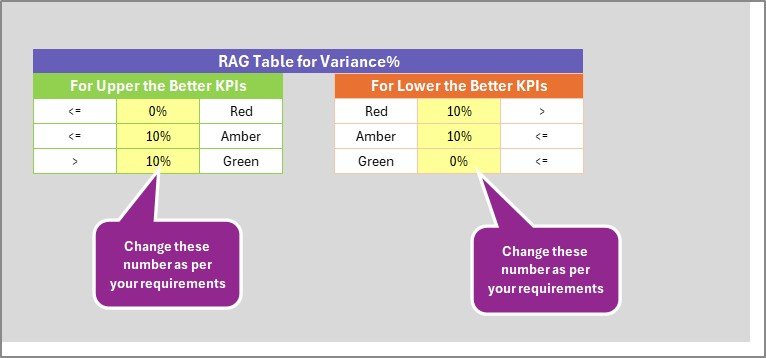
🟢 Color-Coded Performance Indicators – Green for achieved, red for missed, yellow for warning.
📈 Actual vs Target Comparison – Measure how close your operations are to meeting planned goals.
🧩 Interactive Trend Charts – Track performance behavior over months for every KPI.
📘 Centralized Data Entry Hub – Input and manage data efficiently with dropdown lists and validation.
📚 KPI Definition Sheet – Define and standardize formulas, units, and meanings of all KPIs.
💡 Fully Customizable Design – Add new KPIs, groups, or visuals without needing macros or add-ons.
🔒 Data Protection Ready – Protect critical formulas and ranges to prevent accidental edits.
🧮 Inside the Scorecard Template
1️⃣ Scorecard Sheet – Your Performance Dashboard
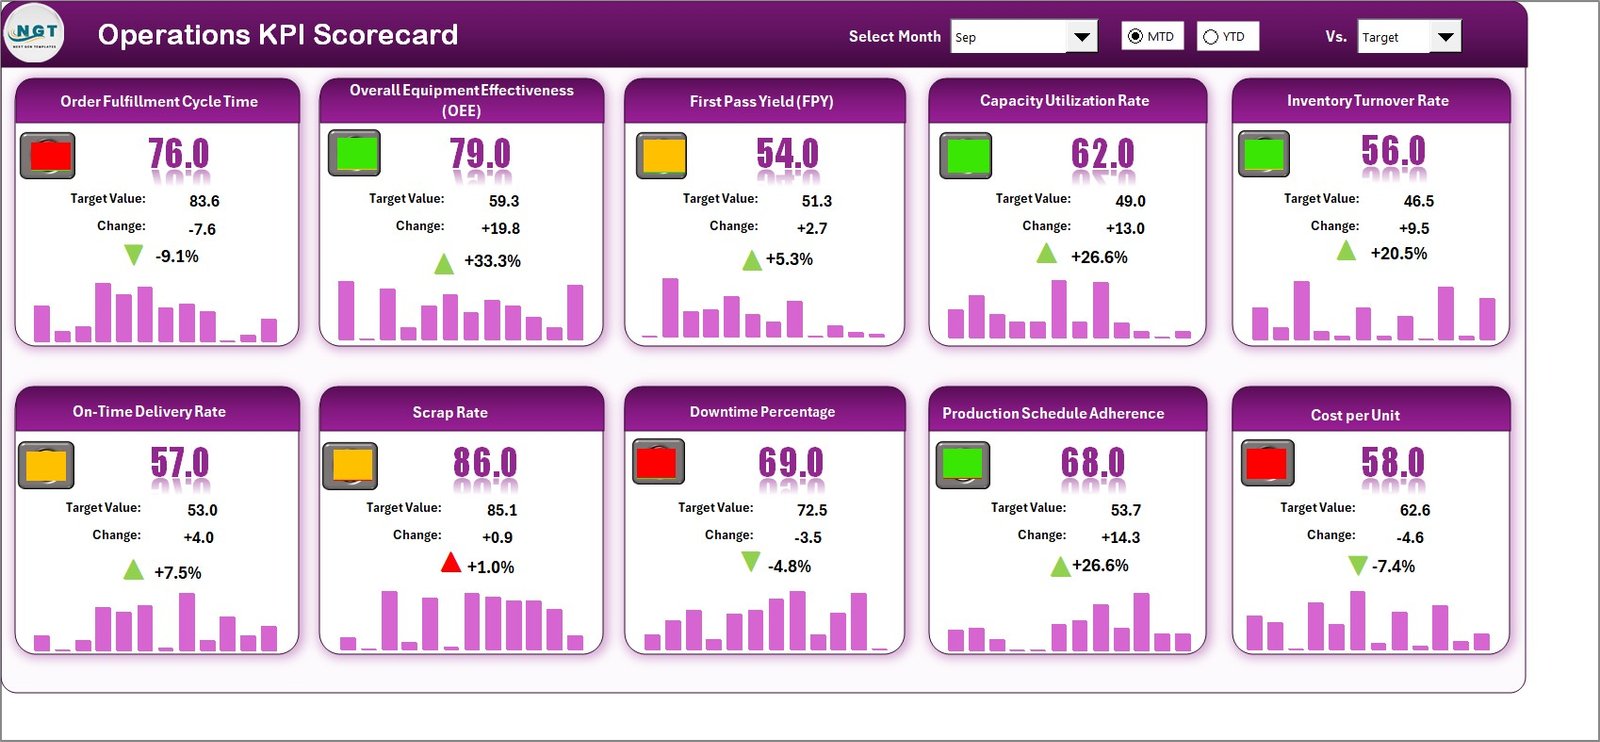
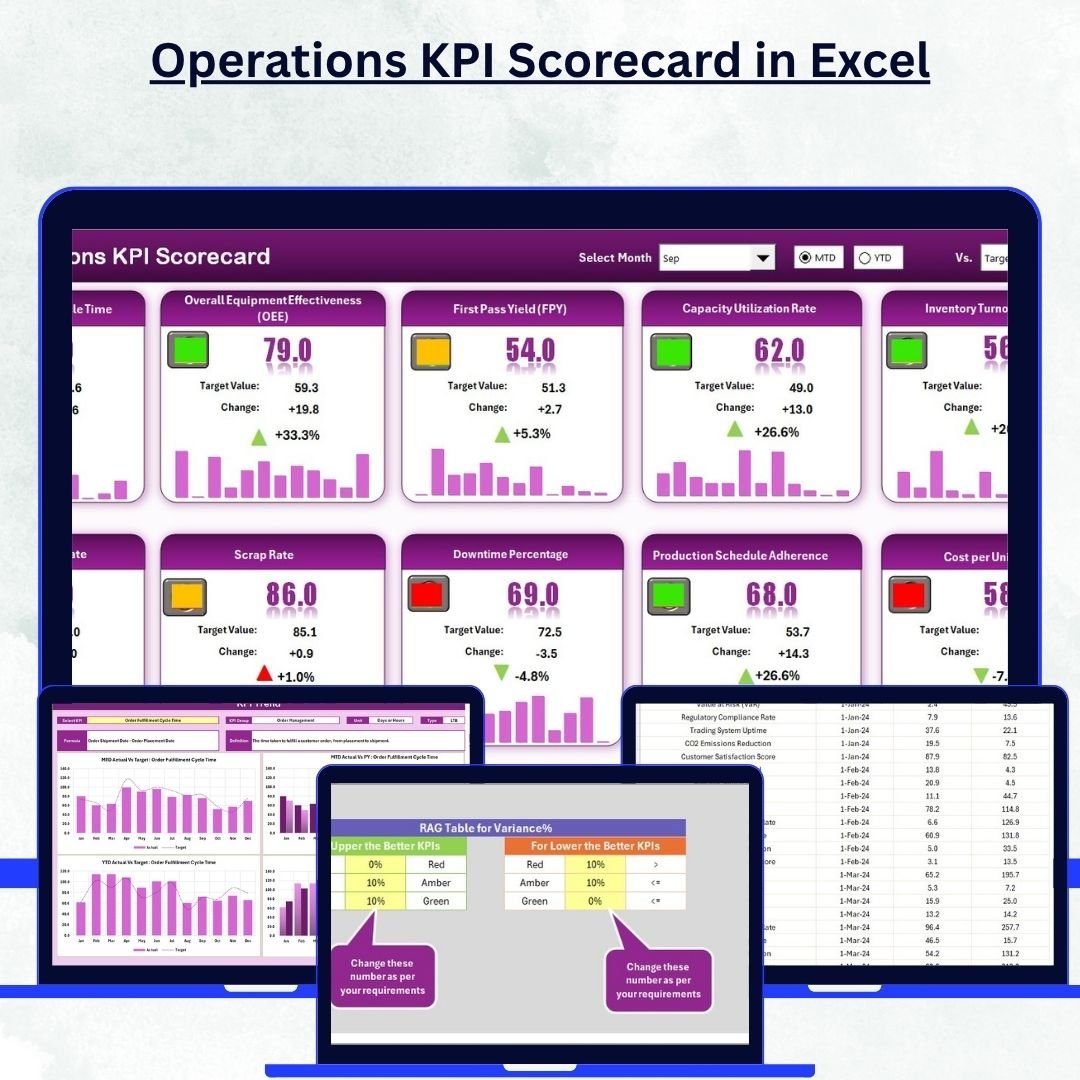
The Scorecard Sheet is the heart of the tool — a clean and interactive dashboard summarizing your operational performance.
Dropdowns let you switch between MTD and YTD views.
Each KPI displays Actual, Target, and Variance % with instant visual feedback.
The sheet includes KPI Name, Group, Unit, and Type (UTB or LTB).
Managers can easily identify which areas meet expectations and which need attention — all within seconds.
2️⃣ KPI Trend Sheet – Visualize Monthly Progress
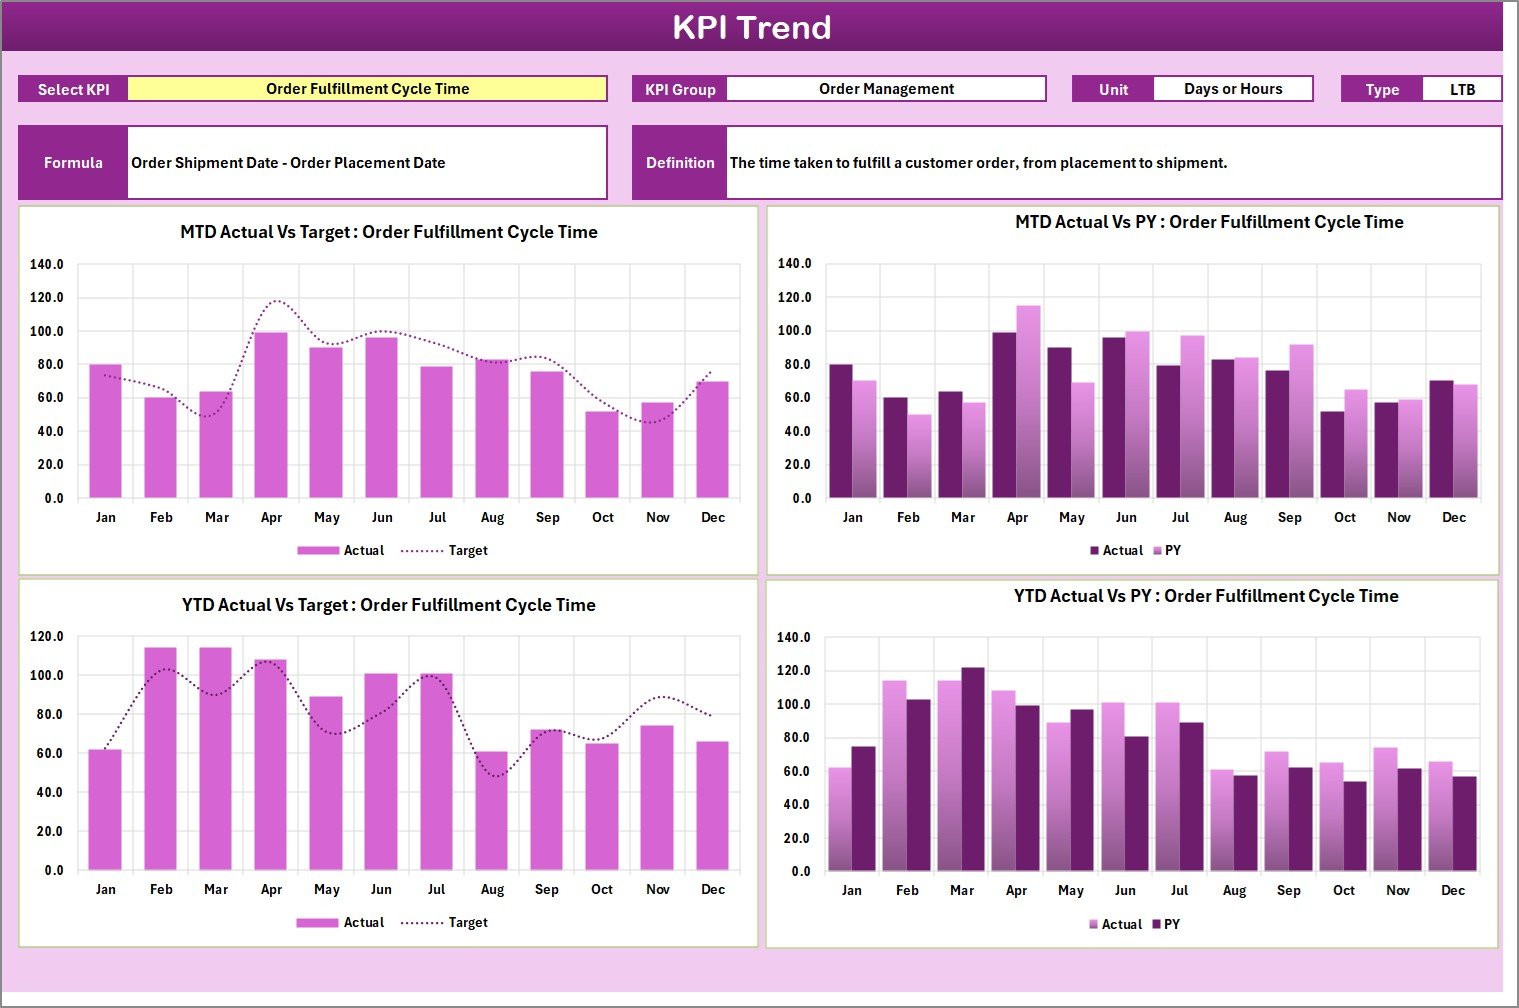
The KPI Trend Sheet provides a deeper dive into performance behavior across months.
Select a KPI (cell C3) to visualize its MTD and YTD trends.
Charts compare Actual, Target, and Previous Year data for complete visibility.
It also displays KPI details like Group, Unit, and Formula.
This view reveals trends, seasonality, and performance shifts — essential for strategic decision-making.
3️⃣ Input Data Sheet – The Data Backbone
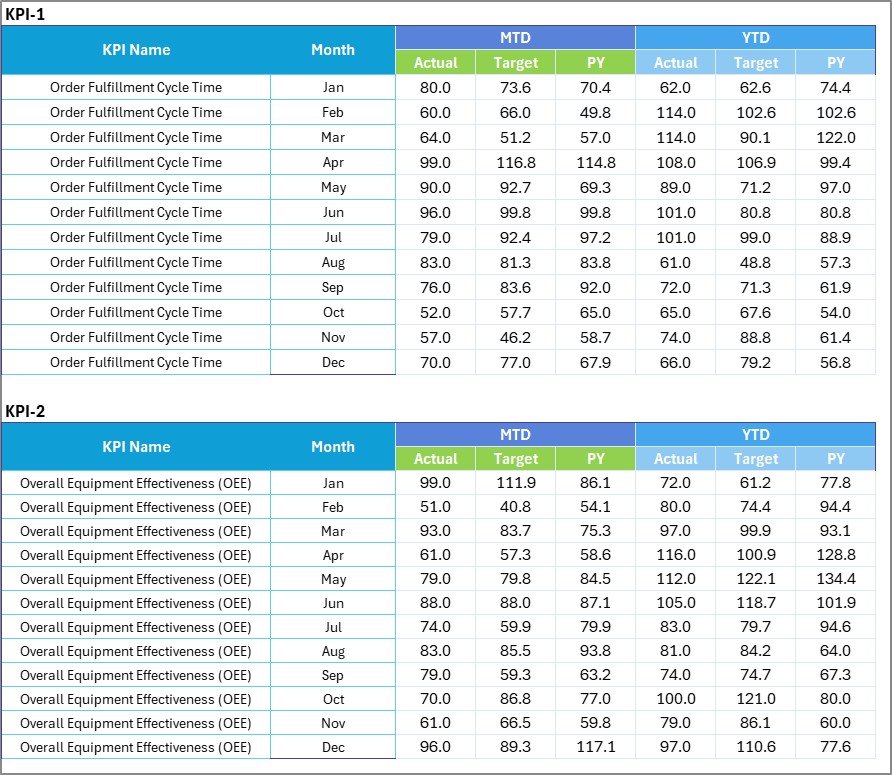
All KPI values (Actuals, Targets, and Previous Year) are stored here.
Streamlined layout for monthly updates.
Dropdown menus and validation ensure consistency.
Updates automatically refresh all visuals.
This sheet keeps your performance reporting reliable and up to date.
4️⃣ KPI Definition Sheet – The Knowledge Base
Every KPI is clearly defined for transparency and consistency.
Columns: KPI Name, Group, Unit, Formula, and Definition.
Prevents confusion and ensures uniform reporting across departments.
📈 KPIs You Can Track
The Operations KPI Scorecard supports a wide variety of metrics:
Production: Output Volume, Machine Downtime %, Capacity Utilization.
Supply Chain: On-Time Delivery %, Order Fulfillment Cycle Time.
Maintenance: Mean Time Between Failures (MTBF), Preventive Maintenance Compliance.
Cost & Efficiency: Cost per Unit, Operational Expense Ratio, Energy Consumption per Output.
Workforce: Productivity Index, Training Hours per Employee, Absenteeism Rate.
Each KPI connects daily performance with measurable outcomes.
🧠 Benefits of Using the Operations KPI Scorecard
✅ Centralized Performance Tracking – View all key metrics on one screen.
✅ Real-Time Monitoring – Detect issues before they escalate.
✅ Visual Decision-Making – Intuitive dashboards replace static spreadsheets.
✅ Cost-Effective – A powerful BI-style tool built entirely in Excel.
✅ Customizable & Scalable – Modify structure and KPIs as your business grows.
✅ Improved Collaboration – Shared visibility across departments enhances accountability.
🧩 Best Practices for Using the Scorecard
Define clear, measurable KPIs aligned with strategic goals.
Update the Input Data Sheet regularly for real-time accuracy.
Use color-coding wisely for clarity and focus.
Protect formulas and use dropdowns for consistency.
Review monthly and share dashboards with stakeholders.
Following these tips ensures your scorecard remains reliable and insightful.
💼 Who Can Use This Template
Operations Managers & Plant Heads
Business Analysts & Data Teams
Manufacturing, Logistics, and Supply Chain Teams
Quality & Maintenance Departments
Service Industry Process Owners
Whether you run a factory floor or a service operation, this scorecard adapts perfectly to your needs.
🏁 Conclusion
The Operations KPI Scorecard in Excel is more than just a spreadsheet — it’s a complete operational control system. It simplifies complex data into digestible insights, helping teams make better, faster, and smarter decisions.
By unifying KPIs, trends, and targets in one visual workspace, it enables organizations to achieve operational excellence through transparency and continuous improvement.
🔗 Click here to read the Detailed blog post
👉 Watch the step-by-step tutorial on our YouTube channel:
youtube.com/@PKAnExcelExpert






























Reviews
There are no reviews yet.