

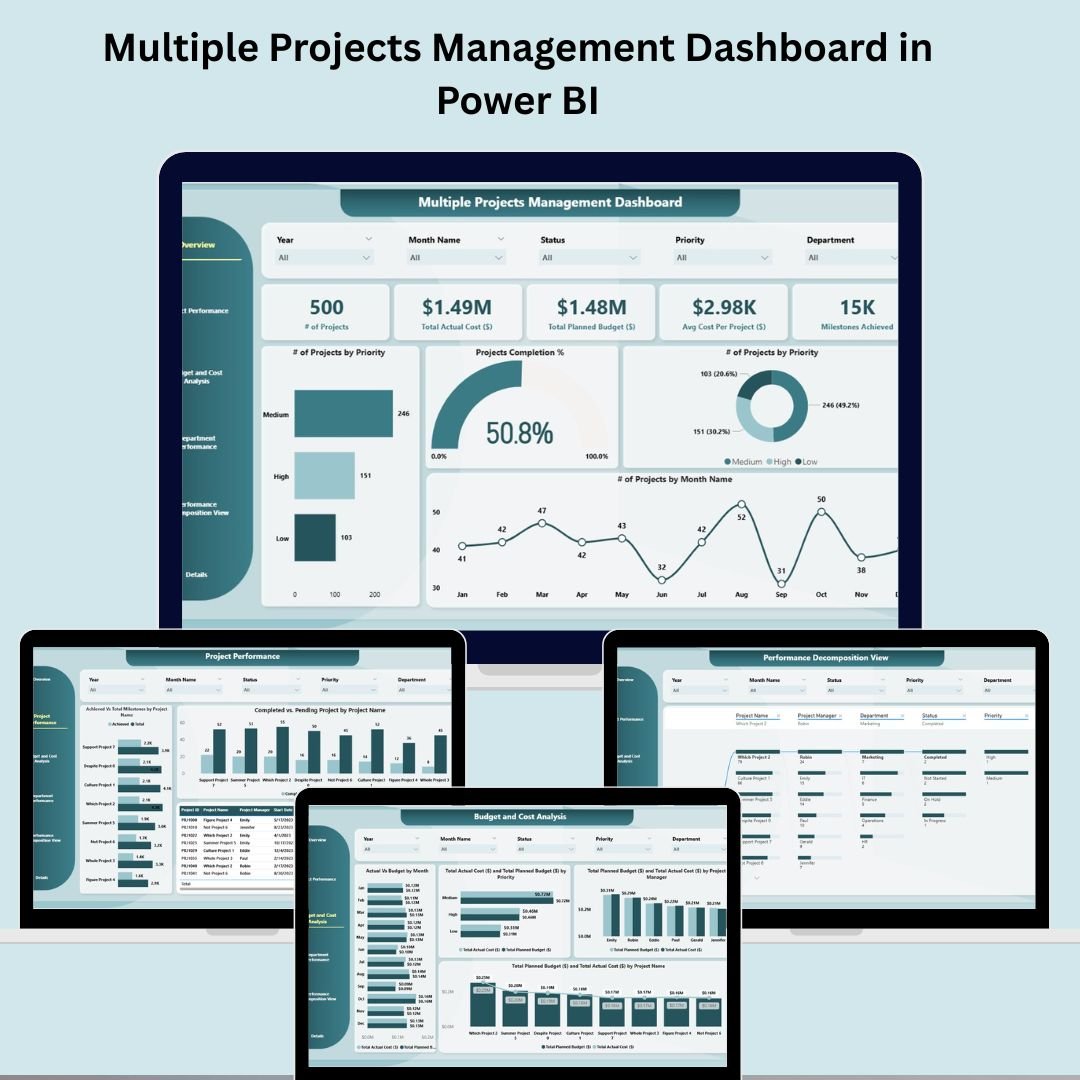
Managing multiple projects doesn’t have to be overwhelming. With our Multiple Projects Management Dashboard in Power BI, you can bring clarity, control, and confidence to your project tracking process. 📊📈
This ready-to-use Power BI dashboard is expertly designed to help project managers and stakeholders monitor multiple projects at once — offering instant visibility into performance, budget, milestones, departmental efficiency, and more. Whether you’re managing 5 or 50 projects, this interactive dashboard centralizes everything you need to know in one dynamic workspace. 💼✅
🛠️ Key Features of the Multiple Projects Management Dashboard
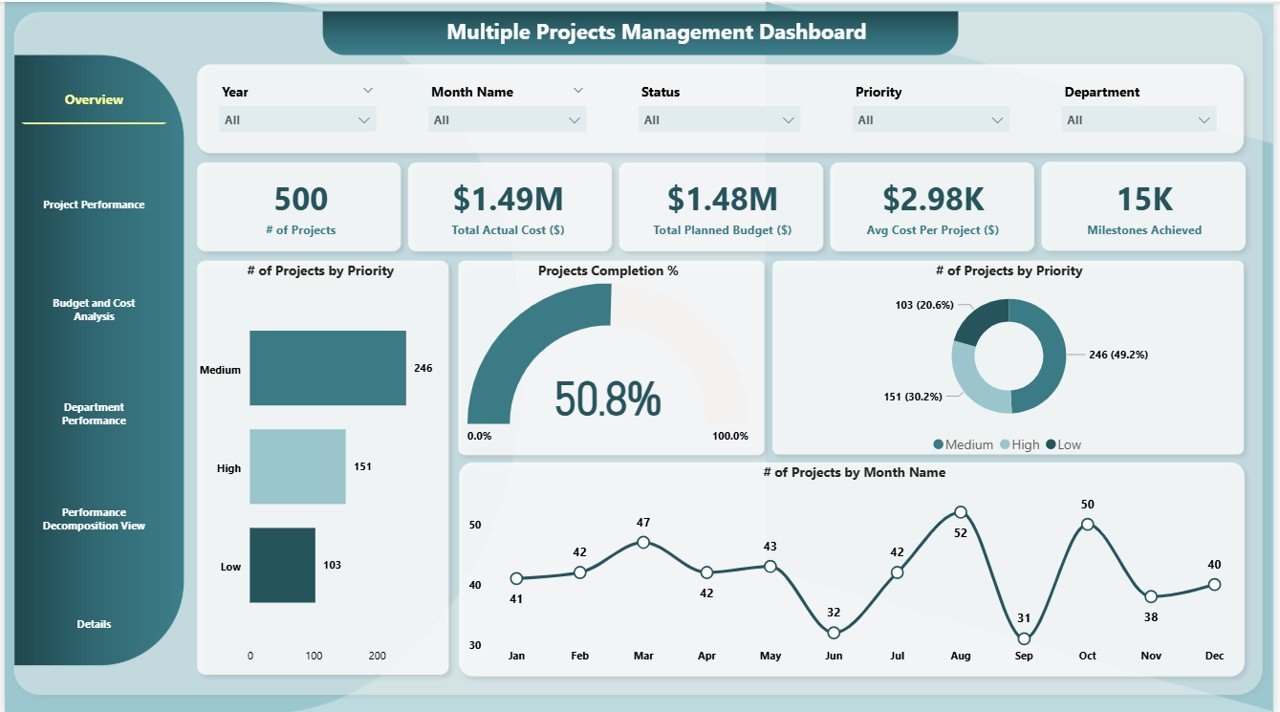
📌 Overview Page
Gain a bird’s-eye view of all ongoing projects:
# of Projects – Total active projects
Actual Cost – Amount spent so far
Total Planned Budget – Aggregated project budgets
Average Cost per Project – Cost efficiency insights
Milestones Achieved – Progress indicator
Charts – Completion %, priority-wise project distribution, and monthly activity
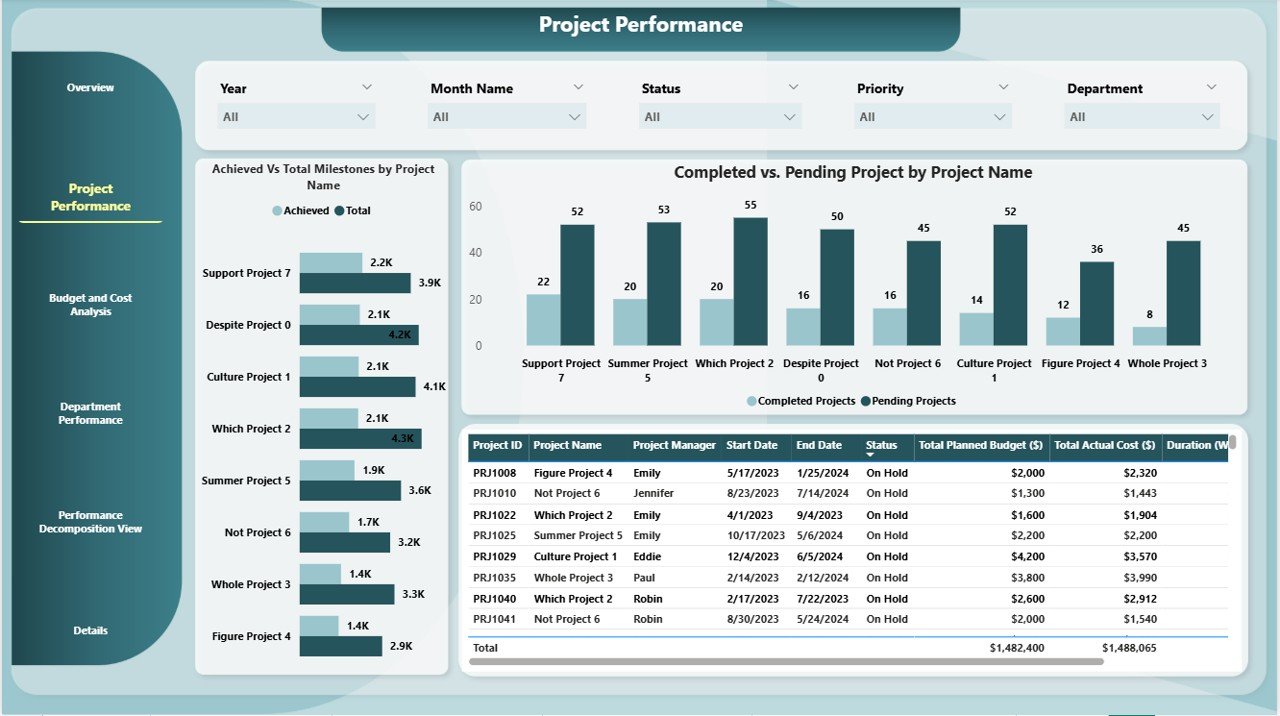
📊 Project Performance Page
Dive deeper into how individual projects are progressing:
Achieved vs Total Milestones by Project Name
Completed vs Pending Projects Chart
Track timelines, detect delays, and identify underperforming projects fast.
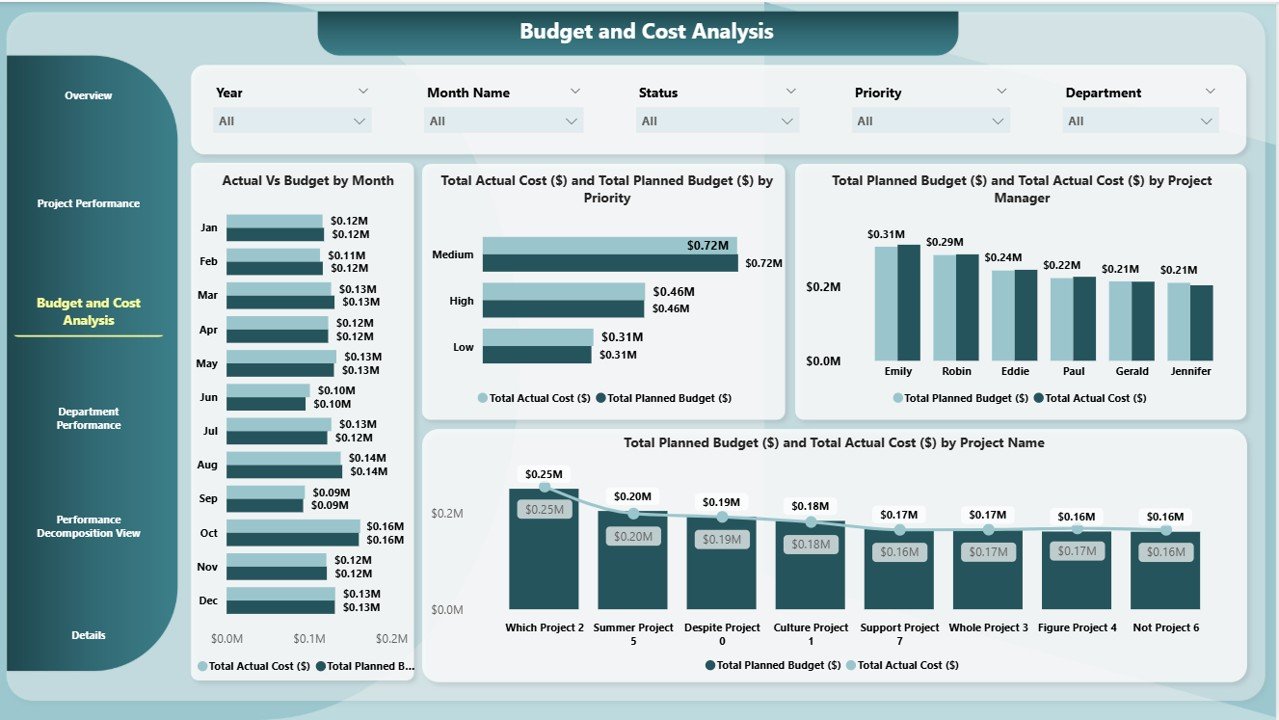
💰 Budget and Cost Analysis Page
Keep your financials in check with:
Actual vs Budget by Month
Cost/Budget Breakdown by Priority, Project Manager, and Project Name
Quickly spot overspending or under-budget performance.
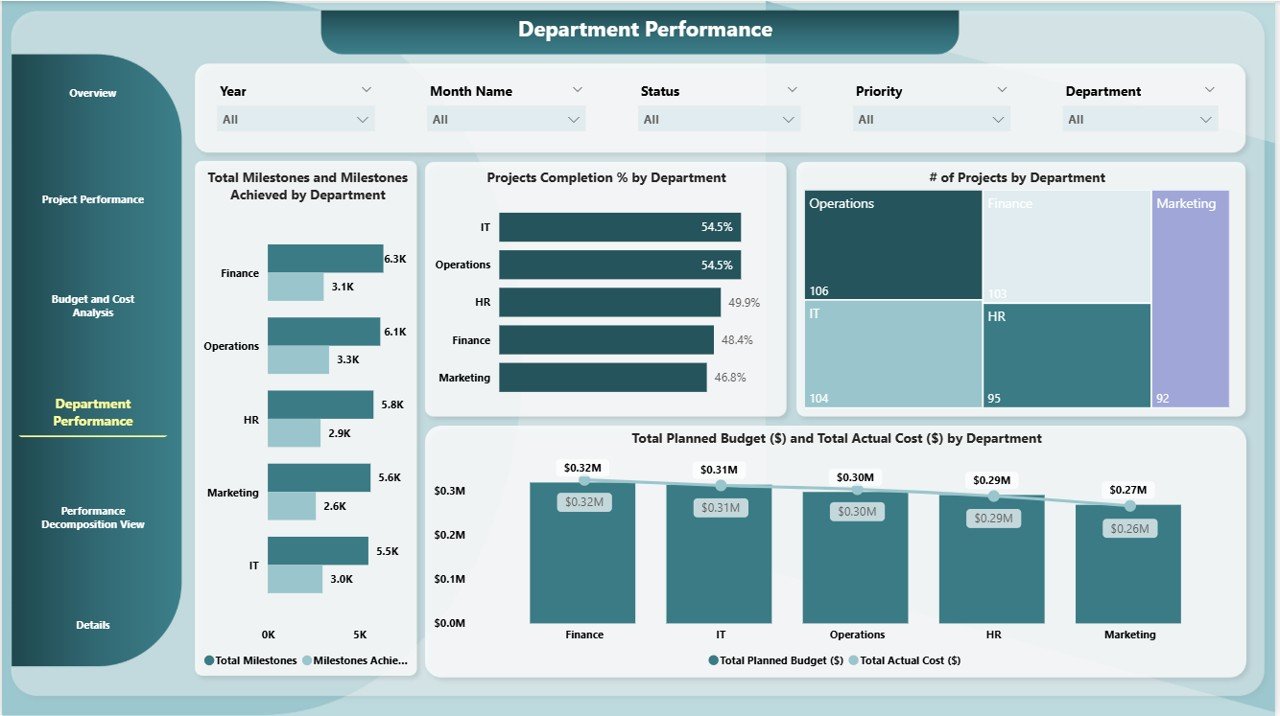
🏢 Department Performance Page
Analyze how each department contributes:
Milestones Achieved vs Set by Department
Project Completion % and Count by Department
Financial Comparison: Planned Budget vs Actual Cost by Department
Perfect for team performance reviews.
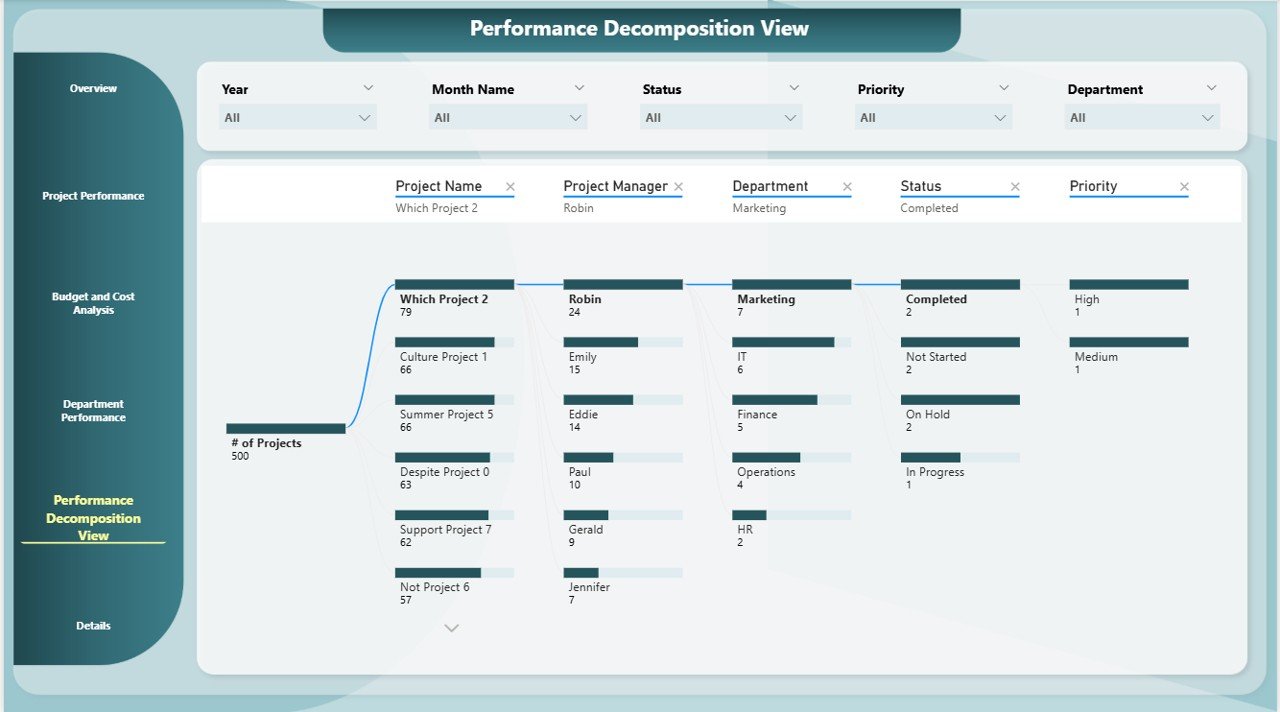
🌐 Performance Decomposition View Page
Use Power BI’s Decomposition Tree to:
Drill down into root causes of cost overruns or delays
Segment data by priority, department, project, or timeline
Perform deeper performance analysis with ease
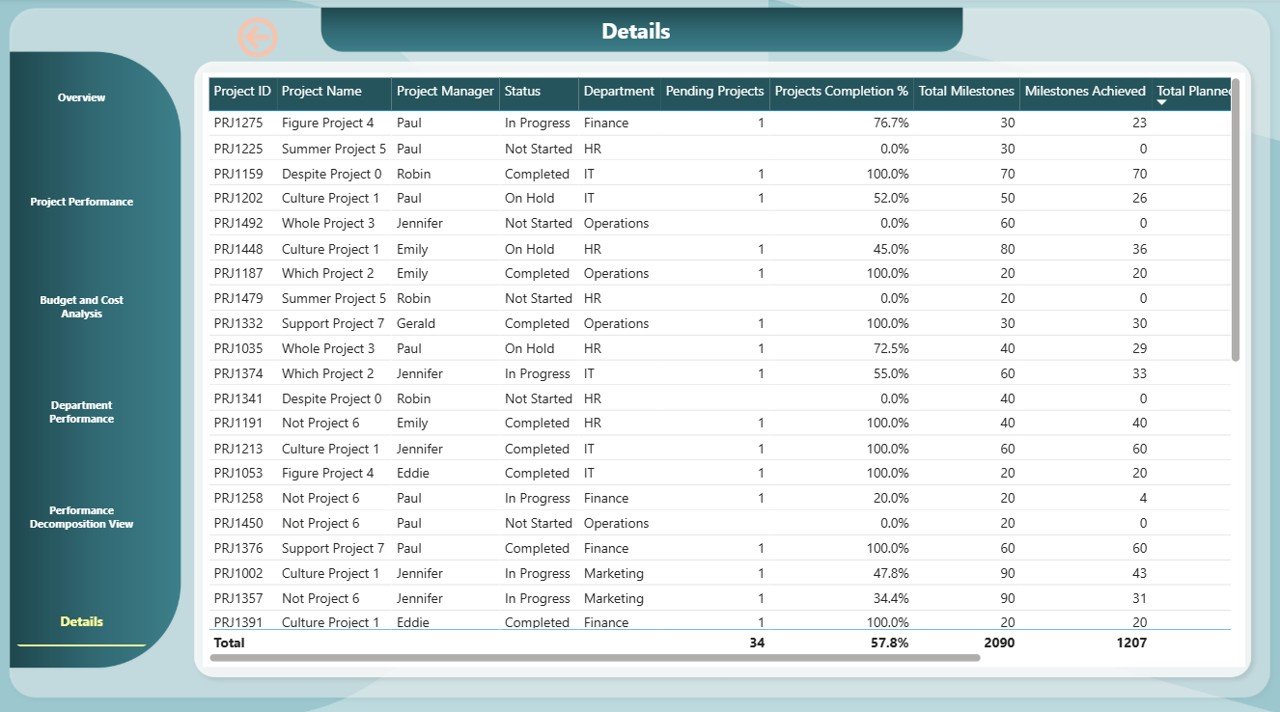
📄 Details Page
View complete details of each project:
Budgets, milestones, costs, and completion progress
Drill down into individual project metrics for granular analysis
📈 What’s Inside the Dashboard Package?
✅ Fully functional Power BI Dashboard (.pbix file)
✅ 6 dedicated report pages: Overview, Project Performance, Budget Analysis, Department Summary, Decomposition Tree, and Details
✅ Real-time interactive visuals
✅ Editable and customizable visuals
✅ Compatible with Power BI Desktop and Power BI Service
✅ Demo dataset for immediate use
✅ Clean UI for non-technical users
🧩 How to Use the Dashboard
Download & open the .pbix file in Power BI Desktop
Connect your project data from Excel, SQL, or other sources
Update tables with your actual metrics and details
Explore charts, filter data, and drill down to project or department level
Customize visuals to match your branding or KPIs
Publish to Power BI Service for team-wide access
This dashboard is designed to help decision-makers move fast with facts, not guesswork.
👥 Who Can Use This Dashboard?
🧑💼 Project Managers – Oversee dozens of projects in one view
🧾 PMO & Executives – Get strategic insights from aggregated reports
🧰 Consultants – Manage client portfolios across industries
🏢 Corporate Teams & SMEs – Track internal or client-based projects
📊 Data Analysts – Visualize project KPIs with advanced filtering
It’s suitable for any business that runs more than one project at a time — regardless of industry or team size.
🔥 Why Choose This Power BI Dashboard?
Real-time, interactive insights
Designed for efficiency, clarity, and collaboration
Saves time spent on spreadsheets and manual tracking
Ideal for project reviews, budget audits, and team update













Reviews
There are no reviews yet.