

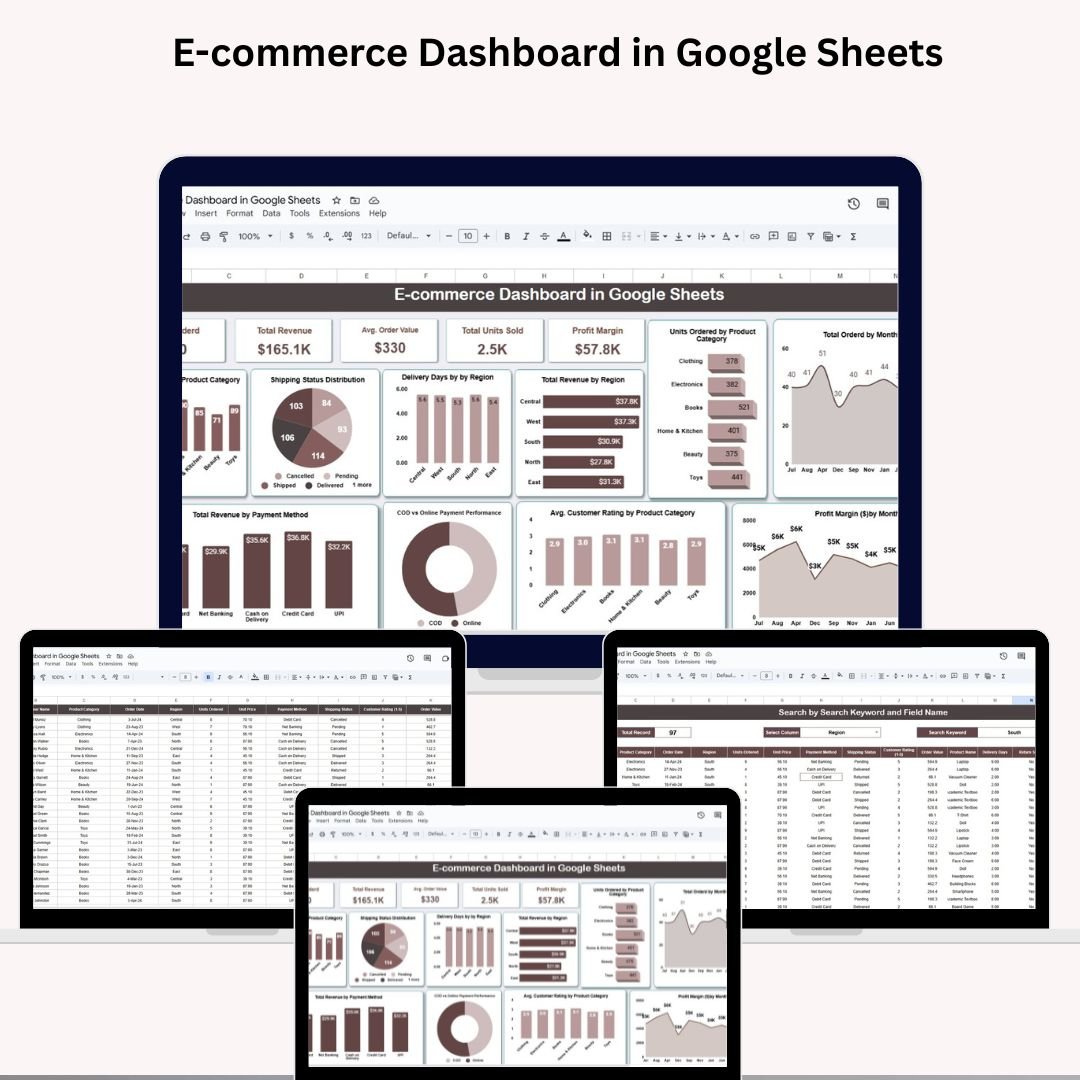

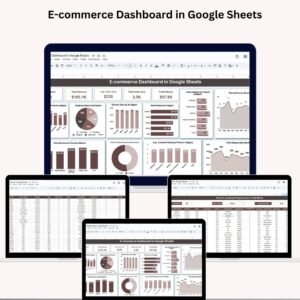
Running an online business without performance insights is like flying blind. That’s why the E-commerce Dashboard in Google Sheets is a game-changer! Designed for e-commerce entrepreneurs, marketers, and analysts, this ready-to-use dashboard helps you monitor key sales metrics, customer trends, product performance, and much more — all in one centralized, visual tool. 📊
Whether you’re selling fashion, gadgets, groceries, or digital goods, this dashboard helps you make smarter, data-driven decisions — straight from your browser, no coding or software needed! ✅
📌 Key Features of the E-commerce Dashboard in Google Sheets
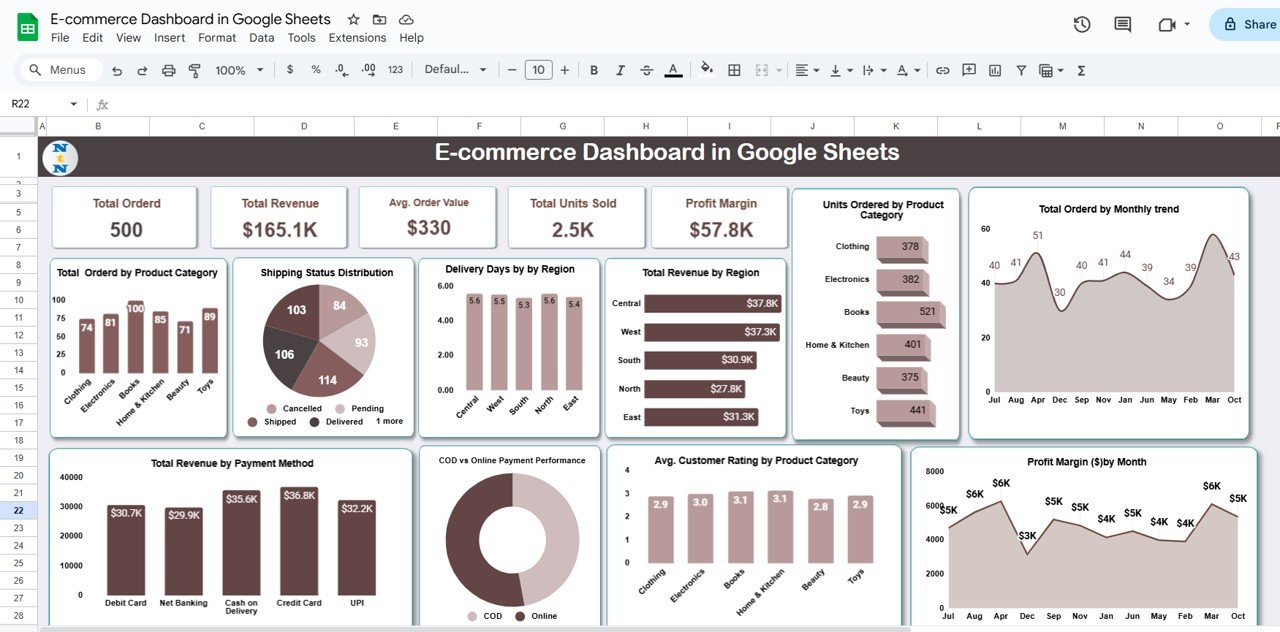
📊 Dynamic Dashboard Tab
📦 Total Ordered – See how many orders your store is fulfilling
💰 Total Revenue – Instantly monitor your earnings
💳 Avg. Order Value – Know your customer spend habits
📈 Total Units Sold – Track the product volume moved
🧮 Profit Margin – Calculate your profitability in real-time
📈 Powerful Visual Charts
🗂️ Orders by Product Category
🚚 Shipping Status breakdown
🌍 Delivery Days by Region
💸 Revenue by Region
📦 Units Ordered by Category
📆 Monthly Order Trend
💹 Monthly Profit Margin
⭐ Customer Rating by Category
🏧 COD vs Online Payment comparison
🏦 Revenue by Payment Method
With these visuals, you’ll always know which products perform best, which regions are your goldmine, and which payment method drives revenue.
📂 What’s Inside the E-commerce Dashboard in Google Sheets
📌 Dashboard Tab
The main tab features interactive cards and charts for tracking business health at a glance.
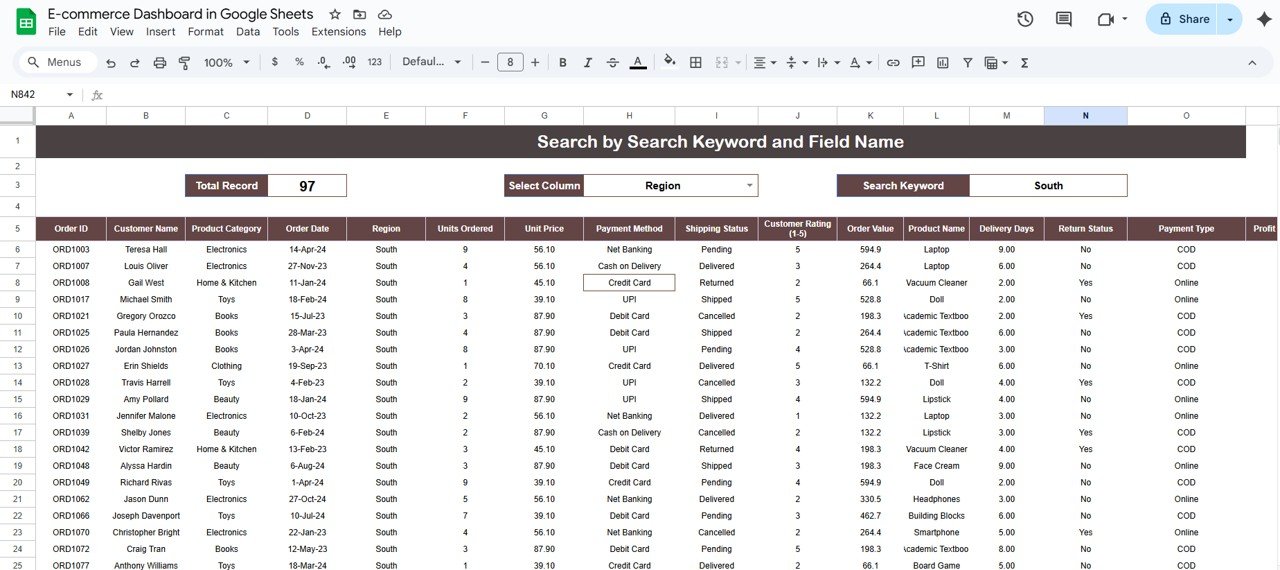
🔍 Search Tab
Use built-in filters to find specific orders by:
Region
Order ID
Payment Method
Shipping Status
Product Category
This makes analyzing a single slice of your data simple and efficient.
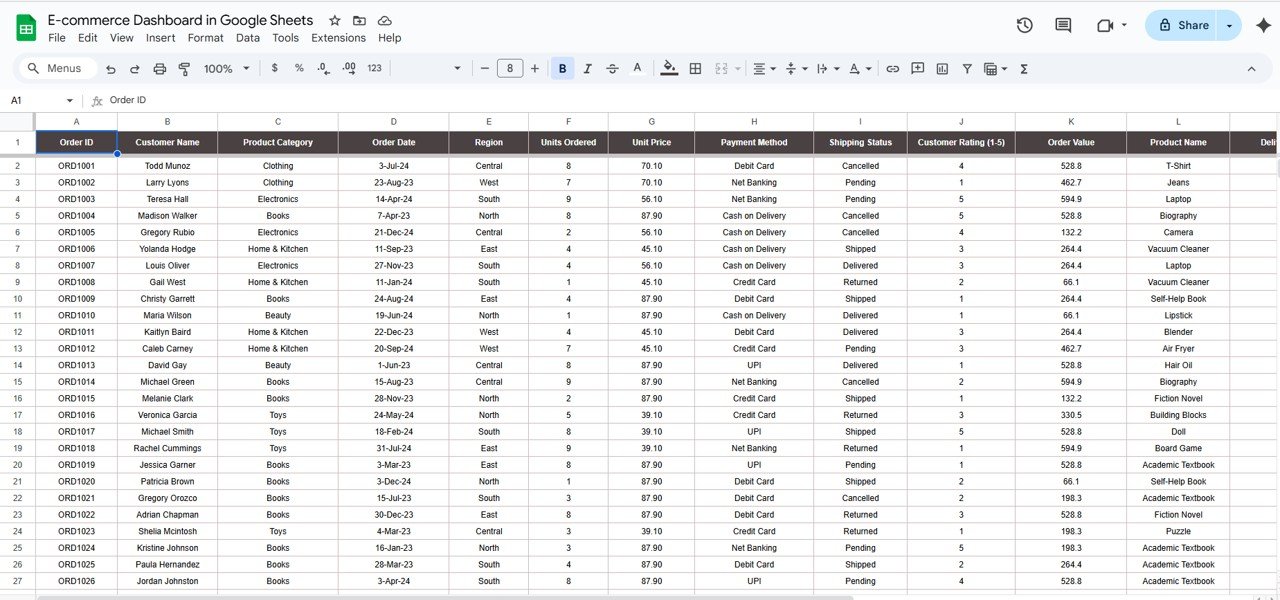
📝 Data Tab
This is your input powerhouse! Just add new rows with fields like:
Order ID
Customer Name
Order Date
Region
Units Ordered
Unit Price
Product Category
Payment Type
Shipping Status
Delivery Days
Rating
Profit Margin
Your dashboard and charts will update automatically. 🔁
🧑💻 How to Use the E-commerce Dashboard in Google Sheets
1️⃣ Enter Order Data – Add new orders in the Data tab.
2️⃣ View Dashboard – Navigate to the Dashboard tab to explore auto-updated insights.
3️⃣ Filter with Search – Use the Search tab to drill down by any field.
4️⃣ Customize Freely – Add new fields or adjust formulas to suit your store.
5️⃣ Share Easily – Collaborate live with your team or share it with stakeholders.
Everything runs in your Google account. No installation. No cost. No hassle. 🆓
👥 Who Can Benefit from This Dashboard?
🛍️ E-commerce Store Owners – Track sales and customer trends
📦 Product Managers – Identify high-performing products
📊 Digital Marketers – Analyze ROI by category or campaign
🧾 Finance Teams – Monitor margins and revenue by payment type
🧑💼 Operations Managers – Improve delivery efficiency
📈 Startup Founders – Scale your online business with visibility
💼 Freelancers & Consultants – Use as a reporting tool for clients
If you sell online—this is for you. 💥
💡 Why Choose This Google Sheets Dashboard?
✔️ All-in-One View – Cards, charts, filters & search in one tab
✔️ Real-Time Sync – Instantly reflects any new order entered
✔️ Customizable Layout – Modify fields, visuals & structure
✔️ Zero Learning Curve – Clean, no-code spreadsheet design
✔️ Cloud Collaboration – Share & edit live with your team
✔️ Perfect for Small & Growing Businesses
✔️ Budget-Friendly – No expensive software needed
🔗 Click here to read the Detailed blog post
Click here to read the Detailed blog post
🎥 Visit our YouTube channel to learn step-by-step video tutorials
👉 Youtube.com/@NeotechNavigators
Watch the step-by-step video tutorial:
Compatibility and Requirements
- Works in Google Sheets with a free Google account and a web browser. Nothing to install.
- Charts are standard Google Sheets charts. Google explains them in Add & edit a chart or graph.
Frequently Asked Questions
Which KPIs does the dashboard show?
Total Ordered, Total Revenue, Avg. Order Value, Total Units Sold and Profit Margin.
How do I add new orders?
Add a row in the Data tab with fields such as Order ID, order date, region, units, unit price, category, payment type, shipping status and rating. The cards and charts update automatically.
Can I look up a single order?
Yes. The Search tab filters by region, Order ID, payment method, shipping status or product category.
Can I compare COD and online payments?
Yes. One chart compares COD with online payment and another shows revenue by payment method.
Related E-commerce Templates
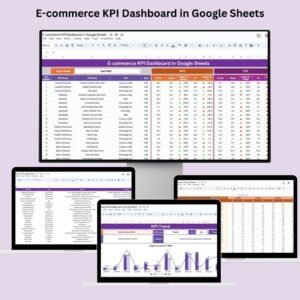
- E-commerce KPI Dashboard in Google Sheets: tracks e-commerce KPIs against targets
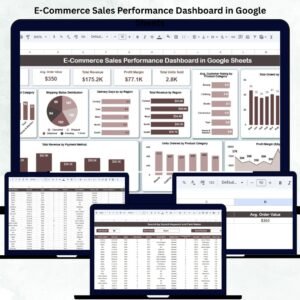
- E-Commerce Sales Performance Dashboard in Google Sheets: focuses on sales performance
- E-commerce Dashboard in Excel: the same topic in Excel
- E-commerce Dashboard in Power BI: the same topic in Power BI
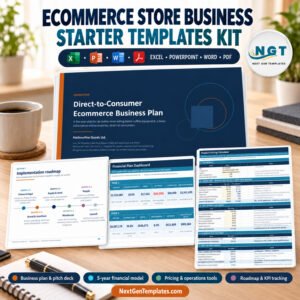
- Ecommerce Store Business Starter Templates Kit: a starter kit for online stores
Browse all Google Sheets dashboards or the Google Sheets sales and marketing templates.





























Reviews
There are no reviews yet.