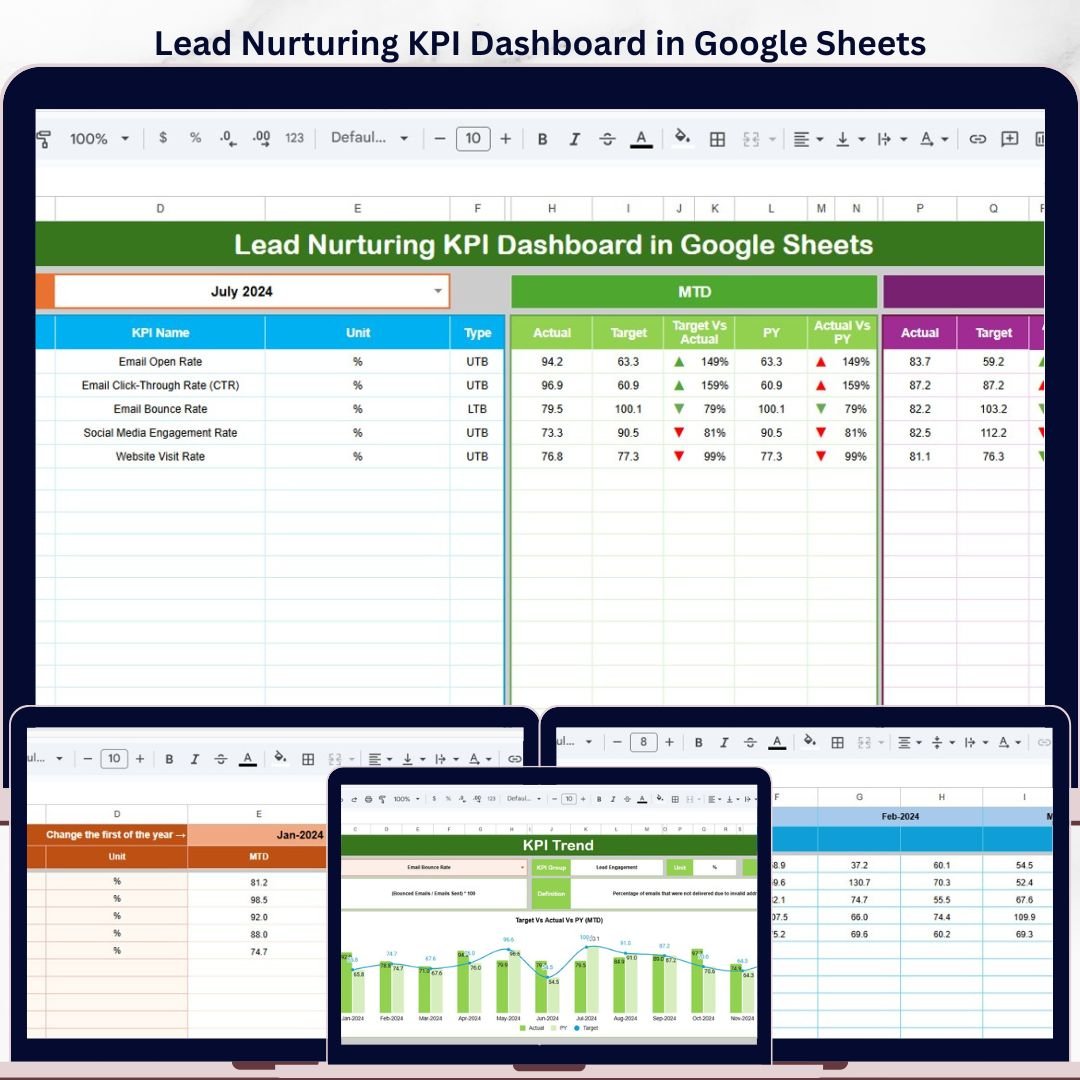


Lead Nurturing KPI Dashboard in Google Sheets gives sales and marketing teams 6 connected worksheets, a month selector, MTD and YTD actuals, targets, previous-year comparisons, and per-KPI trend charts in one browser-based template. Instead of reviewing CRM exports, campaign spreadsheets, and follow-up reports separately, you can monitor lead quality, conversion, engagement, and funnel health from one shared file. Built by PK, a Microsoft Certified Professional with 15+ years of spreadsheet dashboard experience and 300K+ YouTube subscribers, this template is a low-risk, one-time purchase at the launch sale price of $8.99.
Key Features of Lead Nurturing KPI Dashboard in Google Sheets
- MTD and YTD KPI tracking for monthly and year-to-date lead nurturing performance.
- Actual vs. Target comparison with conditional formatting arrows for quick performance review.
- Current year vs. previous year comparison to spot growth, decline, and seasonal changes.
- Dropdown month selector on the Dashboard sheet so the whole view updates for the selected month.
- KPI Trend sheet with selectable KPI name, KPI group, unit, type, formula, definition, and trend charts.
- Editable KPI Definition sheet so you can document lead nurturing metrics in plain language.
- Cloud collaboration through Google Sheets sharing, useful for marketing, sales, and revenue operations teams.
What’s Inside the Lead Nurturing KPI Dashboard in Google Sheets
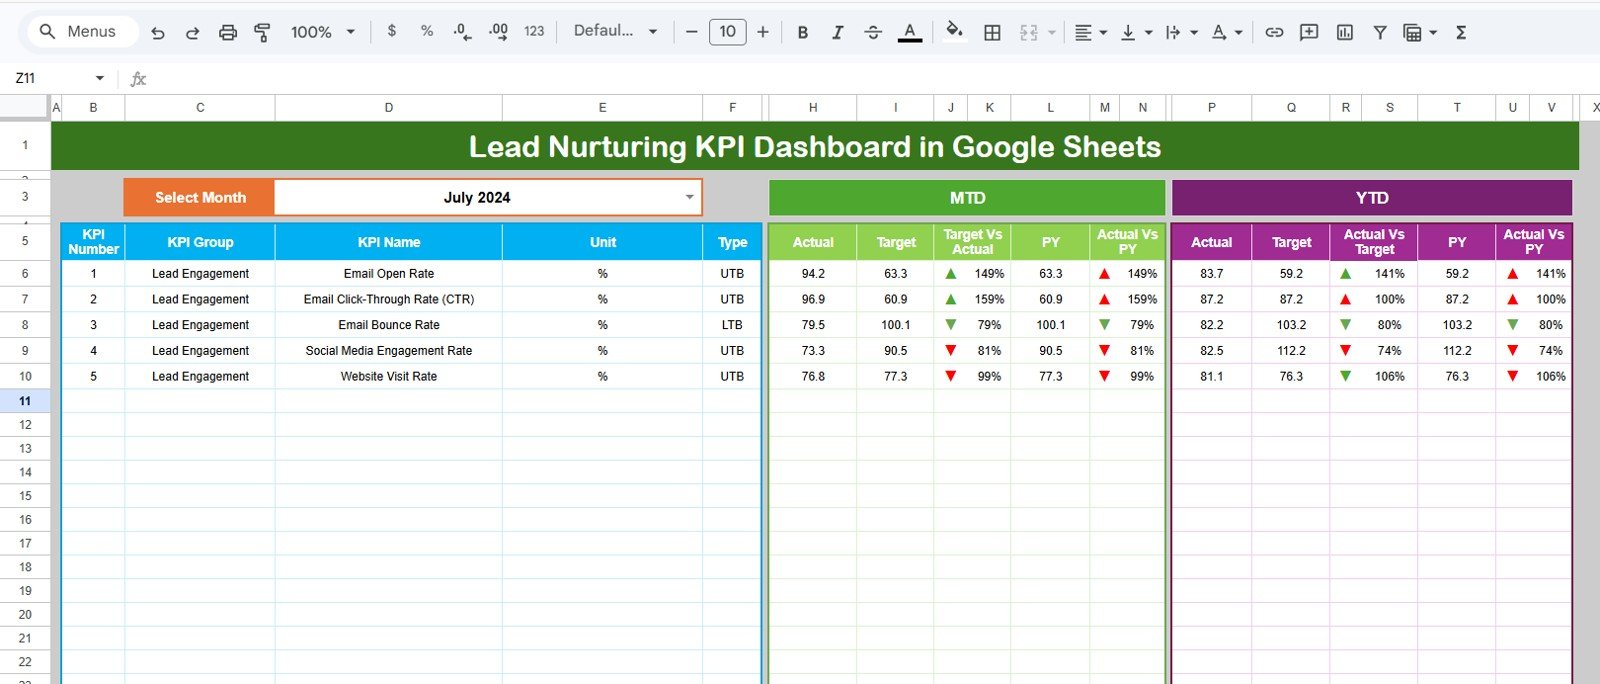
Dashboard sheet tab
This is the main sheet tab. On range D3, select a month from the drop-down and the dashboard numbers update for that period. The sheet shows MTD Actual, Target, and Previous Year data, plus Target vs Actual and PY vs Actual comparisons with conditional formatting up and down arrows. The same structure is repeated for YTD performance, so teams can see short-term progress and full-year movement together.
Lead Nurturing KPI Dashboard in Google Sheets
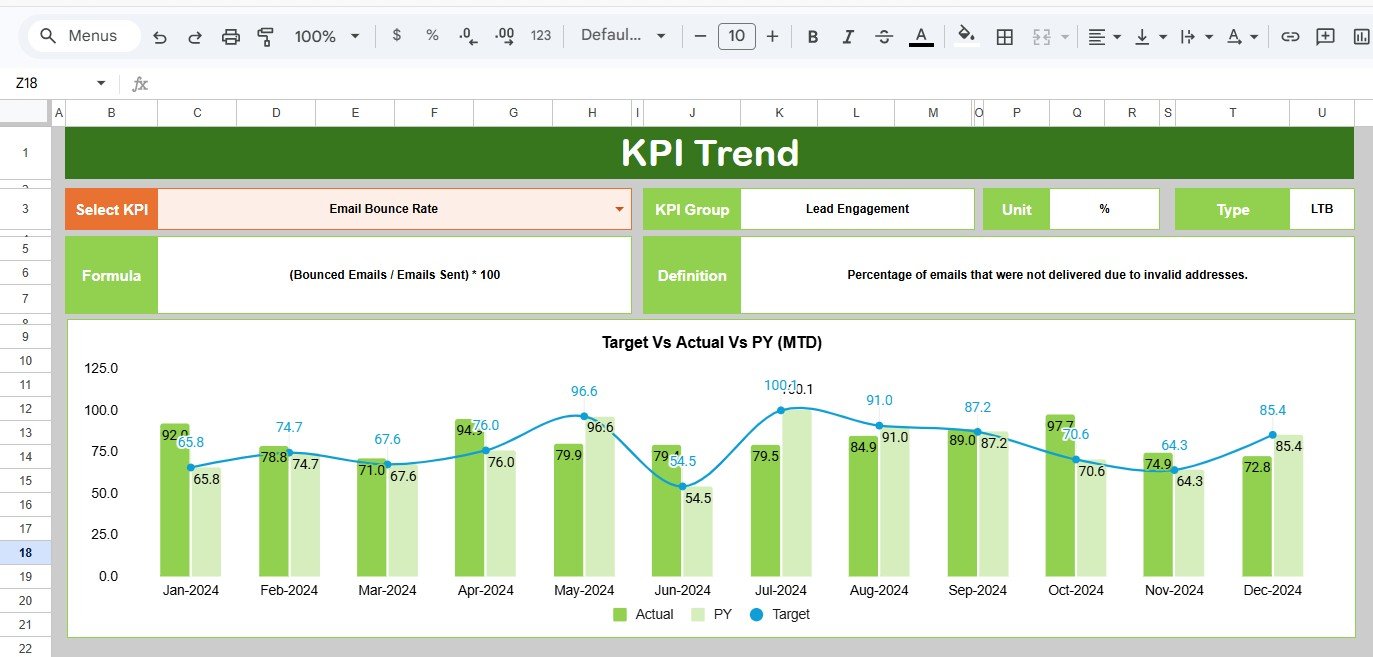
KPI Trend sheet tab
The KPI Trend sheet lets you select a KPI name from the drop-down in range C3. It displays the KPI group, unit, KPI type, formula, and definition, then shows MTD and YTD trend charts for Actual, Target, and Previous Year values. This helps diagnose whether a weak month is an isolated dip or part of a larger trend.
KPI Trend Sheet
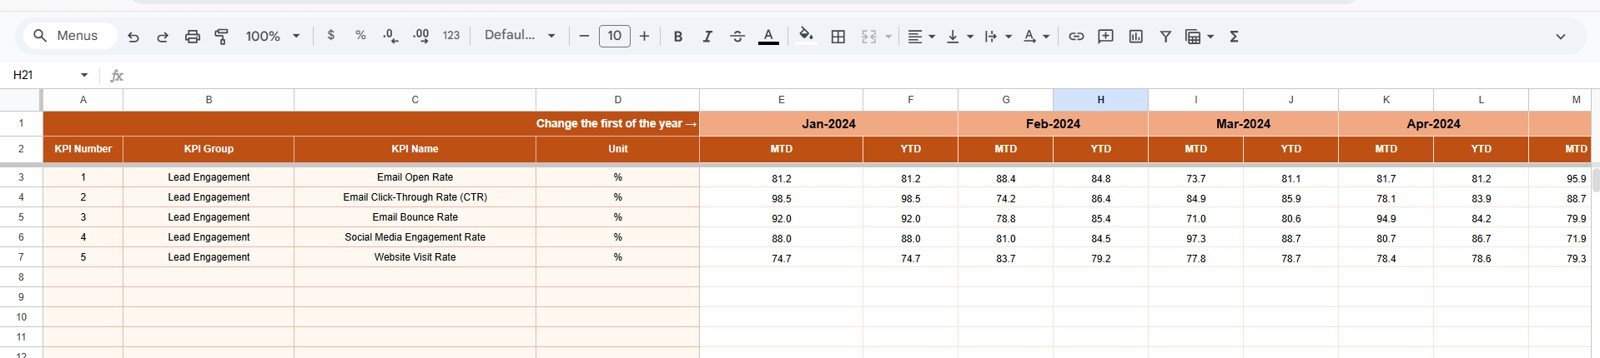
Actual Numbers Input sheet
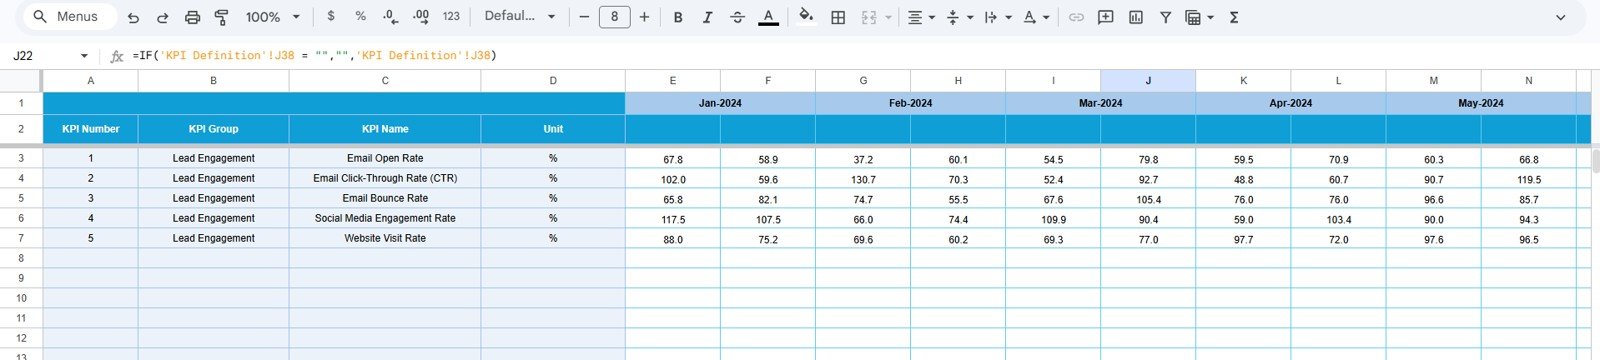
Enter actual MTD and YTD lead nurturing numbers for each KPI in this sheet. You can change the first month of the year from range E1, making the template adaptable to calendar-year or fiscal-year reporting.
Actual Numbers Input sheet
Target Number Input sheet
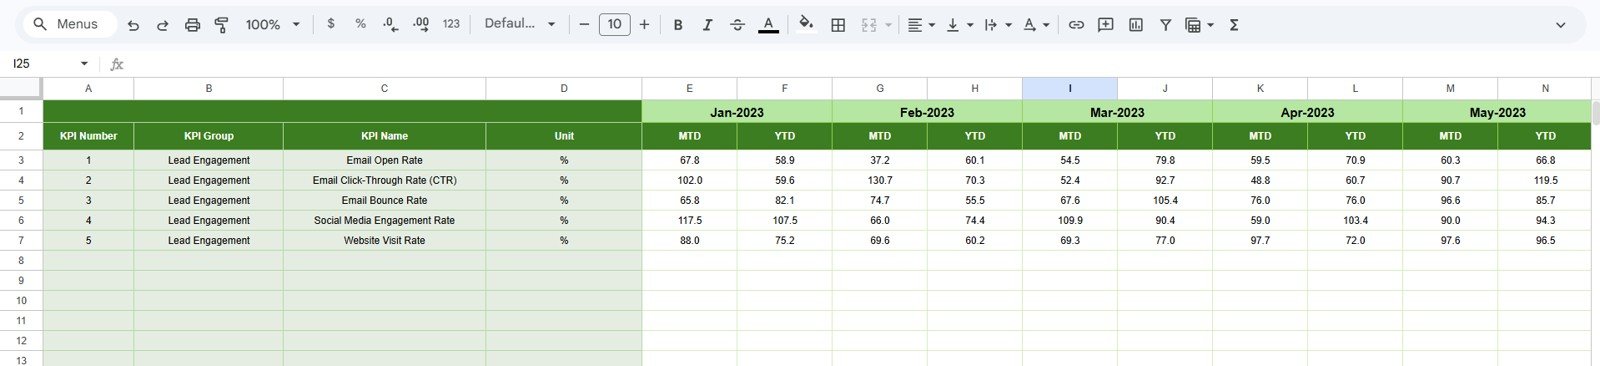
This sheet stores the target values for each KPI by month, for both MTD and YTD reporting. It gives the dashboard a clean benchmark for monthly marketing reviews, campaign retrospectives, and sales pipeline meetings.
Target Number Input sheet
Previous Year Number sheet tab
Enter previous-year values in the same layout as the current-year actual sheet. This lets the dashboard compare lead nurturing progress against the same period last year instead of judging every number in isolation.
Previous Year Number Input sheet
KPI Definition sheet tab
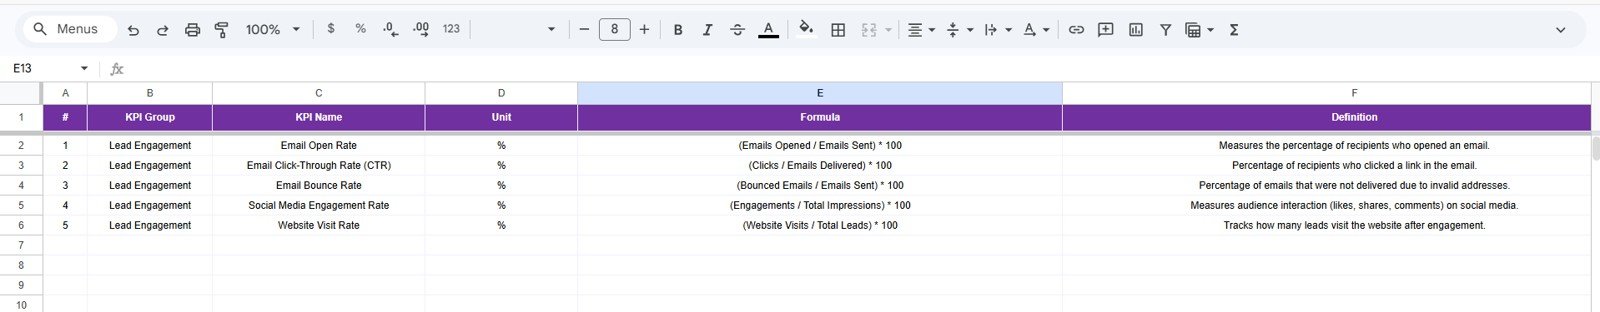
Use the KPI Definition sheet to maintain KPI Name, KPI Group, Unit, Formula, Definition, and KPI Type. In the last column, enter LTB for Lower the Better or UTB for Upper the Better, so the dashboard can interpret performance direction correctly.
KPI Definition sheet
Lead Nurturing KPI Dashboard in Google Sheets vs. Microsoft Excel vs. Paid CRM/SaaS – Where This Fits
| Feature | This Google Sheets Template | Microsoft Excel Dashboard | Paid CRM/SaaS |
|---|---|---|---|
| Cost | $8.99 one-time | One-time template plus Excel license | Often monthly per-user fees |
| Platform | Google Sheets in browser | Excel desktop or Microsoft 365 | Vendor cloud platform |
| Setup time | Under 10 minutes once the copy link is opened | Under 10 minutes for a template | Days or weeks for CRM configuration |
| Real-time team collaboration | Built into Google Sheets | Requires OneDrive or SharePoint | Usually included on paid plans |
| Custom KPI definitions | Editable KPI Definition sheet | Editable workbook | Depends on admin permissions |
| Year-1 cost at 5 users | $8.99 | Template plus licenses | Can reach hundreds or thousands per year |
Who This Template Is For – and Who It’s Not For
This template is for marketing managers, sales operations analysts, revenue operations teams, founders, and consultants who want a practical lead nurturing scorecard without building one from scratch.
It is not for teams that need live CRM sync, automated email workflows, lead scoring APIs, SMS automation, or enterprise user permissions. For those needs, use a CRM platform and treat this Google Sheets dashboard as a lightweight reporting layer.
How to Use the Lead Nurturing KPI Dashboard in Google Sheets
- Open the PDF guide from your download and use the Google Sheets copy link.
- Update the KPI Definition sheet with your lead nurturing metrics, units, formulas, and KPI type.
- Enter monthly actual values in the Actual Numbers Input sheet.
- Enter monthly target values in the Target Number Input sheet.
- Add previous-year values for year-over-year comparison.
- Select the month on the Dashboard sheet and review MTD and YTD performance.
- Use the KPI Trend sheet to investigate one metric at a time.
Real-World Use Cases
Priya, marketing manager: Priya tracks email engagement, MQL-to-SQL conversion, demo request rate, and follow-up completion in one monthly dashboard before campaign review meetings.
Marcus, revenue operations analyst: Marcus uses the KPI Trend sheet to compare current-year conversion rate against target and previous-year values, then flags underperforming months for sales follow-up analysis.
Elena, founder of a B2B services firm: Elena wants visibility without a full CRM analytics subscription. She updates Google Sheets monthly and shares a view-only dashboard link with her small sales team.
Frequently Asked Questions
What does this lead nurturing dashboard track?
It can track any lead nurturing KPI you define, such as lead engagement rate, MQL-to-SQL conversion, follow-up completion, email response rate, demo booking rate, pipeline contribution, and lead-to-customer conversion.
Can I change the KPIs?
Yes. The KPI Definition sheet is editable. You can add, remove, or rename KPIs and update formulas and definitions to match your sales and marketing process.
Does this require Excel?
No. This version is built for Google Sheets. You only need a Google account and access to Google Drive to create your editable copy.
Can multiple team members use it?
Yes. Google Sheets sharing lets you invite team members with view, comment, or edit access, depending on how you want to manage the file.
Is this a CRM replacement?
No. It is a reporting dashboard for lead nurturing KPIs. It does not replace CRM workflows, email automation, contact history, or sales activity tracking.
About the Author
Built by PK – Microsoft Certified Professional with 15+ years of Excel, Google Sheets, and Power BI experience. Founder of NextGenTemplates, reaching 300K+ subscribers across YouTube channels. Every template is hand-built and tested before release.
Explore Related Templates
- Lead Nurturing KPI Dashboard in Excel – the Excel version for spreadsheet-first teams.
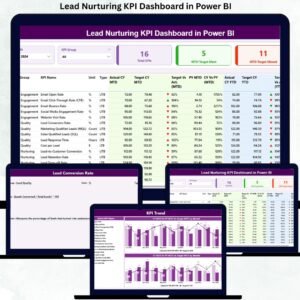
- Lead Nurturing KPI Dashboard in Power BI – the Power BI version for richer BI visuals.
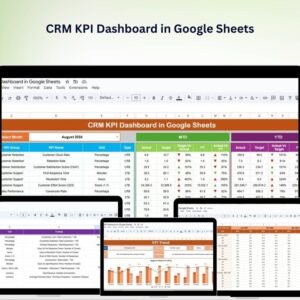
- CRM KPI Dashboard in Google Sheets – a broader customer relationship management scorecard.
- Sales Funnel KPI Dashboard in Power BI – a companion for funnel conversion analytics.
- Browse Google Sheets KPI Dashboard templates.
Click here to read the detailed blog post
Ready to track lead nurturing performance in Google Sheets? Download the Lead Nurturing KPI Dashboard in Google Sheets


Reviews
There are no reviews yet.